Global Off-Grid Renewable Energy Systems Market Forecast 2025–2034 | CAGR of 9.1%
Global Off-Grid Renewable Energy Systems Market Size, Share, Analysis Report By Technology (Solar Energy Systems, Wind Energy Systems, Energy Storage Systems, Biomass Energy Systems, Hydro Energy Systems), Application (Residential, Commercial, Industrial, Community), Region and Key Players - Industry Segment Overview, Market Dynamics, Competitive Strategies, Trends and Forecast 2025-2034
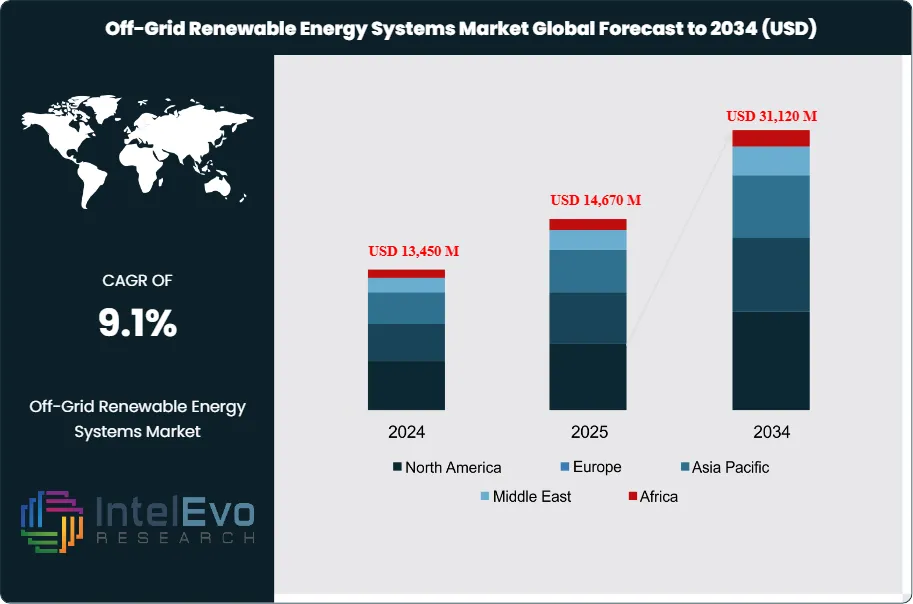
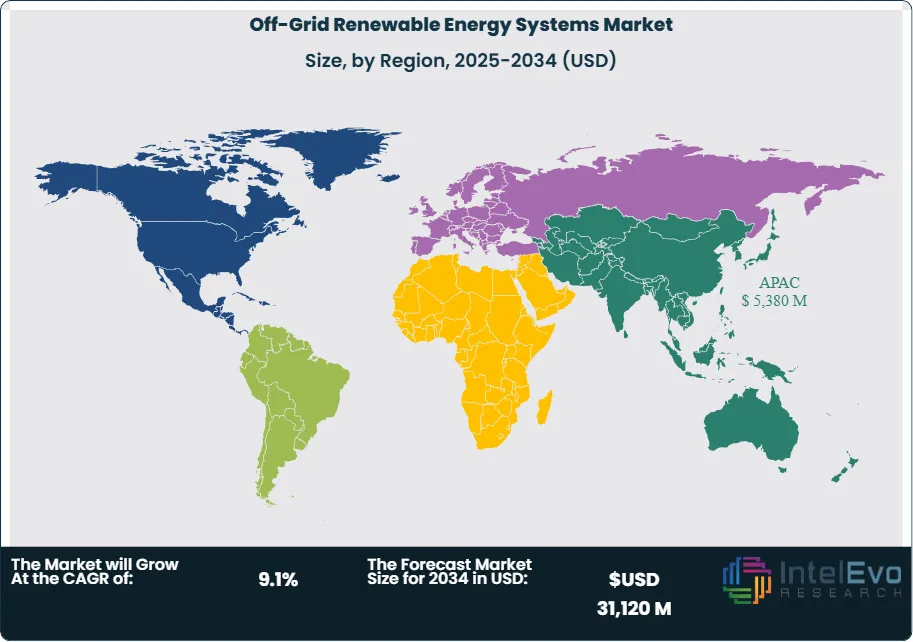
The Global Off-Grid Renewable Energy Systems Market size is projected to reach approximately USD 31,120 million by 2034, up from USD 13,450 million in 2024, growing at a CAGR of 9.1% during the forecast period from 2025 to 2034. This growth is fueled by increasing demand for reliable electricity access in remote and rural areas, rising adoption of solar, wind, and hybrid energy solutions, and supportive government policies promoting renewable energy. Technological advancements in energy storage, microgrids, and smart monitoring systems are further accelerating market adoption. Off-grid renewable energy systems are becoming a critical solution for energy security, sustainability, and climate action, reshaping power access in underserved regions worldwide.
The Global Off-Grid Renewable Energy Systems Market encompasses a variety of technologies and products that provide renewable energy solutions independent of traditional grid systems. These systems often include solar panels, wind turbines, and energy storage solutions like batteries. The market is driven by rising energy demands in remote areas, increasing energy prices, and a growing focus on sustainability. As countries strive to meet renewable energy targets, the off-grid sector is becoming increasingly vital. The current market is characterized by a surge in investments and innovations, particularly in solar energy technologies, making renewable energy more accessible and affordable for off-grid communities.
Several growth dynamics are contributing to the expansion of the off-grid renewable energy market. Key drivers include the urgent need for energy access in developing regions, where traditional grid infrastructure is lacking or unreliable. Additionally, the decreasing costs of solar photovoltaic (PV) technology and energy storage systems are making off-grid solutions more attractive. Government incentives and subsidies aimed at promoting clean energy adoption further propel market growth. The rising awareness of climate change and the need for sustainable energy practices also play a significant role in driving investments in off-grid renewable systems. Collectively, these factors create a favorable environment for market expansion, particularly in emerging economies.
Regionally, the off-grid renewable energy market exhibits significant variations in growth and adoption rates. In Africa, for instance, off-grid solar systems are gaining traction due to limited access to electricity and abundant sunlight. Asia-Pacific also showcases robust growth, driven by countries like India and China, where there is a substantial demand for energy in rural areas. In North America and Europe, there is a growing focus on energy independence and sustainability, resulting in increasing investments in off-grid technologies. Each region faces unique challenges and opportunities, shaping the overall landscape of the market.
The COVID-19 pandemic has had a mixed impact on the off-grid renewable energy market. Initially, the pandemic disrupted supply chains and delayed project implementations due to lockdowns and restrictions. However, as economies recover, there is a renewed emphasis on green recovery and sustainable development, which bodes well for the market's future. Increased remote working has also highlighted the need for reliable energy sources in off-grid settings. As a result, the market is expected to rebound strongly, with a focus on resilience and adaptability in energy systems.
Key Takeaways:
Market Growth: The off-grid renewable energy systems market is projected to reach USD 31,120 million by 2034, growing at a robust CAGR of 9.1%, indicating strong market expansion driven by rising energy demands and sustainability initiatives.
Technology Segment Analysis: Solar energy systems dominate the market, accounting for the largest share due to declining costs and widespread adoption. The versatility and accessibility of solar technologies make them ideal for off-grid applications, particularly in rural areas with limited grid access.
Application Segment Analysis: The residential application segment is witnessing significant growth as households seek reliable energy solutions in remote locations. The increased availability of affordable solar home systems is driving adoption, enhancing energy independence for families.
Driver: The primary driver for market growth is the urgent need for energy access in developing regions where traditional grid infrastructure is lacking. Rising energy prices and a focus on sustainability also contribute to the increasing demand for off-grid renewable systems.
Restraint: A key restraint is the high initial investment cost associated with off-grid renewable energy systems. Although prices have been decreasing, upfront costs can still pose a barrier for low-income households and small businesses, limiting widespread adoption.
Opportunity: There is a significant opportunity in the growing demand for off-grid solutions in emerging economies, particularly in Africa and Asia-Pacific. Innovations in energy storage and smart technologies can enhance the viability and attractiveness of off-grid systems.
Trend: The trend towards hybrid systems, combining solar, wind, and energy storage, is gaining momentum. This approach enhances energy reliability and efficiency, catering to diverse energy needs across various applications.
Regional Analysis: Asia-Pacific and Africa are expected to dominate the off-grid renewable energy systems market, driven by high energy demands, abundant renewable resources, and supportive government policies aimed at improving energy access.
Technology Segment:
The technology segment of the off-grid renewable energy systems market primarily comprises solar energy systems, wind energy systems, energy storage solutions, biomass energy systems, and hydro energy systems. Among these, solar energy systems hold a dominant position due to their versatility, decreasing costs, and advancements in photovoltaic technology. They are particularly well-suited for remote areas where traditional electricity grids are unavailable. Wind energy systems are also gaining traction, especially in regions with favorable wind conditions. Energy storage solutions, such as batteries, play a crucial role in ensuring a reliable power supply by storing excess energy generated from renewable sources for use during low production periods. Biomass and hydro systems contribute to diversifying the renewable energy mix, offering localized energy solutions tailored to specific geographical needs.
Application Segment:
The application segment of the off-grid renewable energy systems market is categorized into residential, commercial, industrial, and community applications. The residential segment is experiencing significant growth, driven by the increasing adoption of solar home systems and energy-efficient technologies. Families in rural and underserved areas seek reliable energy sources to meet their daily needs, leading to a rise in demand for off-grid solutions. Commercial applications, particularly in retail and hospitality, are also on the rise, as businesses aim to reduce energy costs and improve sustainability. Industrial applications focus on providing power to manufacturing units and remote operations, while community applications often involve larger-scale projects aimed at enhancing energy access for entire villages or regions, facilitating social and economic development.
Region Analysis:
Asia-Pacific Dominates Off-Grid Renewable Energy Systems Market with 40% Market Share: The Asia-Pacific region holds the largest market share in the off-grid renewable energy systems market, accounting for approximately 40% of the total. This dominance is primarily driven by countries like India and China, where rapid urbanization and a growing population have resulted in an urgent need for reliable energy access. Government initiatives, such as India's "Saubhagya Scheme," aim to provide electricity to rural households, boosting the adoption of off-grid solar solutions. Additionally, the region benefits from abundant renewable resources and decreasing technology costs, making solar and wind energy solutions increasingly attractive. Investment from both public and private sectors in renewable energy infrastructure further strengthens the region's position, ensuring sustained growth and development in off-grid energy solutions.
Africa is recognized as the fastest-growing region in the off-grid renewable energy systems market, with a projected growth rate exceeding 12% CAGR over the next decade. The continent's substantial energy access gap and reliance on fossil fuels drive a strong demand for renewable energy solutions. The increasing affordability of solar technology and the availability of innovative financing models, such as pay-as-you-go systems, empower households and small businesses to invest in off-grid solutions. Government policies aimed at enhancing energy access and sustainability, alongside the efforts of non-governmental organizations (NGOs), further propel market growth. Additionally, regions like Latin America and the Middle East are also witnessing significant developments, with various countries focusing on diversifying their energy portfolios and investing in renewable sources to achieve energy independence and sustainability goals.
By Energy Source (Solar, Wind, Hydro, Hybrid Systems, Biomass), By Component (Photovoltaic Panels & Modules, Wind Turbines, Batteries & Energy Storage, Inverters & Controllers, Microgrid Systems), By Technology (Solar Energy Systems, Wind Energy Systems, Energy Storage Systems, Biomass Energy Systems, Hydro Energy Systems), By End-User (Households, Small & Medium Enterprises, Non-Governmental Organizations (NGOs), Government & Public Sector), By Application (Residential Off-Grid Solutions, Commercial & Industrial Off-Grid Solutions, Community & Rural Electrification Projects, Emergency & Disaster Relief Applications
Research Methodology
Primary Research- 100 Interviews of Stakeholders
Secondary Research
Desk Research
Regional scope
North America (United States, Canada, Mexico)
Latin America (Brazil, Argentina, Columbia)
East Asia And Pacific (China, Japan, South Korea, Australia, Cambodia, Fiji, Indonesia)
Sea And South Asia (India, Singapore, Thailand, Taiwan, Malaysia)
Eastern Europe (Poland, Russia, Czech Republic, Romania)
Western Europe (Germany, U.K., France, Spain, Itlay)
Middle East & Africa (GCC Countries, Egypt, Nigeria, South Africa, Israel)
Competitive Landscape
Tesla Inc., Sunnova Energy International Inc., Siemens AG, Schneider Electric SE, Off-Grid Electric, SunPower Corporation, LG Electronics Inc., First Solar Inc., Vivint Solar, Canadian Solar Inc., Enphase Energy Inc., Baker Hughes Company, Trina Solar Limited, JinkoSolar Holding Co. Ltd., ReneSola Ltd., Akon Lighting Africa, d.light design Inc., Azuri Technologies Ltd., Genasun, Greenlight Planet Inc.
Customization Scope
Customization for segments, region/country-level will be provided. Moreover, additional customization can be done based on the requirements.
Pricing and Purchase Options
Avail customized purchase options to meet your exact research needs. We have three licenses to opt for: Single User License, Multi-User License (Up to 5 Users), Corporate Use License (Unlimited User and Printable PDF).
TABLE OF CONTENTS
1. EXECUTIVE SUMMARY
1.1. MARKET SNAPSHOT
1.2. KEY FINDINGS & INSIGHTS
1.3. ANALYST RECOMMENDATIONS
1.4. FUTURE OUTLOOK
2. RESEARCH METHODOLOGY
2.1. MARKET DEFINITION & SCOPE
2.2. RESEARCH OBJECTIVES: PRIMARY & SECONDARY DATA SOURCES
2.3. DATA COLLECTION SOURCES
2.3.1. COVERAGE OF 100+ PRIMARY RESEARCH/CONSULTATION CALLS WITH INDUSTRY STAKEHOLDERS
FIGURE 17 NORTH AMERICA OFF-GRID RENEWABLE ENERGY SYSTEMS CURRENT AND FUTURE TYPE ANALYSIS, 2025–2034, (USD MILLION)
FIGURE 18 NORTH AMERICA OFF-GRID RENEWABLE ENERGY SYSTEMS CURRENT AND FUTURE END USER ANALYSIS, 2025–2034, (USD MILLION)
FIGURE 19 MARKET SHARE BY COUNTRY
FIGURE 20 LATIN AMERICA OFF-GRID RENEWABLE ENERGY SYSTEMS CURRENT AND FUTURE TYPE ANALYSIS, 2025–2034, (USD MILLION)
FIGURE 21 LATIN AMERICA OFF-GRID RENEWABLE ENERGY SYSTEMS CURRENT AND FUTURE END USER ANALYSIS, 2025–2034, (USD MILLION)
FIGURE 22 MARKET SHARE BY COUNTRY
FIGURE 23 EASTERN EUROPE OFF-GRID RENEWABLE ENERGY SYSTEMS CURRENT AND FUTURE TYPE ANALYSIS, 2025–2034, (USD MILLION)
FIGURE 24 EASTERN EUROPE OFF-GRID RENEWABLE ENERGY SYSTEMS CURRENT AND FUTURE END USER ANALYSIS, 2025–2034, (USD MILLION)
FIGURE 25 MARKET SHARE BY COUNTRY
FIGURE 26 WESTERN EUROPE OFF-GRID RENEWABLE ENERGY SYSTEMS CURRENT AND FUTURE TYPE ANALYSIS, 2025–2034, (USD MILLION)
FIGURE 27 WESTERN EUROPE OFF-GRID RENEWABLE ENERGY SYSTEMS CURRENT AND FUTURE END USER ANALYSIS, 2025–2034, (USD MILLION)
FIGURE 28 MARKET SHARE BY COUNTRY
FIGURE 29 EAST ASIA AND PACIFIC OFF-GRID RENEWABLE ENERGY SYSTEMS CURRENT AND FUTURE TYPE ANALYSIS, 2025–2034, (USD MILLION)
FIGURE 30 EAST ASIA AND PACIFIC OFF-GRID RENEWABLE ENERGY SYSTEMS CURRENT AND FUTURE END USER ANALYSIS, 2025–2034, (USD MILLION)
FIGURE 31 MARKET SHARE BY COUNTRY
FIGURE 32 SEA AND SOUTH ASIA OFF-GRID RENEWABLE ENERGY SYSTEMS CURRENT AND FUTURE TYPE ANALYSIS, 2025–2034, (USD MILLION)
FIGURE 33 SEA AND SOUTH ASIA OFF-GRID RENEWABLE ENERGY SYSTEMS CURRENT AND FUTURE END USER ANALYSIS, 2025–2034, (USD MILLION)
FIGURE 34 MARKET SHARE BY COUNTRY
FIGURE 35 MIDDLE EAST AND AFRICA OFF-GRID RENEWABLE ENERGY SYSTEMS CURRENT AND FUTURE TYPE ANALYSIS, 2025–2034, (USD MILLION)
FIGURE 36 MIDDLE EAST AND AFRICA OFF-GRID RENEWABLE ENERGY SYSTEMS CURRENT AND FUTURE END USER ANALYSIS, 2025–2034, (USD MILLION)
FIGURE 37 NORTH AMERICA OFF-GRID RENEWABLE ENERGY SYSTEMS CURRENT AND FUTURE MARKET VOLUME SHARE REGIONAL ANALYSIS, 2025–2034, (USD MILLION)
FIGURE 38 U.S. OFF-GRID RENEWABLE ENERGY SYSTEMS CURRENT AND FUTURE TYPE ANALYSIS, 2025–2034, (USD MILLION)
FIGURE 39 U.S. OFF-GRID RENEWABLE ENERGY SYSTEMS CURRENT AND FUTURE END USER ANALYSIS, 2025–2034, (USD MILLION)
FIGURE 40 CANADA OFF-GRID RENEWABLE ENERGY SYSTEMS CURRENT AND FUTURE TYPE ANALYSIS, 2025–2034, (USD MILLION)
FIGURE 41 CANADA OFF-GRID RENEWABLE ENERGY SYSTEMS CURRENT AND FUTURE END USER ANALYSIS, 2025–2034, (USD MILLION)
FIGURE 42 LATIN AMERICA OFF-GRID RENEWABLE ENERGY SYSTEMS CURRENT AND FUTURE MARKET VOLUME SHARE REGIONAL ANALYSIS, 2025–2034, (USD MILLION)
FIGURE 43 MEXICO OFF-GRID RENEWABLE ENERGY SYSTEMS CURRENT AND FUTURE TYPE ANALYSIS, 2025–2034, (USD MILLION)
FIGURE 44 MEXICO OFF-GRID RENEWABLE ENERGY SYSTEMS CURRENT AND FUTURE END USER ANALYSIS, 2025–2034, (USD MILLION)
FIGURE 45 BRAZIL OFF-GRID RENEWABLE ENERGY SYSTEMS CURRENT AND FUTURE TYPE ANALYSIS, 2025–2034, (USD MILLION)
FIGURE 46 BRAZIL OFF-GRID RENEWABLE ENERGY SYSTEMS CURRENT AND FUTURE END USER ANALYSIS, 2025–2034, (USD MILLION)
FIGURE 47 ARGENTINA OFF-GRID RENEWABLE ENERGY SYSTEMS CURRENT AND FUTURE TYPE ANALYSIS, 2025–2034, (USD MILLION)
FIGURE 48 ARGENTINA OFF-GRID RENEWABLE ENERGY SYSTEMS CURRENT AND FUTURE END USER ANALYSIS, 2025–2034, (USD MILLION)
FIGURE 49 COLUMBIA OFF-GRID RENEWABLE ENERGY SYSTEMS CURRENT AND FUTURE TYPE ANALYSIS, 2025–2034, (USD MILLION)
FIGURE 50 COLUMBIA OFF-GRID RENEWABLE ENERGY SYSTEMS CURRENT AND FUTURE END USER ANALYSIS, 2025–2034, (USD MILLION)
FIGURE 51 REST OF LATIN AMERICA OFF-GRID RENEWABLE ENERGY SYSTEMS CURRENT AND FUTURE TYPE ANALYSIS, 2025–2034, (USD MILLION)
FIGURE 52 REST OF LATIN AMERICA OFF-GRID RENEWABLE ENERGY SYSTEMS CURRENT AND FUTURE END USER ANALYSIS, 2025–2034, (USD MILLION)
FIGURE 53 EASTERN EUROPE OFF-GRID RENEWABLE ENERGY SYSTEMS CURRENT AND FUTURE MARKET VOLUME SHARE REGIONAL ANALYSIS, 2025–2034, (USD MILLION)
FIGURE 54 POLAND OFF-GRID RENEWABLE ENERGY SYSTEMS CURRENT AND FUTURE TYPE ANALYSIS, 2025–2034, (USD MILLION)
FIGURE 55 POLAND OFF-GRID RENEWABLE ENERGY SYSTEMS CURRENT AND FUTURE END USER ANALYSIS, 2025–2034, (USD MILLION)
FIGURE 56 RUSSIA OFF-GRID RENEWABLE ENERGY SYSTEMS CURRENT AND FUTURE TYPE ANALYSIS, 2025–2034, (USD MILLION)
FIGURE 57 RUSSIA OFF-GRID RENEWABLE ENERGY SYSTEMS CURRENT AND FUTURE END USER ANALYSIS, 2025–2034, (USD MILLION)
FIGURE 58 CZECH REPUBLIC OFF-GRID RENEWABLE ENERGY SYSTEMS CURRENT AND FUTURE TYPE ANALYSIS, 2025–2034, (USD MILLION)
FIGURE 59 CZECH REPUBLIC OFF-GRID RENEWABLE ENERGY SYSTEMS CURRENT AND FUTURE END USER ANALYSIS, 2025–2034, (USD MILLION)
FIGURE 60 ROMANIA OFF-GRID RENEWABLE ENERGY SYSTEMS CURRENT AND FUTURE TYPE ANALYSIS, 2025–2034, (USD MILLION)
FIGURE 61 ROMANIA OFF-GRID RENEWABLE ENERGY SYSTEMS CURRENT AND FUTURE END USER ANALYSIS, 2025–2034, (USD MILLION)
FIGURE 62 REST OF EASTERN EUROPE OFF-GRID RENEWABLE ENERGY SYSTEMS CURRENT AND FUTURE TYPE ANALYSIS, 2025–2034, (USD MILLION)
FIGURE 63 REST OF EASTERN EUROPE OFF-GRID RENEWABLE ENERGY SYSTEMS CURRENT AND FUTURE END USER ANALYSIS, 2025–2034, (USD MILLION)
FIGURE 64 WESTERN EUROPE OFF-GRID RENEWABLE ENERGY SYSTEMS CURRENT AND FUTURE MARKET VOLUME SHARE REGIONAL ANALYSIS, 2025–2034, (USD MILLION)
FIGURE 65 GERMANY OFF-GRID RENEWABLE ENERGY SYSTEMS CURRENT AND FUTURE TYPE ANALYSIS, 2025–2034, (USD MILLION)
FIGURE 66 GERMANY OFF-GRID RENEWABLE ENERGY SYSTEMS CURRENT AND FUTURE END USER ANALYSIS, 2025–2034, (USD MILLION)
FIGURE 67 FRANCE OFF-GRID RENEWABLE ENERGY SYSTEMS CURRENT AND FUTURE TYPE ANALYSIS, 2025–2034, (USD MILLION)
FIGURE 68 FRANCE OFF-GRID RENEWABLE ENERGY SYSTEMS CURRENT AND FUTURE END USER ANALYSIS, 2025–2034, (USD MILLION)
FIGURE 69 UK OFF-GRID RENEWABLE ENERGY SYSTEMS CURRENT AND FUTURE TYPE ANALYSIS, 2025–2034, (USD MILLION)
FIGURE 70 UK OFF-GRID RENEWABLE ENERGY SYSTEMS CURRENT AND FUTURE END USER ANALYSIS, 2025–2034, (USD MILLION)
FIGURE 71 SPAIN OFF-GRID RENEWABLE ENERGY SYSTEMS CURRENT AND FUTURE TYPE ANALYSIS, 2025–2034, (USD MILLION)
FIGURE 72 SPAIN OFF-GRID RENEWABLE ENERGY SYSTEMS CURRENT AND FUTURE END USER ANALYSIS, 2025–2034, (USD MILLION)
FIGURE 73 ITALY OFF-GRID RENEWABLE ENERGY SYSTEMS CURRENT AND FUTURE TYPE ANALYSIS, 2025–2034, (USD MILLION)
FIGURE 74 ITALY OFF-GRID RENEWABLE ENERGY SYSTEMS CURRENT AND FUTURE END USER ANALYSIS, 2025–2034, (USD MILLION)
FIGURE 75 REST OF WESTERN EUROPE OFF-GRID RENEWABLE ENERGY SYSTEMS CURRENT AND FUTURE TYPE ANALYSIS, 2025–2034, (USD MILLION)
FIGURE 76 REST OF WESTERN EUROPE OFF-GRID RENEWABLE ENERGY SYSTEMS CURRENT AND FUTURE END USER ANALYSIS, 2025–2034, (USD MILLION)
FIGURE 77 EAST ASIA AND PACIFIC OFF-GRID RENEWABLE ENERGY SYSTEMS CURRENT AND FUTURE MARKET VOLUME SHARE REGIONAL ANALYSIS, 2025–2034, (USD MILLION)
FIGURE 78 CHINA OFF-GRID RENEWABLE ENERGY SYSTEMS CURRENT AND FUTURE TYPE ANALYSIS, 2025–2034, (USD MILLION)
FIGURE 79 CHINA OFF-GRID RENEWABLE ENERGY SYSTEMS CURRENT AND FUTURE END USER ANALYSIS, 2025–2034, (USD MILLION)
FIGURE 80 JAPAN OFF-GRID RENEWABLE ENERGY SYSTEMS CURRENT AND FUTURE TYPE ANALYSIS, 2025–2034, (USD MILLION)
FIGURE 81 JAPAN OFF-GRID RENEWABLE ENERGY SYSTEMS CURRENT AND FUTURE END USER ANALYSIS, 2025–2034, (USD MILLION)
FIGURE 82 AUSTRALIA OFF-GRID RENEWABLE ENERGY SYSTEMS CURRENT AND FUTURE TYPE ANALYSIS, 2025–2034, (USD MILLION)
FIGURE 83 AUSTRALIA OFF-GRID RENEWABLE ENERGY SYSTEMS CURRENT AND FUTURE END USER ANALYSIS, 2025–2034, (USD MILLION)
FIGURE 84 CAMBODIA OFF-GRID RENEWABLE ENERGY SYSTEMS CURRENT AND FUTURE TYPE ANALYSIS, 2025–2034, (USD MILLION)
FIGURE 85 CAMBODIA OFF-GRID RENEWABLE ENERGY SYSTEMS CURRENT AND FUTURE END USER ANALYSIS, 2025–2034, (USD MILLION)
FIGURE 86 FIJI OFF-GRID RENEWABLE ENERGY SYSTEMS CURRENT AND FUTURE TYPE ANALYSIS, 2025–2034, (USD MILLION)
FIGURE 87 FIJI OFF-GRID RENEWABLE ENERGY SYSTEMS CURRENT AND FUTURE END USER ANALYSIS, 2025–2034, (USD MILLION)
FIGURE 88 INDONESIA OFF-GRID RENEWABLE ENERGY SYSTEMS CURRENT AND FUTURE TYPE ANALYSIS, 2025–2034, (USD MILLION)
FIGURE 89 INDONESIA OFF-GRID RENEWABLE ENERGY SYSTEMS CURRENT AND FUTURE END USER ANALYSIS, 2025–2034, (USD MILLION)
FIGURE 90 SOUTH KOREA OFF-GRID RENEWABLE ENERGY SYSTEMS CURRENT AND FUTURE TYPE ANALYSIS, 2025–2034, (USD MILLION)
FIGURE 91 SOUTH KOREA OFF-GRID RENEWABLE ENERGY SYSTEMS CURRENT AND FUTURE END USER ANALYSIS, 2025–2034, (USD MILLION)
FIGURE 92 REST OF EAST ASIA AND PACIFIC OFF-GRID RENEWABLE ENERGY SYSTEMS CURRENT AND FUTURE TYPE ANALYSIS, 2025–2034, (USD MILLION)
FIGURE 93 REST OF EAST ASIA AND PACIFIC OFF-GRID RENEWABLE ENERGY SYSTEMS CURRENT AND FUTURE END USER ANALYSIS, 2025–2034, (USD MILLION)
FIGURE 94 SEA AND SOUTH ASIA OFF-GRID RENEWABLE ENERGY SYSTEMS CURRENT AND FUTURE MARKET VOLUME SHARE REGIONAL ANALYSIS, 2025–2034, (USD MILLION)
FIGURE 95 BANGLADESH OFF-GRID RENEWABLE ENERGY SYSTEMS CURRENT AND FUTURE TYPE ANALYSIS, 2025–2034, (USD MILLION)
FIGURE 96 BANGLADESH OFF-GRID RENEWABLE ENERGY SYSTEMS CURRENT AND FUTURE END USER ANALYSIS, 2025–2034, (USD MILLION)
FIGURE 97 NEW ZEALAND OFF-GRID RENEWABLE ENERGY SYSTEMS CURRENT AND FUTURE TYPE ANALYSIS, 2025–2034, (USD MILLION)
FIGURE 98 NEW ZEALAND OFF-GRID RENEWABLE ENERGY SYSTEMS CURRENT AND FUTURE END USER ANALYSIS, 2025–2034, (USD MILLION)
FIGURE 99 INDIA OFF-GRID RENEWABLE ENERGY SYSTEMS CURRENT AND FUTURE TYPE ANALYSIS, 2025–2034, (USD MILLION)
FIGURE 100 INDIA OFF-GRID RENEWABLE ENERGY SYSTEMS CURRENT AND FUTURE END USER ANALYSIS, 2025–2034, (USD MILLION)
FIGURE 101 SINGAPORE OFF-GRID RENEWABLE ENERGY SYSTEMS CURRENT AND FUTURE TYPE ANALYSIS, 2025–2034, (USD MILLION)
FIGURE 102 SINGAPORE OFF-GRID RENEWABLE ENERGY SYSTEMS CURRENT AND FUTURE END USER ANALYSIS, 2025–2034, (USD MILLION)
FIGURE 103 THAILAND OFF-GRID RENEWABLE ENERGY SYSTEMS CURRENT AND FUTURE TYPE ANALYSIS, 2025–2034, (USD MILLION)
FIGURE 104 THAILAND OFF-GRID RENEWABLE ENERGY SYSTEMS CURRENT AND FUTURE END USER ANALYSIS, 2025–2034, (USD MILLION)
FIGURE 105 TAIWAN OFF-GRID RENEWABLE ENERGY SYSTEMS CURRENT AND FUTURE TYPE ANALYSIS, 2025–2034, (USD MILLION)
FIGURE 106 TAIWAN OFF-GRID RENEWABLE ENERGY SYSTEMS CURRENT AND FUTURE END USER ANALYSIS, 2025–2034, (USD MILLION)
FIGURE 107 MALAYSIA OFF-GRID RENEWABLE ENERGY SYSTEMS CURRENT AND FUTURE TYPE ANALYSIS, 2025–2034, (USD MILLION)
FIGURE 108 MALAYSIA OFF-GRID RENEWABLE ENERGY SYSTEMS CURRENT AND FUTURE END USER ANALYSIS, 2025–2034, (USD MILLION)
FIGURE 109 REST OF SEA AND SOUTH ASIA OFF-GRID RENEWABLE ENERGY SYSTEMS CURRENT AND FUTURE TYPE ANALYSIS, 2025–2034, (USD MILLION)
FIGURE 110 REST OF SEA AND SOUTH ASIA OFF-GRID RENEWABLE ENERGY SYSTEMS CURRENT AND FUTURE END USER ANALYSIS, 2025–2034, (USD MILLION)
FIGURE 111 MIDDLE EAST AND AFRICA OFF-GRID RENEWABLE ENERGY SYSTEMS CURRENT AND FUTURE MARKET VOLUME SHARE REGIONAL ANALYSIS, 2025–2034, (USD MILLION)
FIGURE 112 GCC COUNTRIES OFF-GRID RENEWABLE ENERGY SYSTEMS CURRENT AND FUTURE TYPE ANALYSIS, 2025–2034, (USD MILLION)
FIGURE 113 GCC COUNTRIES OFF-GRID RENEWABLE ENERGY SYSTEMS CURRENT AND FUTURE END USER ANALYSIS, 2025–2034, (USD MILLION)
FIGURE 114 SAUDI ARABIA OFF-GRID RENEWABLE ENERGY SYSTEMS CURRENT AND FUTURE TYPE ANALYSIS, 2025–2034, (USD MILLION)
FIGURE 115 SAUDI ARABIA OFF-GRID RENEWABLE ENERGY SYSTEMS CURRENT AND FUTURE END USER ANALYSIS, 2025–2034, (USD MILLION)
FIGURE 116 UAE OFF-GRID RENEWABLE ENERGY SYSTEMS CURRENT AND FUTURE TYPE ANALYSIS, 2025–2034, (USD MILLION)
FIGURE 117 UAE OFF-GRID RENEWABLE ENERGY SYSTEMS CURRENT AND FUTURE END USER ANALYSIS, 2025–2034, (USD MILLION)
FIGURE 118 BAHRAIN OFF-GRID RENEWABLE ENERGY SYSTEMS CURRENT AND FUTURE TYPE ANALYSIS, 2025–2034, (USD MILLION)
FIGURE 119 BAHRAIN OFF-GRID RENEWABLE ENERGY SYSTEMS CURRENT AND FUTURE END USER ANALYSIS, 2025–2034, (USD MILLION)
FIGURE 120 KUWAIT OFF-GRID RENEWABLE ENERGY SYSTEMS CURRENT AND FUTURE TYPE ANALYSIS, 2025–2034, (USD MILLION)
FIGURE 121 KUWAIT OFF-GRID RENEWABLE ENERGY SYSTEMS CURRENT AND FUTURE END USER ANALYSIS, 2025–2034, (USD MILLION)
FIGURE 122 OMAN OFF-GRID RENEWABLE ENERGY SYSTEMS CURRENT AND FUTURE TYPE ANALYSIS, 2025–2034, (USD MILLION)
FIGURE 123 OMAN OFF-GRID RENEWABLE ENERGY SYSTEMS CURRENT AND FUTURE END USER ANALYSIS, 2025–2034, (USD MILLION)
FIGURE 124 QATAR OFF-GRID RENEWABLE ENERGY SYSTEMS CURRENT AND FUTURE TYPE ANALYSIS, 2025–2034, (USD MILLION)
FIGURE 125 QATAR OFF-GRID RENEWABLE ENERGY SYSTEMS CURRENT AND FUTURE END USER ANALYSIS, 2025–2034, (USD MILLION)
FIGURE 126 EGYPT OFF-GRID RENEWABLE ENERGY SYSTEMS CURRENT AND FUTURE TYPE ANALYSIS, 2025–2034, (USD MILLION)
FIGURE 127 EGYPT OFF-GRID RENEWABLE ENERGY SYSTEMS CURRENT AND FUTURE END USER ANALYSIS, 2025–2034, (USD MILLION)
FIGURE 128 NIGERIA OFF-GRID RENEWABLE ENERGY SYSTEMS CURRENT AND FUTURE TYPE ANALYSIS, 2025–2034, (USD MILLION)
FIGURE 129 NIGERIA OFF-GRID RENEWABLE ENERGY SYSTEMS CURRENT AND FUTURE END USER ANALYSIS, 2025–2034, (USD MILLION)
FIGURE 130 SOUTH AFRICA OFF-GRID RENEWABLE ENERGY SYSTEMS CURRENT AND FUTURE TYPE ANALYSIS, 2025–2034, (USD MILLION)
FIGURE 131 SOUTH AFRICA OFF-GRID RENEWABLE ENERGY SYSTEMS CURRENT AND FUTURE END USER ANALYSIS, 2025–2034, (USD MILLION)
FIGURE 132 ISRAEL OFF-GRID RENEWABLE ENERGY SYSTEMS CURRENT AND FUTURE TYPE ANALYSIS, 2025–2034, (USD MILLION)
FIGURE 133 ISRAEL OFF-GRID RENEWABLE ENERGY SYSTEMS CURRENT AND FUTURE END USER ANALYSIS, 2025–2034, (USD MILLION)
FIGURE 134 REST OF MEA OFF-GRID RENEWABLE ENERGY SYSTEMS CURRENT AND FUTURE TYPE ANALYSIS, 2025–2034, (USD MILLION)
FIGURE 135 REST OF MEA OFF-GRID RENEWABLE ENERGY SYSTEMS CURRENT AND FUTURE END USER ANALYSIS, 2025–2034, (USD MILLION)
FIGURE 136 U. S. MARKET SHARE ANALYSIS BY TYPE (2024)
FIGURE 137 U. S. MARKET SHARE ANALYSIS BY END USER (2024)
FIGURE 138 CANADA MARKET SHARE ANALYSIS BY TYPE (2024)
FIGURE 139 CANADA MARKET SHARE ANALYSIS BY END USER (2024)
FIGURE 140 MEXICO MARKET SHARE ANALYSIS BY TYPE (2024)
FIGURE 141 MEXICO MARKET SHARE ANALYSIS BY END USER (2024)
FIGURE 142 CHINA MARKET SHARE ANALYSIS BY TYPE (2024)
FIGURE 143 CHINA MARKET SHARE ANALYSIS BY END USER (2024)
FIGURE 144 JAPAN MARKET SHARE ANALYSIS BY TYPE (2024)
FIGURE 145 JAPAN MARKET SHARE ANALYSIS BY END USER (2024)
FIGURE 146 INDIA MARKET SHARE ANALYSIS BY TYPE (2024)
FIGURE 147 INDIA MARKET SHARE ANALYSIS BY END USER (2024)
FIGURE 148 SOUTH KOREA MARKET SHARE ANALYSIS BY TYPE (2024)
FIGURE 149 SOUTH KOREA MARKET SHARE ANALYSIS BY END USER (2024)
FIGURE 150 SAUDI ARABIA MARKET SHARE ANALYSIS BY TYPE (2024)
FIGURE 151 SAUDI ARABIA MARKET SHARE ANALYSIS BY END USER (2024)
FIGURE 152 UAE MARKET SHARE ANALYSIS BY TYPE (2024)
FIGURE 153 UAE MARKET SHARE ANALYSIS BY END USER (2024)
FIGURE 154 EGYPT MARKET SHARE ANALYSIS BY TYPE (2024)
FIGURE 155 EGYPT MARKET SHARE ANALYSIS BY END USER (2024)
FIGURE 156 NIGERIA MARKET SHARE ANALYSIS BY TYPE (2024)
FIGURE 157 NIGERIA MARKET SHARE ANALYSIS BY END USER (2024)
FIGURE 158 SOUTH AFRICA MARKET SHARE ANALYSIS BY TYPE (2024)
FIGURE 159 SOUTH AFRICA MARKET SHARE ANALYSIS BY END USER (2024)
FIGURE 160 GERMANY MARKET SHARE ANALYSIS BY TYPE (2024)
FIGURE 161 GERMANY MARKET SHARE ANALYSIS BY END USER (2024)
FIGURE 162 FRANCE MARKET SHARE ANALYSIS BY TYPE (2024)
FIGURE 163 FRANCE MARKET SHARE ANALYSIS BY END USER (2024)
FIGURE 164 UK MARKET SHARE ANALYSIS BY TYPE (2024)
FIGURE 165 UK MARKET SHARE ANALYSIS BY END USER (2024)
FIGURE 166 SPAIN MARKET SHARE ANALYSIS BY TYPE (2024)
FIGURE 167 SPAIN MARKET SHARE ANALYSIS BY END USER (2024)
FIGURE 168 ITALY MARKET SHARE ANALYSIS BY TYPE (2024)
FIGURE 169 ITALY MARKET SHARE ANALYSIS BY END USER (2024)
FIGURE 170 BRAZIL MARKET SHARE ANALYSIS BY TYPE (2024)
FIGURE 171 BRAZIL MARKET SHARE ANALYSIS BY END USER (2024)
FIGURE 172 ARGENTINA MARKET SHARE ANALYSIS BY TYPE (2024)
FIGURE 173 ARGENTINA MARKET SHARE ANALYSIS BY END USER (2024)
FIGURE 174 COLUMBIA MARKET SHARE ANALYSIS BY TYPE (2024)
FIGURE 175 COLUMBIA MARKET SHARE ANALYSIS BY END USER (2024)
FIGURE 176 GLOBAL OFF-GRID RENEWABLE ENERGY SYSTEMS CURRENT AND FUTURE MARKET KEY COUNTRY LEVEL ANALYSIS, 2024–2034, (USD MILLION)
FIGURE 177 FINANCIAL OVERVIEW:
Key Players Analysis:
Tesla, Inc.: Tesla is renowned for its innovative energy storage solutions, including the Powerwall, which enables residential energy independence. Based in Palo Alto, California, Tesla focuses on electric vehicles and renewable energy products. The company's strategy revolves around vertical integration, allowing it to control the entire supply chain, from manufacturing to installation.
Sunnova Energy International Inc.: Sunnova provides residential solar and energy storage services across the U.S., Puerto Rico, and Canada. They offer flexible financing options, including solar leases and power purchase agreements (PPAs). Their strategy emphasizes customer-centric services and partnerships with local installers to enhance market penetration and provide accessible renewable energy solutions.
Siemens AG: Headquartered in Munich, Germany, Siemens AG offers a wide range of renewable energy technologies, including off-grid solar and wind solutions. The company focuses on integrated solutions, combining hardware and software to optimize energy efficiency. Their strategy includes investing in digital technologies and sustainable infrastructure projects globally to promote energy transition.
Schneider Electric SE: Schneider Electric, based in Rueil-Malmaison, France, specializes in energy management and automation solutions, including off-grid energy systems. Their EcoStruxure platform integrates IoT technologies for better energy efficiency. Schneider's strategy centers on sustainability and innovation, driving the adoption of renewable energy solutions in various sectors worldwide.
Off-Grid Electric: Off-Grid Electric operates primarily in Africa, providing solar energy solutions to underserved regions. Their products include solar home systems that offer affordable electricity. The company employs a pay-as-you-go financing model, which enhances affordability and accessibility, aiming to expand its reach in emerging markets across Africa.
SunPower Corporation: SunPower, headquartered in San Jose, California, is a leading solar technology and energy services provider. The company offers residential and commercial solar systems and energy storage solutions. SunPower's strategy focuses on high-efficiency solar products and strong customer service, positioning itself as a premium provider in the renewable energy market.
LG Electronics Inc.: Based in Seoul, South Korea, LG Electronics offers solar panels and energy storage solutions designed for residential and commercial applications. Their strategy emphasizes innovation and quality, investing heavily in R&D to develop high-performance solar technologies. LG aims to expand its market presence through strategic partnerships and collaborations in the renewable energy sector.
First Solar, Inc.: First Solar, headquartered in Tempe, Arizona, specializes in solar photovoltaic (PV) technology and provides utility-scale solar power solutions. The company is known for its advanced thin-film solar panels, which offer higher efficiency in specific environments. Their strategy focuses on sustainability and responsible sourcing, emphasizing a strong commitment to environmental stewardship.
Vivint Solar: Vivint Solar, based in Lehi, Utah, provides residential solar energy solutions across the U.S. Their services include solar panel installation, financing options, and energy management. Vivint's strategy is centered on customer education and personalized service, enabling homeowners to transition to renewable energy with minimal hassle.
Canadian Solar Inc.: Canadian Solar, with headquarters in Guelph, Ontario, is one of the world's largest solar manufacturers, offering solar PV modules and energy storage solutions. Their strategy focuses on cost-effective products and extensive research and development to enhance technology. Canadian Solar aims to expand its global footprint by increasing production capacity and entering new markets.
Market Key Players
Tesla, Inc.
Sunnova Energy International Inc.
Siemens AG
Schneider Electric SE
Off-Grid Electric
SunPower Corporation
LG Electronics Inc.
First Solar, Inc.
Vivint Solar
Canadian Solar Inc.
Enphase Energy, Inc.
Baker Hughes Company
Trina Solar Limited
JinkoSolar Holding Co., Ltd.
ReneSola Ltd.
Akon Lighting Africa
d.light design, Inc.
Azuri Technologies Ltd.
Genasun
Greenlight Planet, Inc.
Driver:
Increasing Demand for Energy Access
The demand for reliable energy access in underserved regions is a primary driver of the off-grid renewable energy systems market. As populations in rural and remote areas grow, so does the need for electricity to support basic needs such as lighting, heating, and cooking. Many developing countries experience frequent power outages or lack grid infrastructure altogether, creating an urgent need for sustainable energy solutions. Off-grid systems, particularly solar and wind technologies, provide an effective solution, offering clean, reliable power without the complexities of connecting to a national grid. This trend is further supported by international organizations and governments aiming to improve energy access as part of their sustainable development goals, leading to increased investments in off-grid renewable energy projects.
Technological Advancements
Technological advancements in renewable energy technologies significantly contribute to market growth. Innovations in solar panel efficiency, battery storage systems, and wind turbine designs have improved the performance and affordability of off-grid systems. The decreasing cost of solar photovoltaics, in particular, has made it more accessible for both consumers and businesses, driving adoption rates. Energy storage technologies, such as lithium-ion batteries, are evolving, allowing users to store excess energy generated during peak sunlight or wind hours for use during low production times. These advancements enhance the reliability and efficiency of off-grid renewable systems, making them increasingly attractive to consumers and businesses looking to reduce energy costs while contributing to a more sustainable energy future.
Government Initiatives and Policies
Government initiatives and supportive policies play a crucial role in promoting the adoption of off-grid renewable energy systems. Many countries have recognized the importance of renewable energy in achieving energy security and sustainability goals, leading to the implementation of favorable policies and incentives. For instance, subsidies, tax breaks, and grants for renewable energy projects help reduce the financial burden on consumers and businesses. Additionally, programs aimed at increasing energy access in rural and underserved communities further encourage the deployment of off-grid solutions. As governments continue to prioritize renewable energy in their national strategies, the market for off-grid systems is expected to expand significantly, facilitating growth and investment opportunities.
Restraints:
High Initial Capital Costs
One of the primary restraints affecting the off-grid renewable energy systems market is the high initial capital cost associated with purchasing and installing renewable energy technologies. While prices for solar panels and wind turbines have decreased, the overall upfront investment required for a complete off-grid system can still be significant, particularly for low-income households and small businesses. This financial barrier may limit access to renewable energy solutions, especially in developing regions where economic conditions are challenging. Although various financing models, such as pay-as-you-go systems, have emerged to alleviate this issue, the perception of high costs still poses a hurdle for widespread adoption, potentially hindering market growth.
Limited Awareness and Technical Expertise
Limited awareness and technical expertise in installing and maintaining off-grid renewable energy systems can restrict market growth. Many potential users, particularly in rural areas, may lack the knowledge required to select appropriate technologies or understand the benefits of renewable energy solutions. This gap in understanding can lead to hesitancy in adopting off-grid systems, as consumers may be unfamiliar with financing options, installation processes, and maintenance requirements. Furthermore, the shortage of trained professionals capable of providing installation and maintenance services can complicate the deployment of renewable energy systems, particularly in regions with limited technical infrastructure. As a result, addressing these knowledge gaps is essential to facilitate market penetration and encourage broader adoption of off-grid renewable energy technologies.
Opportunities:
Expanding Electrification Initiatives
The global push for electrification presents a significant opportunity for the off-grid renewable energy systems market. As many countries strive to achieve universal energy access, there is a growing focus on providing electricity to remote and underserved communities. Off-grid solutions, especially solar and wind technologies, are ideal for these areas, where extending traditional grid infrastructure may be impractical or cost-prohibitive. Innovative business models, such as pay-as-you-go financing and community-based energy projects, are gaining traction, enabling households and businesses to invest in renewable energy systems. Additionally, partnerships between governments, NGOs, and private sector players can facilitate investments in off-grid solutions, creating a conducive environment for market growth and improving energy access in rural areas.
Integration of Smart Technologies
The integration of smart technologies into off-grid renewable energy systems represents a substantial opportunity for market expansion. The rise of the Internet of Things (IoT) and advancements in energy management systems enable more efficient monitoring and control of energy production and consumption. Smart meters, for example, can provide users with real-time data on their energy usage, allowing them to optimize their consumption patterns and enhance energy efficiency. Moreover, integrating renewable energy systems with smart grids can facilitate better management of energy resources, enabling smoother integration into existing energy networks. This trend towards smart energy solutions aligns with the growing demand for sustainability and energy efficiency, positioning the off-grid renewable energy market for significant growth.
Trend:
Growing Adoption of Hybrid Renewable Energy Systems
A notable trend in the off-grid renewable energy systems market is the increasing adoption of hybrid renewable energy systems. These systems combine various energy sources, such as solar, wind, and biomass, to provide a more reliable and efficient power supply. By integrating multiple technologies, hybrid systems can enhance energy generation, particularly in regions where one energy source may be inconsistent. For example, solar power can be complemented by wind energy during periods of low sunlight, ensuring a continuous energy supply. This trend reflects a shift towards more resilient and flexible energy solutions, catering to diverse energy needs across applications. As technology continues to evolve and costs decline, the hybrid approach is expected to gain popularity, driving innovation and investment in off-grid renewable energy systems.
Recent Development:
In August 2024: 5B, an Australian solar innovator, is experiencing a significant boom in off-grid renewable energy projects, particularly in the mining sector. The company has signed a deal with Indian solar panel manufacturer Waree to build and assemble prefabricated solar modules, winning a 69 MW contract in Puerto Rico. This partnership comes as solar module prices have fallen sharply, driving increased demand for off-grid solutions.
In September 2024: NEXTracker has launched a new energy storage system, called the NX Fusion, designed to streamline the integration of solar energy with storage solutions. This system aims to enhance the efficiency of solar plants and address increasing energy demands. The NX Fusion integrates NEXTracker's advanced solar tracking technology with optimized battery management systems, making it easier for developers to implement hybrid energy solutions.
Frequently Asked Questions
How big is the Off-Grid Renewable Energy Systems Market?
The Off-Grid Renewable Energy Systems Market is projected to reach USD 31.12 Bn by 2034 at 9.1% CAGR, driven by solar, wind, hybrid solutions, and rural electrification.
Who are the major players in the Off-Grid Renewable Energy Systems Market?
Tesla Inc., Sunnova Energy International Inc., Siemens AG, Schneider Electric SE, Off-Grid Electric, SunPower Corporation, LG Electronics Inc., First Solar Inc., Vivint Solar, Canadian Solar Inc., Enphase Energy Inc., Baker Hughes Company, Trina Solar Limited, JinkoSolar Holding Co. Ltd., ReneSola Ltd., Akon Lighting Africa, d.light design Inc., Azuri Technologies Ltd., Genasun, Greenlight Planet Inc.
Which segments covered the Off-Grid Renewable Energy Systems Market?
By Energy Source (Solar, Wind, Hydro, Hybrid Systems, Biomass), By Component (Photovoltaic Panels & Modules, Wind Turbines, Batteries & Energy Storage, Inverters & Controllers, Microgrid Systems), By Technology (Solar Energy Systems, Wind Energy Systems, Energy Storage Systems, Biomass Energy Systems, Hydro Energy Systems), By End-User (Households, Small & Medium Enterprises, Non-Governmental Organizations (NGOs), Government & Public Sector), By Application (Residential Off-Grid Solutions, Commercial & Industrial Off-Grid Solutions, Community & Rural Electrification Projects, Emergency & Disaster Relief Applications
How can this market research report help my business make strategic decisions?
Our market research reports provide actionable intelligence, including verified market size data, CAGR projections, competitive benchmarking, and segment-level opportunity analysis. These insights support strategic planning, investment decisions, product development, and market entry strategies for enterprises and startups alike.
How frequently is the data updated?
We continuously monitor industry developments and update our reports to reflect regulatory changes, technological advancements, and macroeconomic shifts. Updated editions ensure you receive the latest market intelligence.

 Aerospace And Defence
 Agriculture
 Automotive And Transportation
 Banking And Finance
 Business
 Chemicals And Materials
 Consumer And Retail
 Electronics And Semiconductors
 Food And Beverages
 Machinery & Equipments
 Manufacturing And Construction
 Medical Devices
 Others
 Pharmaceuticals And Healthcare
 Power And Energy
 Sports
 Technology

, Application (Residential, Commercial, Industrial, Community), Region and Key Players - Industry Segment Overview, Market Dynamics, Competitive Strategies, Trends and Forecast 2025-2034")
, Application (Residential, Commercial, Industrial, Community), Region and Key Players - Industry Segment Overview, Market Dynamics, Competitive Strategies, Trends and Forecast 2025-2034")
, Application (Residential, Commercial, Industrial, Community), Region and Key Players - Industry Segment Overview, Market Dynamics, Competitive Strategies, Trends and Forecast 2025-2034")
, Application (Residential, Commercial, Industrial, Community), Region and Key Players - Industry Segment Overview, Market Dynamics, Competitive Strategies, Trends and Forecast 2025-2034")

