Onion Salt Market Size, Share & Growth Forecast 2025–2034
Global Onion Salt Market Size, Share & Industry Analysis by Type (Organic, Conventional), by Packaging (Jars, Bottles, Bulk Packaging, Pouches, Others), by Distribution Channel (Direct Sales/B2B, Indirect Sales/B2C, Supermarkets & Hypermarkets, Convenience Stores, Specialty Stores, Online Retail), by End User (Household, HoReCa, Food Processing), Regional Outlook & Key Players – Market Dynamics, Supply Chain Analysis, Competitive Landscape, Emerging Trends and Forecast, 2025–2034
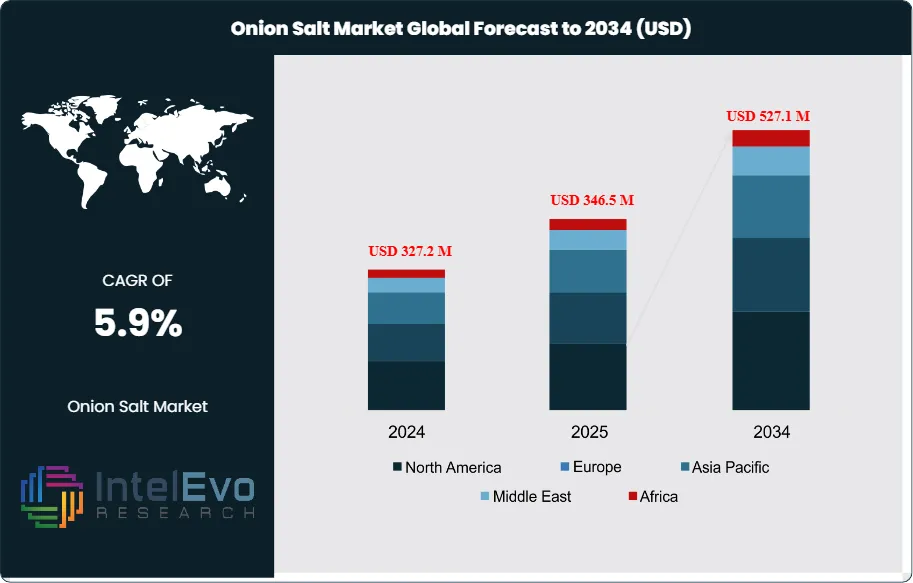
The Onion Salt Market is estimated at USD 327.2 million in 2024 and is on track to reach roughly USD 527.1 million by 2034, implying a compound annual growth rate of 5.9% over 2025–2034. This steady expansion reflects the rising demand for convenient, ready-to-use seasonings that align with evolving consumer food habits and the growing packaged food sector worldwide. Onion salt, a blend of dried onion and table salt, has become a staple in both household and commercial kitchens. Its ability to deliver consistent flavor without preparation has positioned it as a preferred ingredient across meats, snacks, soups, sauces, and ready-to-eat meals. Historically, demand was concentrated in developed markets, but recent years have seen strong uptake in emerging economies where urbanization and rising disposable incomes are reshaping dietary patterns. The market has grown from a niche seasoning category into a mainstream flavor enhancer, supported by the global shift toward convenience-driven consumption.
Several demand-side factors are driving growth. Consumers are increasingly seeking natural flavoring agents that reduce reliance on artificial additives. Onion salt meets this need by offering a versatile, plant-based seasoning that enhances taste without complexity. The surge in home cooking during and after the COVID-19 pandemic further accelerated adoption, with online recipe sharing and digital food communities reinforcing its popularity. On the supply side, manufacturers are expanding product formats, including powdered, granulated, and coarse blends, to serve retail, foodservice, and industrial channels. However, risks such as fluctuating raw material prices, supply chain disruptions, and regulatory scrutiny on sodium content remain key challenges for producers.
Technology is also shaping the market. Advances in food processing and packaging are extending shelf life and improving product consistency. Automation in blending and distribution is enabling producers to scale efficiently, while digital retail platforms are expanding consumer access to branded and private-label offerings.
Regionally, North America accounted for 44.6% of global sales in 2024, supported by strong demand from retail and foodservice sectors. Europe follows closely, driven by established packaged food industries and consumer preference for seasoning blends. Asia-Pacific is emerging as the fastest-growing region, with rising urban populations and expanding modern retail infrastructure creating new opportunities. For investors, growth hotspots lie in Asia-Pacific and Latin America, where rising middle-class consumption and foodservice expansion are expected to sustain long-term demand.
Key Takeaways
Market Growth: The global onion salt market was valued at USD 327.2 million in 2024 and is projected to reach USD 527.1 million by 2034, expanding at a CAGR of 5.9% from 2025 to 2034. Growth is supported by rising demand for convenient seasonings and the expansion of packaged food consumption worldwide.
Product Type: Conventional onion salt accounted for 73.4% of total sales in 2024, reflecting its cost advantage and wide availability compared with organic variants.
Packaging: Bulk packaging captured 33.6% of global share in 2024, driven by strong uptake in foodservice and industrial applications where large-volume procurement reduces unit costs.
Distribution Channel: Indirect sales through B2C channels represented 67.3% of global distribution in 2024, highlighting the importance of supermarkets, hypermarkets, and online retail in reaching household consumers.
End Use: Household consumption contributed 43.3% of market revenue in 2024, supported by the rise of home cooking and recipe sharing platforms that encourage seasoning use.
Driver: Increasing consumer preference for natural flavor enhancers in processed and ready-to-eat foods is a key growth driver. Onion salt provides a clean-label alternative to artificial additives, aligning with global demand for transparent ingredient lists.
Restraint: High sodium content remains a regulatory and health concern. Stricter labeling requirements and consumer awareness of salt intake could limit adoption, particularly in developed markets where sodium reduction initiatives are advancing.
Opportunity: Asia-Pacific presents the strongest growth potential, with rising urban populations and expanding modern retail channels expected to deliver double-digit gains in onion salt consumption over the forecast period.
Trend: Food manufacturers are diversifying product formats, including granulated and coarse blends, to cater to both retail and industrial buyers. Digital retail platforms are accelerating brand visibility and consumer access, reshaping competitive dynamics.
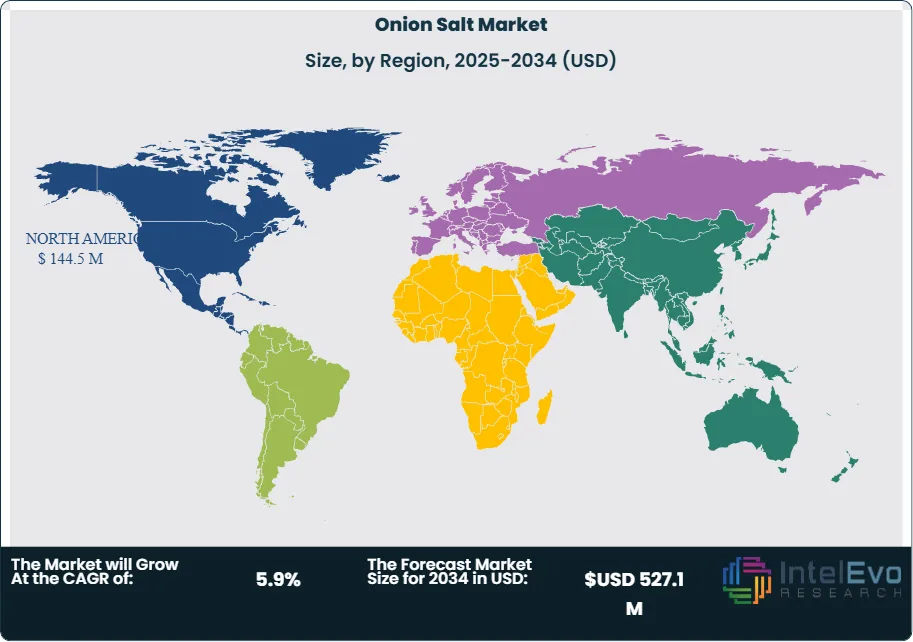
Regional Analysis: North America generated USD 144.5 million in 2024, accounting for 44.6% of global revenue, supported by strong retail and foodservice demand. Asia-Pacific is projected to record the fastest CAGR through 2034, driven by changing dietary habits and growing packaged food penetration.
Type Analysis
As of 2025, conventional onion salt continues to dominate the global market, accounting for more than 72% of total sales. Its strong position reflects widespread consumer familiarity, cost efficiency, and consistent availability across both retail and industrial supply chains. Conventional variants remain the preferred choice for households, restaurants, and large-scale food processors due to their stable flavor profile and extended shelf life.
The segment’s resilience is further supported by its integration into packaged foods, savory snacks, and instant meal categories, where manufacturers prioritize affordability and uniformity in taste. In price-sensitive regions, conventional onion salt maintains a clear advantage over organic alternatives, which often carry higher certification and production costs. Established sourcing channels and standardized production practices also ensure that conventional products can meet rising demand at competitive price points.
Looking ahead, the conventional category is expected to retain its leadership through 2034, supported by scale efficiencies and broad consumer acceptance. However, organic onion salt is projected to gain incremental traction, particularly in North America and Europe, where clean-label and natural ingredient claims are becoming more influential in purchasing decisions.
Packaging Analysis
Bulk packaging represented 33.6% of global onion salt sales in 2024 and remains the leading format in 2025. This dominance is driven by strong demand from foodservice operators, catering businesses, and industrial buyers who require large volumes for consistent use in high-capacity kitchens and automated production lines. Bulk formats deliver cost savings through reduced per-unit pricing and lower packaging waste, making them highly attractive for commercial applications.
The segment’s strength also lies in its compatibility with distribution networks that prioritize efficiency. Warehousing and redistribution centers prefer bulk packaging for streamlined handling, while snack manufacturers and spice blenders rely on it to maintain ingredient standardization. As global food processing expands, bulk packaging is expected to remain a critical enabler of scale and operational efficiency.
Although bulk formats dominate, smaller retail-oriented packaging such as jars, bottles, and pouches are gaining traction in B2C channels. These formats cater to households seeking convenience and portion control, while premium packaging designs are increasingly used to differentiate organic and specialty blends.
Distribution Channel Analysis
Indirect sales through B2C channels accounted for 67.3% of global onion salt distribution in 2024 and remain the primary route to market in 2025. Supermarkets, hypermarkets, and grocery stores continue to drive household purchases, supported by strong product visibility and consumer trust in established retail outlets. Online platforms are also expanding their role, particularly in urban markets where digital grocery adoption is accelerating.
The strength of indirect sales reflects consumer preference for convenient spice purchases during routine shopping trips. Retailers are reinforcing this trend by offering onion salt in multiple formats and price points, often supported by recipe-based marketing and promotional campaigns. E-commerce platforms further enhance accessibility, enabling manufacturers to reach new demographics and expand beyond traditional retail boundaries.
Direct sales, while smaller in share, remain important for B2B clients such as food processors and institutional buyers. This channel is expected to grow steadily as manufacturers strengthen partnerships with industrial clients seeking consistent, large-volume supply.
End-Use Analysis
Households accounted for 43.3% of onion salt consumption in 2024 and remain the largest end-use segment in 2025. The product’s convenience, versatility, and ability to enhance flavor without preparation have made it a pantry essential for urban consumers. Rising interest in home cooking, coupled with time-saving needs, continues to support household adoption across both developed and emerging markets.
The HoReCa (hotels, restaurants, and catering) sector represents another significant demand driver, with onion salt widely used in quick-service restaurants and institutional kitchens. Its role in standardizing flavor across large-scale meal preparation ensures consistent demand from this segment. Food processing companies also represent a growing end-user base, incorporating onion salt into packaged snacks, sauces, and ready-to-eat meals to meet consumer expectations for flavor consistency.
Over the forecast period, household consumption will remain the anchor of market demand, while foodservice and industrial applications are expected to expand at a faster pace, supported by rising global consumption of processed and convenience foods.
Regional Analysis
North America led the global onion salt market in 2024 with a 44.6% share, valued at USD 144.5 million, and continues to hold its leadership in 2025. Strong demand from households and foodservice operators, combined with mature retail infrastructure, underpins the region’s dominance. The United States remains the largest contributor, supported by high per-capita consumption of packaged and convenience foods.
Europe maintains steady growth, with demand concentrated in markets such as Germany, the UK, and France, where spice blends are integral to daily cooking. Organic onion salt is gaining traction in this region, reflecting consumer preference for natural and clean-label products. Asia Pacific, however, is emerging as the fastest-growing region, supported by rapid urbanization, rising disposable incomes, and expanding modern retail networks in countries such as India and China.
Latin America and the Middle East & Africa are showing gradual adoption, primarily in processed food and snack applications. These regions remain price-sensitive, favoring conventional onion salt over premium variants. While North America will continue to generate the highest revenue, Asia Pacific is expected to record the strongest CAGR through 2034, making it a key growth hotspot for investors and manufacturers.
By Type (Organic, Conventional), By Packaging (Jars, Bottles, Bulk Packaging, Pouches, Others), By Distribution Channel (Direct Sales/B2B, Indirect Sales/B2C, Supermarkets/Hypermarkets, Convenience Stores, Specialty Stores, Online Retail), By End-user (Household, HoReCa, Food Processing)
Research Methodology
Primary Research- 100 Interviews of Stakeholders
Secondary Research
Desk Research
Regional scope
North America (United States, Canada, Mexico)
Latin America (Brazil, Argentina, Columbia)
East Asia And Pacific (China, Japan, South Korea, Australia, Cambodia, Fiji, Indonesia)
Sea And South Asia (India, Singapore, Thailand, Taiwan, Malaysia)
Eastern Europe (Poland, Russia, Czech Republic, Romania)
Western Europe (Germany, U.K., France, Spain, Itlay)
Middle East & Africa (GCC Countries, Egypt, Nigeria, South Africa, Israel)
Competitive Landscape
San Francisco Salt Company, Badia Spices, Mars, Incorporated, Hoyts Food Manufacturing Industries Pty Ltd, Aloha Spice Company, McCormick & Company, Inc., Woodland Foods, Schwartz, Redmond Life, The Kroger Co., Starlight Herb & Spice Company, B&G Foods, Inc., Aum Agri Freeze Foods, Tantara Farms, Other Key Players
Customization Scope
Customization for segments, region/country-level will be provided. Moreover, additional customization can be done based on the requirements.
Pricing and Purchase Options
Avail customized purchase options to meet your exact research needs. We have three licenses to opt for: Single User License, Multi-User License (Up to 5 Users), Corporate Use License (Unlimited User and Printable PDF).
TABLE OF CONTENTS
1. EXECUTIVE SUMMARY
1.1. MARKET SNAPSHOT
1.2. KEY FINDINGS & INSIGHTS
1.3. ANALYST RECOMMENDATIONS
1.4. FUTURE OUTLOOK
2. RESEARCH METHODOLOGY
2.1. MARKET DEFINITION & SCOPE
2.2. RESEARCH OBJECTIVES: PRIMARY & SECONDARY DATA SOURCES
2.3. DATA COLLECTION SOURCES
2.3.1. COVERAGE OF 100+ PRIMARY RESEARCH/CONSULTATION CALLS WITH INDUSTRY STAKEHOLDERS
FIGURE 17 NORTH AMERICA ONION SALT CURRENT AND FUTURE TYPE ANALYSIS, 2025–2034, (USD MILLION)
FIGURE 18 NORTH AMERICA ONION SALT CURRENT AND FUTURE END USER ANALYSIS, 2025–2034, (USD MILLION)
FIGURE 19 MARKET SHARE BY COUNTRY
FIGURE 20 LATIN AMERICA ONION SALT CURRENT AND FUTURE TYPE ANALYSIS, 2025–2034, (USD MILLION)
FIGURE 21 LATIN AMERICA ONION SALT CURRENT AND FUTURE END USER ANALYSIS, 2025–2034, (USD MILLION)
FIGURE 22 MARKET SHARE BY COUNTRY
FIGURE 23 EASTERN EUROPE ONION SALT CURRENT AND FUTURE TYPE ANALYSIS, 2025–2034, (USD MILLION)
FIGURE 24 EASTERN EUROPE ONION SALT CURRENT AND FUTURE END USER ANALYSIS, 2025–2034, (USD MILLION)
FIGURE 25 MARKET SHARE BY COUNTRY
FIGURE 26 WESTERN EUROPE ONION SALT CURRENT AND FUTURE TYPE ANALYSIS, 2025–2034, (USD MILLION)
FIGURE 27 WESTERN EUROPE ONION SALT CURRENT AND FUTURE END USER ANALYSIS, 2025–2034, (USD MILLION)
FIGURE 28 MARKET SHARE BY COUNTRY
FIGURE 29 EAST ASIA AND PACIFIC ONION SALT CURRENT AND FUTURE TYPE ANALYSIS, 2025–2034, (USD MILLION)
FIGURE 30 EAST ASIA AND PACIFIC ONION SALT CURRENT AND FUTURE END USER ANALYSIS, 2025–2034, (USD MILLION)
FIGURE 31 MARKET SHARE BY COUNTRY
FIGURE 32 SEA AND SOUTH ASIA ONION SALT CURRENT AND FUTURE TYPE ANALYSIS, 2025–2034, (USD MILLION)
FIGURE 33 SEA AND SOUTH ASIA ONION SALT CURRENT AND FUTURE END USER ANALYSIS, 2025–2034, (USD MILLION)
FIGURE 34 MARKET SHARE BY COUNTRY
FIGURE 35 MIDDLE EAST AND AFRICA ONION SALT CURRENT AND FUTURE TYPE ANALYSIS, 2025–2034, (USD MILLION)
FIGURE 36 MIDDLE EAST AND AFRICA ONION SALT CURRENT AND FUTURE END USER ANALYSIS, 2025–2034, (USD MILLION)
FIGURE 37 NORTH AMERICA ONION SALT CURRENT AND FUTURE MARKET VOLUME SHARE REGIONAL ANALYSIS, 2025–2034, (USD MILLION)
FIGURE 38 U.S. ONION SALT CURRENT AND FUTURE TYPE ANALYSIS, 2025–2034, (USD MILLION)
FIGURE 39 U.S. ONION SALT CURRENT AND FUTURE END USER ANALYSIS, 2025–2034, (USD MILLION)
FIGURE 40 CANADA ONION SALT CURRENT AND FUTURE TYPE ANALYSIS, 2025–2034, (USD MILLION)
FIGURE 41 CANADA ONION SALT CURRENT AND FUTURE END USER ANALYSIS, 2025–2034, (USD MILLION)
FIGURE 42 LATIN AMERICA ONION SALT CURRENT AND FUTURE MARKET VOLUME SHARE REGIONAL ANALYSIS, 2025–2034, (USD MILLION)
FIGURE 43 MEXICO ONION SALT CURRENT AND FUTURE TYPE ANALYSIS, 2025–2034, (USD MILLION)
FIGURE 44 MEXICO ONION SALT CURRENT AND FUTURE END USER ANALYSIS, 2025–2034, (USD MILLION)
FIGURE 45 BRAZIL ONION SALT CURRENT AND FUTURE TYPE ANALYSIS, 2025–2034, (USD MILLION)
FIGURE 46 BRAZIL ONION SALT CURRENT AND FUTURE END USER ANALYSIS, 2025–2034, (USD MILLION)
FIGURE 47 ARGENTINA ONION SALT CURRENT AND FUTURE TYPE ANALYSIS, 2025–2034, (USD MILLION)
FIGURE 48 ARGENTINA ONION SALT CURRENT AND FUTURE END USER ANALYSIS, 2025–2034, (USD MILLION)
FIGURE 49 COLUMBIA ONION SALT CURRENT AND FUTURE TYPE ANALYSIS, 2025–2034, (USD MILLION)
FIGURE 50 COLUMBIA ONION SALT CURRENT AND FUTURE END USER ANALYSIS, 2025–2034, (USD MILLION)
FIGURE 51 REST OF LATIN AMERICA ONION SALT CURRENT AND FUTURE TYPE ANALYSIS, 2025–2034, (USD MILLION)
FIGURE 52 REST OF LATIN AMERICA ONION SALT CURRENT AND FUTURE END USER ANALYSIS, 2025–2034, (USD MILLION)
FIGURE 53 EASTERN EUROPE ONION SALT CURRENT AND FUTURE MARKET VOLUME SHARE REGIONAL ANALYSIS, 2025–2034, (USD MILLION)
FIGURE 54 POLAND ONION SALT CURRENT AND FUTURE TYPE ANALYSIS, 2025–2034, (USD MILLION)
FIGURE 55 POLAND ONION SALT CURRENT AND FUTURE END USER ANALYSIS, 2025–2034, (USD MILLION)
FIGURE 56 RUSSIA ONION SALT CURRENT AND FUTURE TYPE ANALYSIS, 2025–2034, (USD MILLION)
FIGURE 57 RUSSIA ONION SALT CURRENT AND FUTURE END USER ANALYSIS, 2025–2034, (USD MILLION)
FIGURE 58 CZECH REPUBLIC ONION SALT CURRENT AND FUTURE TYPE ANALYSIS, 2025–2034, (USD MILLION)
FIGURE 59 CZECH REPUBLIC ONION SALT CURRENT AND FUTURE END USER ANALYSIS, 2025–2034, (USD MILLION)
FIGURE 60 ROMANIA ONION SALT CURRENT AND FUTURE TYPE ANALYSIS, 2025–2034, (USD MILLION)
FIGURE 61 ROMANIA ONION SALT CURRENT AND FUTURE END USER ANALYSIS, 2025–2034, (USD MILLION)
FIGURE 62 REST OF EASTERN EUROPE ONION SALT CURRENT AND FUTURE TYPE ANALYSIS, 2025–2034, (USD MILLION)
FIGURE 63 REST OF EASTERN EUROPE ONION SALT CURRENT AND FUTURE END USER ANALYSIS, 2025–2034, (USD MILLION)
FIGURE 64 WESTERN EUROPE ONION SALT CURRENT AND FUTURE MARKET VOLUME SHARE REGIONAL ANALYSIS, 2025–2034, (USD MILLION)
FIGURE 65 GERMANY ONION SALT CURRENT AND FUTURE TYPE ANALYSIS, 2025–2034, (USD MILLION)
FIGURE 66 GERMANY ONION SALT CURRENT AND FUTURE END USER ANALYSIS, 2025–2034, (USD MILLION)
FIGURE 67 FRANCE ONION SALT CURRENT AND FUTURE TYPE ANALYSIS, 2025–2034, (USD MILLION)
FIGURE 68 FRANCE ONION SALT CURRENT AND FUTURE END USER ANALYSIS, 2025–2034, (USD MILLION)
FIGURE 69 UK ONION SALT CURRENT AND FUTURE TYPE ANALYSIS, 2025–2034, (USD MILLION)
FIGURE 70 UK ONION SALT CURRENT AND FUTURE END USER ANALYSIS, 2025–2034, (USD MILLION)
FIGURE 71 SPAIN ONION SALT CURRENT AND FUTURE TYPE ANALYSIS, 2025–2034, (USD MILLION)
FIGURE 72 SPAIN ONION SALT CURRENT AND FUTURE END USER ANALYSIS, 2025–2034, (USD MILLION)
FIGURE 73 ITALY ONION SALT CURRENT AND FUTURE TYPE ANALYSIS, 2025–2034, (USD MILLION)
FIGURE 74 ITALY ONION SALT CURRENT AND FUTURE END USER ANALYSIS, 2025–2034, (USD MILLION)
FIGURE 75 REST OF WESTERN EUROPE ONION SALT CURRENT AND FUTURE TYPE ANALYSIS, 2025–2034, (USD MILLION)
FIGURE 76 REST OF WESTERN EUROPE ONION SALT CURRENT AND FUTURE END USER ANALYSIS, 2025–2034, (USD MILLION)
FIGURE 77 EAST ASIA AND PACIFIC ONION SALT CURRENT AND FUTURE MARKET VOLUME SHARE REGIONAL ANALYSIS, 2025–2034, (USD MILLION)
FIGURE 78 CHINA ONION SALT CURRENT AND FUTURE TYPE ANALYSIS, 2025–2034, (USD MILLION)
FIGURE 79 CHINA ONION SALT CURRENT AND FUTURE END USER ANALYSIS, 2025–2034, (USD MILLION)
FIGURE 80 JAPAN ONION SALT CURRENT AND FUTURE TYPE ANALYSIS, 2025–2034, (USD MILLION)
FIGURE 81 JAPAN ONION SALT CURRENT AND FUTURE END USER ANALYSIS, 2025–2034, (USD MILLION)
FIGURE 82 AUSTRALIA ONION SALT CURRENT AND FUTURE TYPE ANALYSIS, 2025–2034, (USD MILLION)
FIGURE 83 AUSTRALIA ONION SALT CURRENT AND FUTURE END USER ANALYSIS, 2025–2034, (USD MILLION)
FIGURE 84 CAMBODIA ONION SALT CURRENT AND FUTURE TYPE ANALYSIS, 2025–2034, (USD MILLION)
FIGURE 85 CAMBODIA ONION SALT CURRENT AND FUTURE END USER ANALYSIS, 2025–2034, (USD MILLION)
FIGURE 86 FIJI ONION SALT CURRENT AND FUTURE TYPE ANALYSIS, 2025–2034, (USD MILLION)
FIGURE 87 FIJI ONION SALT CURRENT AND FUTURE END USER ANALYSIS, 2025–2034, (USD MILLION)
FIGURE 88 INDONESIA ONION SALT CURRENT AND FUTURE TYPE ANALYSIS, 2025–2034, (USD MILLION)
FIGURE 89 INDONESIA ONION SALT CURRENT AND FUTURE END USER ANALYSIS, 2025–2034, (USD MILLION)
FIGURE 90 SOUTH KOREA ONION SALT CURRENT AND FUTURE TYPE ANALYSIS, 2025–2034, (USD MILLION)
FIGURE 91 SOUTH KOREA ONION SALT CURRENT AND FUTURE END USER ANALYSIS, 2025–2034, (USD MILLION)
FIGURE 92 REST OF EAST ASIA AND PACIFIC ONION SALT CURRENT AND FUTURE TYPE ANALYSIS, 2025–2034, (USD MILLION)
FIGURE 93 REST OF EAST ASIA AND PACIFIC ONION SALT CURRENT AND FUTURE END USER ANALYSIS, 2025–2034, (USD MILLION)
FIGURE 94 SEA AND SOUTH ASIA ONION SALT CURRENT AND FUTURE MARKET VOLUME SHARE REGIONAL ANALYSIS, 2025–2034, (USD MILLION)
FIGURE 95 BANGLADESH ONION SALT CURRENT AND FUTURE TYPE ANALYSIS, 2025–2034, (USD MILLION)
FIGURE 96 BANGLADESH ONION SALT CURRENT AND FUTURE END USER ANALYSIS, 2025–2034, (USD MILLION)
FIGURE 97 NEW ZEALAND ONION SALT CURRENT AND FUTURE TYPE ANALYSIS, 2025–2034, (USD MILLION)
FIGURE 98 NEW ZEALAND ONION SALT CURRENT AND FUTURE END USER ANALYSIS, 2025–2034, (USD MILLION)
FIGURE 99 INDIA ONION SALT CURRENT AND FUTURE TYPE ANALYSIS, 2025–2034, (USD MILLION)
FIGURE 100 INDIA ONION SALT CURRENT AND FUTURE END USER ANALYSIS, 2025–2034, (USD MILLION)
FIGURE 101 SINGAPORE ONION SALT CURRENT AND FUTURE TYPE ANALYSIS, 2025–2034, (USD MILLION)
FIGURE 102 SINGAPORE ONION SALT CURRENT AND FUTURE END USER ANALYSIS, 2025–2034, (USD MILLION)
FIGURE 103 THAILAND ONION SALT CURRENT AND FUTURE TYPE ANALYSIS, 2025–2034, (USD MILLION)
FIGURE 104 THAILAND ONION SALT CURRENT AND FUTURE END USER ANALYSIS, 2025–2034, (USD MILLION)
FIGURE 105 TAIWAN ONION SALT CURRENT AND FUTURE TYPE ANALYSIS, 2025–2034, (USD MILLION)
FIGURE 106 TAIWAN ONION SALT CURRENT AND FUTURE END USER ANALYSIS, 2025–2034, (USD MILLION)
FIGURE 107 MALAYSIA ONION SALT CURRENT AND FUTURE TYPE ANALYSIS, 2025–2034, (USD MILLION)
FIGURE 108 MALAYSIA ONION SALT CURRENT AND FUTURE END USER ANALYSIS, 2025–2034, (USD MILLION)
FIGURE 109 REST OF SEA AND SOUTH ASIA ONION SALT CURRENT AND FUTURE TYPE ANALYSIS, 2025–2034, (USD MILLION)
FIGURE 110 REST OF SEA AND SOUTH ASIA ONION SALT CURRENT AND FUTURE END USER ANALYSIS, 2025–2034, (USD MILLION)
FIGURE 111 MIDDLE EAST AND AFRICA ONION SALT CURRENT AND FUTURE MARKET VOLUME SHARE REGIONAL ANALYSIS, 2025–2034, (USD MILLION)
FIGURE 112 GCC COUNTRIES ONION SALT CURRENT AND FUTURE TYPE ANALYSIS, 2025–2034, (USD MILLION)
FIGURE 113 GCC COUNTRIES ONION SALT CURRENT AND FUTURE END USER ANALYSIS, 2025–2034, (USD MILLION)
FIGURE 114 SAUDI ARABIA ONION SALT CURRENT AND FUTURE TYPE ANALYSIS, 2025–2034, (USD MILLION)
FIGURE 115 SAUDI ARABIA ONION SALT CURRENT AND FUTURE END USER ANALYSIS, 2025–2034, (USD MILLION)
FIGURE 116 UAE ONION SALT CURRENT AND FUTURE TYPE ANALYSIS, 2025–2034, (USD MILLION)
FIGURE 117 UAE ONION SALT CURRENT AND FUTURE END USER ANALYSIS, 2025–2034, (USD MILLION)
FIGURE 118 BAHRAIN ONION SALT CURRENT AND FUTURE TYPE ANALYSIS, 2025–2034, (USD MILLION)
FIGURE 119 BAHRAIN ONION SALT CURRENT AND FUTURE END USER ANALYSIS, 2025–2034, (USD MILLION)
FIGURE 120 KUWAIT ONION SALT CURRENT AND FUTURE TYPE ANALYSIS, 2025–2034, (USD MILLION)
FIGURE 121 KUWAIT ONION SALT CURRENT AND FUTURE END USER ANALYSIS, 2025–2034, (USD MILLION)
FIGURE 122 OMAN ONION SALT CURRENT AND FUTURE TYPE ANALYSIS, 2025–2034, (USD MILLION)
FIGURE 123 OMAN ONION SALT CURRENT AND FUTURE END USER ANALYSIS, 2025–2034, (USD MILLION)
FIGURE 124 QATAR ONION SALT CURRENT AND FUTURE TYPE ANALYSIS, 2025–2034, (USD MILLION)
FIGURE 125 QATAR ONION SALT CURRENT AND FUTURE END USER ANALYSIS, 2025–2034, (USD MILLION)
FIGURE 126 EGYPT ONION SALT CURRENT AND FUTURE TYPE ANALYSIS, 2025–2034, (USD MILLION)
FIGURE 127 EGYPT ONION SALT CURRENT AND FUTURE END USER ANALYSIS, 2025–2034, (USD MILLION)
FIGURE 128 NIGERIA ONION SALT CURRENT AND FUTURE TYPE ANALYSIS, 2025–2034, (USD MILLION)
FIGURE 129 NIGERIA ONION SALT CURRENT AND FUTURE END USER ANALYSIS, 2025–2034, (USD MILLION)
FIGURE 130 SOUTH AFRICA ONION SALT CURRENT AND FUTURE TYPE ANALYSIS, 2025–2034, (USD MILLION)
FIGURE 131 SOUTH AFRICA ONION SALT CURRENT AND FUTURE END USER ANALYSIS, 2025–2034, (USD MILLION)
FIGURE 132 ISRAEL ONION SALT CURRENT AND FUTURE TYPE ANALYSIS, 2025–2034, (USD MILLION)
FIGURE 133 ISRAEL ONION SALT CURRENT AND FUTURE END USER ANALYSIS, 2025–2034, (USD MILLION)
FIGURE 134 REST OF MEA ONION SALT CURRENT AND FUTURE TYPE ANALYSIS, 2025–2034, (USD MILLION)
FIGURE 135 REST OF MEA ONION SALT CURRENT AND FUTURE END USER ANALYSIS, 2025–2034, (USD MILLION)
FIGURE 136 U. S. MARKET SHARE ANALYSIS BY TYPE (2024)
FIGURE 137 U. S. MARKET SHARE ANALYSIS BY END USER (2024)
FIGURE 138 CANADA MARKET SHARE ANALYSIS BY TYPE (2024)
FIGURE 139 CANADA MARKET SHARE ANALYSIS BY END USER (2024)
FIGURE 140 MEXICO MARKET SHARE ANALYSIS BY TYPE (2024)
FIGURE 141 MEXICO MARKET SHARE ANALYSIS BY END USER (2024)
FIGURE 142 CHINA MARKET SHARE ANALYSIS BY TYPE (2024)
FIGURE 143 CHINA MARKET SHARE ANALYSIS BY END USER (2024)
FIGURE 144 JAPAN MARKET SHARE ANALYSIS BY TYPE (2024)
FIGURE 145 JAPAN MARKET SHARE ANALYSIS BY END USER (2024)
FIGURE 146 INDIA MARKET SHARE ANALYSIS BY TYPE (2024)
FIGURE 147 INDIA MARKET SHARE ANALYSIS BY END USER (2024)
FIGURE 148 SOUTH KOREA MARKET SHARE ANALYSIS BY TYPE (2024)
FIGURE 149 SOUTH KOREA MARKET SHARE ANALYSIS BY END USER (2024)
FIGURE 150 SAUDI ARABIA MARKET SHARE ANALYSIS BY TYPE (2024)
FIGURE 151 SAUDI ARABIA MARKET SHARE ANALYSIS BY END USER (2024)
FIGURE 152 UAE MARKET SHARE ANALYSIS BY TYPE (2024)
FIGURE 153 UAE MARKET SHARE ANALYSIS BY END USER (2024)
FIGURE 154 EGYPT MARKET SHARE ANALYSIS BY TYPE (2024)
FIGURE 155 EGYPT MARKET SHARE ANALYSIS BY END USER (2024)
FIGURE 156 NIGERIA MARKET SHARE ANALYSIS BY TYPE (2024)
FIGURE 157 NIGERIA MARKET SHARE ANALYSIS BY END USER (2024)
FIGURE 158 SOUTH AFRICA MARKET SHARE ANALYSIS BY TYPE (2024)
FIGURE 159 SOUTH AFRICA MARKET SHARE ANALYSIS BY END USER (2024)
FIGURE 160 GERMANY MARKET SHARE ANALYSIS BY TYPE (2024)
FIGURE 161 GERMANY MARKET SHARE ANALYSIS BY END USER (2024)
FIGURE 162 FRANCE MARKET SHARE ANALYSIS BY TYPE (2024)
FIGURE 163 FRANCE MARKET SHARE ANALYSIS BY END USER (2024)
FIGURE 164 UK MARKET SHARE ANALYSIS BY TYPE (2024)
FIGURE 165 UK MARKET SHARE ANALYSIS BY END USER (2024)
FIGURE 166 SPAIN MARKET SHARE ANALYSIS BY TYPE (2024)
FIGURE 167 SPAIN MARKET SHARE ANALYSIS BY END USER (2024)
FIGURE 168 ITALY MARKET SHARE ANALYSIS BY TYPE (2024)
FIGURE 169 ITALY MARKET SHARE ANALYSIS BY END USER (2024)
FIGURE 170 BRAZIL MARKET SHARE ANALYSIS BY TYPE (2024)
FIGURE 171 BRAZIL MARKET SHARE ANALYSIS BY END USER (2024)
FIGURE 172 ARGENTINA MARKET SHARE ANALYSIS BY TYPE (2024)
FIGURE 173 ARGENTINA MARKET SHARE ANALYSIS BY END USER (2024)
FIGURE 174 COLUMBIA MARKET SHARE ANALYSIS BY TYPE (2024)
FIGURE 175 COLUMBIA MARKET SHARE ANALYSIS BY END USER (2024)
FIGURE 176 GLOBAL ONION SALT CURRENT AND FUTURE MARKET KEY COUNTRY LEVEL ANALYSIS, 2024–2034, (USD MILLION)
FIGURE 177 FINANCIAL OVERVIEW:
Key Player Analysis
B&G Foods, Inc: Leader. B&G Foods maintains a broad seasoning portfolio that includes onion salt across multiple house brands and private label supply. The company leverages national retail penetration in North America and established foodservice relationships to drive stable, repeat volumes. As of 2025, B&G is focused on margin improvement through automated blending lines, network optimization, and SKU rationalization. It is piloting AI-driven demand forecasting to reduce stockouts and cut carrying costs, with early programs reporting mid-single-digit service-level gains. The company is expanding low-sodium and clean-label formulations to align with retailer health initiatives. This shift positions B&G to protect shelf space while capturing incremental growth in health-conscious segments.
B&G differentiates with scale, multi-channel reach, and cost discipline. Its private label manufacturing capabilities provide pricing flexibility that appeals to large grocery chains and club stores. The firm is targeting 2–3 percent annual volume growth in core spices through 2027, supported by distribution wins and improved fill rates. For you, the strategic takeaway is clear. B&G’s execution strength and contract manufacturing depth make it a reliable partner for private label onion salt and adjacent blends.
Badia Spices: Challenger. Badia competes on price, breadth of SKUs, and strong presence in value-focused retail and ethnic grocery channels. Its onion salt line sits within a large portfolio of single spices and blends that appeal to household buyers seeking affordability without sacrificing consistency. In 2025, Badia is expanding omnichannel distribution, adding marketplace and direct-to-consumer channels to complement traditional supermarkets. It is investing in packaging upgrades and pack-size variety to improve shelf productivity and online conversion.
Badia’s differentiator is efficient sourcing and lean packaging that hold price points below national brands. The company also drives velocity with recipe-led content and in-aisle promotions. Expect continued share gains in B2C, especially in convenience and online formats. For buyers, Badia offers dependable supply and competitive pricing for onion salt and flavored variants that can anchor entry-level assortments.
Hoyts Food Manufacturing Industries Pty Ltd: Niche player. Hoyts serves Australia and select Asia Pacific markets with a focus on grocery and independent retail. Its onion salt and core seasonings emphasize consistent quality, large-value packs, and dependable availability for budget-conscious consumers. In 2025, Hoyts is consolidating distribution partnerships and enhancing demand planning to stabilize service levels across regional channels. The firm is also trialing recyclable packaging and energy-efficient operations to reduce unit costs and meet retailer sustainability targets.
Hoyts differentiates through local market knowledge, agile production runs, and competitive pricing in larger pack sizes. This positioning supports steady volumes in family and foodservice value segments. The company’s growth outlook centers on incremental store additions and online marketplace exposure. For your procurement plans, Hoyts offers reliable supply for Australia-centric assortments and private label collaborations in onion salt.
The Kroger Co.: Leader in private label retail. Kroger drives significant category volumes through its store-brand seasonings, including onion salt, supported by extensive U.S. retail coverage and mature data analytics. In 2025, Kroger is accelerating AI-enabled assortment and demand planning to increase on-shelf availability. It is expanding health-forward SKUs, including reduced-sodium onion salt and clean-label lines, to meet shopper wellness preferences. Private label pricing remains a key tactic, with category resets focused on improving shelf productivity and basket value.
Kroger’s differentiator is end-to-end retail data and merchandising control. It can test pack sizes, price tiers, and flavor extensions quickly across thousands of stores, then scale winners. Expect Kroger to retain category leadership via sharper promotional cadence, improved online search placement, and click-and-collect penetration. For suppliers, Kroger’s standards around label transparency and supply reliability will shape which onion salt SKUs earn shelf space and long-term contracts.
Market Key Players
San Francisco Salt Company
Badia Spices
Mars, Incorporated
Hoyts Food Manufacturing Industries Pty Ltd
Aloha Spice Company
McCormick & Company, Inc.
Woodland Foods
Schwartz
Redmond Life
The Kroger Co.
Starlight Herb & Spice Company
B&G Foods, Inc.
Aum Agri Freeze Foods
Tantara Farms
Other Key Players
Driver
Rising Demand for Convenience-Oriented Seasonings
By 2025, the global trend towards convenience-driven food consumption will significantly impact the onion salt market. Busy lifestyles, growing urban populations, and more dual-income households are driving the need for ready-to-use seasonings that make meal prep easier. Onion salt provides a quick alternative to fresh onions, offering consistent flavor without the need to peel, chop, or cook. This makes it a popular choice in both home and commercial kitchens. This appeal for convenience is particularly strong in processed foods, snacks, and ready-to-eat meals, where efficiency and consistent taste matter.
Growth of Packaged Food and Foodservice Sectors
The fast growth of the global packaged food industry and foodservice sector further boosts market expansion. Quick-service restaurants, catering services, and institutional kitchens increasingly use standardized seasoning blends to keep flavors consistent across locations. Onion salt is commonly found in meat rubs, sauces, soups, and snack coatings, driving repeat, high-volume demand. As foodservice revenues worldwide continue to rise, especially in emerging markets, onion salt consumption is expected to grow as well.
Restraint
Health Concerns Related to Sodium Content
High sodium content is a major concern for the onion salt market. More people are becoming aware of the connection between high salt intake and health problems like high blood pressure and heart disease. Campaigns and dietary guidelines in North America and Europe are encouraging lower salt consumption, which could slow growth for traditional onion salt products.
Regulatory and Labeling Pressures
Regulatory attention on sodium labeling and nutrition transparency is increasing. Governments are enforcing stricter front-of-pack labeling rules and sodium disclosure requirements, raising compliance costs for manufacturers. In some regions, reformulation may be necessary to meet sodium-reduction targets, which could affect taste and production costs. These regulatory challenges are particularly tough for smaller producers with limited research and development resources.
Opportunity
Expansion in High-Growth Emerging Markets
Asia-Pacific and Latin America offer the best growth potential for the onion salt market. Rapid urbanization, rising incomes, and the growth of modern retail formats are changing food consumption patterns in these areas. As packaged foods and Western-style cooking become more popular, demand for versatile seasoning blends like onion salt is increasing faster than in established markets.
Product Innovation and Health-Focused Variants
New developments in low-sodium, organic, and clean-label onion salt options present a great opportunity to attract more consumers. Health-conscious shoppers are looking for seasonings made with minimal processing, natural ingredients, and lower salt content. Manufacturers who invest in alternative salt blends, such as mineral salts or reduced-sodium options, can set themselves apart and charge higher prices, especially in North America and Europe.
Trend
Diversification of Product Formats and Applications
Product diversity is a key trend influencing the onion salt market in 2025. Manufacturers are moving beyond regular fine powders to include granulated, coarse, and specialty blends to cater to various cooking needs. These formats appeal to different users, from home cooks wanting texture variety to food processors needing consistent coating performance. This diversity expands market reach across retail, foodservice, and industrial sectors.
Digital Retail and Private Label Expansion
The rapid rise of online shopping and private-label products is changing the competitive landscape. Online grocery platforms are making it easier for shoppers to discover products, allowing smaller brands to compete alongside bigger players. Retailers are also growing their private-label onion salt offerings to increase profit margins and meet the needs of cost-conscious buyers. Data-driven product planning and digital marketing are increasingly affecting brand visibility and shifting competition from traditional shelves to omnichannel engagement.
Recent Developments
Dec 2024 – B&G Foods, Inc.: Announced a $15 million capital investment in a new, fully compostable packaging line for its entire spice portfolio, including its onion salt products. This move strengthens its brand appeal among environmentally conscious consumers and prepares the company for stricter packaging regulations in key markets.
Feb 2025 – Simply Organic: Launched a new series of USDA-certified organic and low-sodium onion salt blends, rolled out across major North American health food retailers. The product line is designed to capture the growing health-conscious consumer segment, expanding the company's presence in the premium wellness market.
Apr 2025 – McCormick & Company, Inc.: Completed the acquisition of a prominent regional spice processor based in Southeast Asia for an estimated $45 million. This acquisition provides McCormick with critical production capacity and established distribution networks to accelerate its growth in the high-demand Asia-Pacific market.
Jul 2025 – Badia Spices Inc.: Secured a multi-year, exclusive supply agreement with a global quick-service restaurant (QSR) operator serving over 5,000 locations. The contract significantly increases its penetration in the B2B foodservice channel and secures a high-volume, long-term revenue stream.
Sep 2025 – The Kroger Co.: Introduced a new private-label collection of gourmet onion salts, featuring toasted onion and smoked salt variations, in over 2,000 U.S. stores. This product extension allows Kroger to compete directly with national brands for market share in the premium home-cooking segment.