Online Dating Market Size, Share & Forecast | 8.00% CAGR
Global Online Dating Market Size, Share & Analysis By Platform Type (Mobile Apps, Websites, Social Media), By Subscription Model (Free, Freemium, Paid, By User, Younger Adults, Older Adults), By Service Features (Video Dating, Chat Services, Matching Algorithms), Industry Outlook, Monetization Trends & Forecast 2025–2034
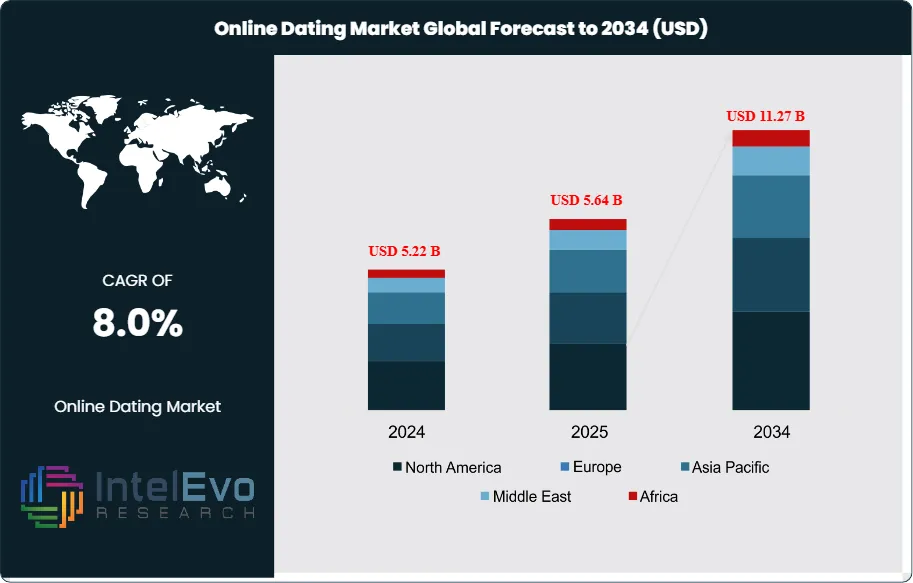
The Online Dating Services Market is estimated at USD 5.64 billion in 2025 and is on track to reach roughly USD 11.27 billion by 2034, implying a compound annual growth rate of 8.00% over 2025–2034. With rising smartphone penetration, AI-driven matchmaking, and increasing global acceptance of digital relationships, the industry is entering a new phase of premium monetization and user expansion. The rise of video-first interactions, safety verification tools, and hyper-personalized recommendations continues to redefine modern dating behavior. As Gen Z and Millennials dominate the digital relationship landscape, online dating platforms are set to become one of the fastest-evolving segments of the global social tech ecosystem.
The market saw renewed growth, with revenue increasing from USD 5.22 billion in 2024 to USD 5.64 billion in 2025, a gain of USD 420 million. This signals healthier monetization after several years of stabilizing the user base. Between 2025 and 2034, the industry is expected to add nearly USD 5.63 billion in value, driving total market growth to nearly USD 10.45 billion by 2034. This represents almost a 99 to 100% increase in overall market size, showing strong demand fundamentals and improving platform economics.
Several key factors are shaping the growth path. Increased smartphone use is expanding the reachable user base in both established and emerging markets. At the same time, consumers are more willing to pay for better safety, personalization, and verification features, leading to greater adoption of premium subscriptions and in-app purchases. Platforms now combine revenue streams, including membership tiers, boost packages, and targeted ads, to maximize ARPU. These demand-side shifts support the market’s continued growth through 2034.
On the supply side, machine learning and recommendation systems have significantly improved operating efficiency. AI-driven ranking, natural language models, and behavioral prediction systems shorten the time to first match and increase session engagement, resulting in better retention and recurring revenue. New features like video interaction and real-time identity checks make conversion funnels shorter, improving trust and reducing churn. Additionally, automated moderation and AI fraud detection have boosted onboarding efficiency, though this comes with increased operational costs.
Regulatory conditions are becoming more complicated, especially in Europe and Asia Pacific. Digital services laws, data localization rules, and tougher privacy enforcement are raising compliance costs for platforms managing cross-border user flows by mid-single-digit percentages. While these rules enhance data governance and consumer safety, they also slow market entry and increase operational risk for new and expanding firms. Platforms need to balance fast growth with compliance to regional laws to avoid penalties and disruptions.
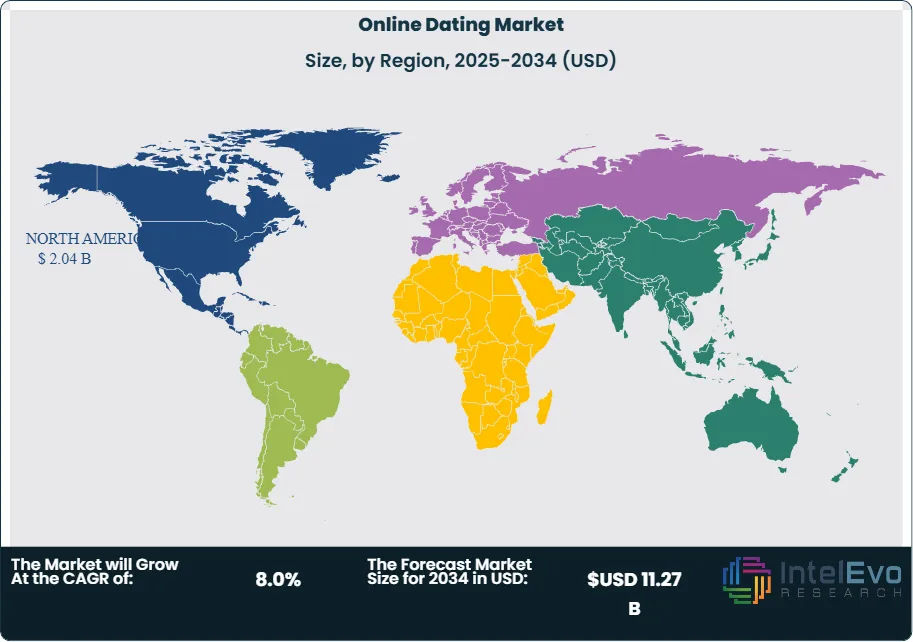
North America continues to be the largest revenue source due to high ARPU and widespread use of premium features. In contrast, Asia Pacific is the fastest-growing area, driven by mobile-first adoption, a growing youth population, and lower customer acquisition costs. Markets such as India, Indonesia, and the Philippines are attracting significant venture and strategic investment, as investors are drawn to high engagement and large potential audiences. Competitive pressure is rising as established players consolidate and niche platforms—like faith-based matching, professional networks, and identity-first services—gain popularity.
Looking forward, organizations should focus on ongoing product investment in AI-driven matching, trust and safety features, and dynamic pricing tools. The industry’s expected 8.0% CAGR from 2025 to 2034 highlights the need for continued innovation in user verification, personalization, fraud prevention, and ARPU growth strategies. Investment strategies should emphasize expansion in the APAC market while preparing for stricter compliance requirements in regulated areas. Stakeholders who invest early in scalable AI infrastructure and trust initiatives are best poised to lead the next phase of market growth.
Key Takeaways
Market Growth: The online dating services market measured USD 5.22 billion in 2024 and USD 5.64 billion in 2025; it is projected to reach USD 11.27 billion by 2034 at an 8.00% CAGR from 2025–2034, adding roughly USD 5.63 billion in incremental revenue over the forecast period.
Platform Type:Mobile apps: Mobile applications led platform usage in 2024 and accounted for the largest share of sessions and downloads; app-led engagement supported the USD 0.42 billion year-on-year increase from 2024 to 2025.
Revenue Model:Paid subscriptions: The paid subscription model generated the largest revenue share in 2024, supplying the primary recurring ARPU; this model drives monetization through tiered pricing and verification features.
Driver:Younger cohorts: Younger users led market participation in 2024, with under-35 cohorts supplying the bulk of new signups and higher conversion rates to paid tiers; this demographic underpins advertising inventory and subscription growth.
Restraint:Regulation and compliance costs: Data protection and regional digital services rules raised compliance spend for EU-facing operators by mid-single-digit percent, increasing onboarding friction and marginal unit costs.
Opportunity:Asia Pacific expansion: APAC is the fastest growth region; conservative estimates point to a regional CAGR near 10.0% through 2034, driven by mobile-first users in India and Southeast Asia and lower customer acquisition costs compared with developed markets.
Trend:Video and trust features: Video dating is the fastest growing service feature; in several APAC markets video engagement exceeds 40% of active sessions, and firms such as Match Group and Bumble are scaling video and ID verification investments.
Regional Analysis: North America led with a 39% market share in 2024 and delivers the highest ARPU; APAC shows stronger user growth and lower CAC; Europe grows slower due to compliance headwinds. You should prioritize APAC market entries while budgeting for elevated EU compliance costs.
Platform Type Analysis
Mobile applications remain the primary access point for online dating in 2025. Apps capture the bulk of user sessions and downloads due to always-on connectivity and push-driven engagement; continuous UX updates and integrated security checks have raised daily active user rates and improved retention. Free app tiers sustain scale while paid upgrades lift average revenue per user; major operators such as Match Group, Bumble and Hinge invest heavily in app experience and video features to protect share. Websites continue to serve as a stable complement. Desktop and mobile-web channels deliver broader accessibility for older demographics and corporate audiences; they account for steady traffic and conversion among users who prefer longer-form profiles and search filters. Expect measured growth in website usage as smartphone penetration rises across secondary markets.
Subscription Model Analysis
Paid subscriptions generated the largest revenue share in 2024 and remain the dominant monetization engine in 2025. Recurring plans, including monthly and annual tiers, drive predictable cash flow and supported the market’s increase from USD 5.22 billion in 2024 to USD 5.64 billion in 2025. You should expect companies to refine tiering and add verification services to protect ARPU. Freemium models will expand fastest among business models. Basic free access widens the funnel while in-app purchases and time-limited boosts convert high-intent users; conversion improvements of a few percentage points can materially raise lifetime value. Platforms use targeted promotions and trial periods to lift single-digit conversion rates into paid tiers.
User Analysis
Younger cohorts continue to account for the largest share of new signups in 2025. Users under 35 register most frequently and show higher conversion to paid tiers; this group supplies ad inventory and fuels feature A/B testing. Niche verticals that target interests or professions also grow within this base. Older adults represent the fastest-growing demographic segment. Services that add simplified onboarding, safety controls, and concierge-style matching report faster uptake among 50-plus users. Examples include SilverSingles and eHarmony, which tailor communications and verification to reduce friction and raise retention.
Service Feature Analysis
Text chat remained the most used interaction mode in 2024 and still anchors early-stage engagement in 2025. Chat features support initial rapport building and permit scalable moderation workflows; improvements in automated moderation have cut harmful content incidents and improved time-to-first-safe-interaction. Video dating shows the highest growth rate. In several APAC markets video now represents more than 40% of active sessions; platforms such as Bumble and Hinge have rolled out native video calls and short-form video uploads to increase match confidence and shorten conversion cycles.
Regional Analysis
North America led with roughly 39% share in 2024 and delivers the highest ARPU in 2025; incumbents benefit from mature payment markets and strong advertiser demand. Asia Pacific records the fastest user growth and the largest runway for expansion; conservative estimates indicate regional CAGR near 10% through the next decade driven by India and Southeast Asia. Europe offers steady revenue but higher compliance costs due to data protection rules; you should budget for mid-single-digit increases in compliance spend when planning EU entries. Latin America and Middle East & Africa show selective pockets of rapid adoption, making them tactical targets for region-specific product and pricing experiments.
By Platform Type (Mobile Apps, Websites, Social Media), By Subscription Model (Free, Freemium, Paid, By User, Younger Adults, Older Adults), By Service Features (Video Dating, Chat Services, Matching Algorithms)
Research Methodology
Primary Research- 100 Interviews of Stakeholders
Secondary Research
Desk Research
Regional scope
North America (United States, Canada, Mexico)
Latin America (Brazil, Argentina, Columbia)
East Asia And Pacific (China, Japan, South Korea, Australia, Cambodia, Fiji, Indonesia)
Sea And South Asia (India, Singapore, Thailand, Taiwan, Malaysia)
Eastern Europe (Poland, Russia, Czech Republic, Romania)
Western Europe (Germany, U.K., France, Spain, Itlay)
Middle East & Africa (GCC Countries, Egypt, Nigeria, South Africa, Israel)
Competitive Landscape
OkCupid, Hinge, Pure, Tantan, Badoo, Tinder, eHarmony, Coffee Meets Bagel, Bumble, Grindr, Plenty of Fish, Zoosk, Happn, Match Group
Customization Scope
Customization for segments, region/country-level will be provided. Moreover, additional customization can be done based on the requirements.
Pricing and Purchase Options
Avail customized purchase options to meet your exact research needs. We have three licenses to opt for: Single User License, Multi-User License (Up to 5 Users), Corporate Use License (Unlimited User and Printable PDF).
TABLE OF CONTENTS
1. EXECUTIVE SUMMARY
1.1. MARKET SNAPSHOT
1.2. KEY FINDINGS & INSIGHTS
1.3. ANALYST RECOMMENDATIONS
1.4. FUTURE OUTLOOK
2. RESEARCH METHODOLOGY
2.1. MARKET DEFINITION & SCOPE
2.2. RESEARCH OBJECTIVES: PRIMARY & SECONDARY DATA SOURCES
2.3. DATA COLLECTION SOURCES
2.3.1. COVERAGE OF 100+ PRIMARY RESEARCH/CONSULTATION CALLS WITH INDUSTRY STAKEHOLDERS
FIGURE 17 NORTH AMERICA ONLINE DATING CURRENT AND FUTURE TYPE ANALYSIS, 2025–2034, (USD MILLION)
FIGURE 18 NORTH AMERICA ONLINE DATING CURRENT AND FUTURE END USER ANALYSIS, 2025–2034, (USD MILLION)
FIGURE 19 MARKET SHARE BY COUNTRY
FIGURE 20 LATIN AMERICA ONLINE DATING CURRENT AND FUTURE TYPE ANALYSIS, 2025–2034, (USD MILLION)
FIGURE 21 LATIN AMERICA ONLINE DATING CURRENT AND FUTURE END USER ANALYSIS, 2025–2034, (USD MILLION)
FIGURE 22 MARKET SHARE BY COUNTRY
FIGURE 23 EASTERN EUROPE ONLINE DATING CURRENT AND FUTURE TYPE ANALYSIS, 2025–2034, (USD MILLION)
FIGURE 24 EASTERN EUROPE ONLINE DATING CURRENT AND FUTURE END USER ANALYSIS, 2025–2034, (USD MILLION)
FIGURE 25 MARKET SHARE BY COUNTRY
FIGURE 26 WESTERN EUROPE ONLINE DATING CURRENT AND FUTURE TYPE ANALYSIS, 2025–2034, (USD MILLION)
FIGURE 27 WESTERN EUROPE ONLINE DATING CURRENT AND FUTURE END USER ANALYSIS, 2025–2034, (USD MILLION)
FIGURE 28 MARKET SHARE BY COUNTRY
FIGURE 29 EAST ASIA AND PACIFIC ONLINE DATING CURRENT AND FUTURE TYPE ANALYSIS, 2025–2034, (USD MILLION)
FIGURE 30 EAST ASIA AND PACIFIC ONLINE DATING CURRENT AND FUTURE END USER ANALYSIS, 2025–2034, (USD MILLION)
FIGURE 31 MARKET SHARE BY COUNTRY
FIGURE 32 SEA AND SOUTH ASIA ONLINE DATING CURRENT AND FUTURE TYPE ANALYSIS, 2025–2034, (USD MILLION)
FIGURE 33 SEA AND SOUTH ASIA ONLINE DATING CURRENT AND FUTURE END USER ANALYSIS, 2025–2034, (USD MILLION)
FIGURE 34 MARKET SHARE BY COUNTRY
FIGURE 35 MIDDLE EAST AND AFRICA ONLINE DATING CURRENT AND FUTURE TYPE ANALYSIS, 2025–2034, (USD MILLION)
FIGURE 36 MIDDLE EAST AND AFRICA ONLINE DATING CURRENT AND FUTURE END USER ANALYSIS, 2025–2034, (USD MILLION)
FIGURE 37 NORTH AMERICA ONLINE DATING CURRENT AND FUTURE MARKET VOLUME SHARE REGIONAL ANALYSIS, 2025–2034, (USD MILLION)
FIGURE 38 U.S. ONLINE DATING CURRENT AND FUTURE TYPE ANALYSIS, 2025–2034, (USD MILLION)
FIGURE 39 U.S. ONLINE DATING CURRENT AND FUTURE END USER ANALYSIS, 2025–2034, (USD MILLION)
FIGURE 40 CANADA ONLINE DATING CURRENT AND FUTURE TYPE ANALYSIS, 2025–2034, (USD MILLION)
FIGURE 41 CANADA ONLINE DATING CURRENT AND FUTURE END USER ANALYSIS, 2025–2034, (USD MILLION)
FIGURE 42 LATIN AMERICA ONLINE DATING CURRENT AND FUTURE MARKET VOLUME SHARE REGIONAL ANALYSIS, 2025–2034, (USD MILLION)
FIGURE 43 MEXICO ONLINE DATING CURRENT AND FUTURE TYPE ANALYSIS, 2025–2034, (USD MILLION)
FIGURE 44 MEXICO ONLINE DATING CURRENT AND FUTURE END USER ANALYSIS, 2025–2034, (USD MILLION)
FIGURE 45 BRAZIL ONLINE DATING CURRENT AND FUTURE TYPE ANALYSIS, 2025–2034, (USD MILLION)
FIGURE 46 BRAZIL ONLINE DATING CURRENT AND FUTURE END USER ANALYSIS, 2025–2034, (USD MILLION)
FIGURE 47 ARGENTINA ONLINE DATING CURRENT AND FUTURE TYPE ANALYSIS, 2025–2034, (USD MILLION)
FIGURE 48 ARGENTINA ONLINE DATING CURRENT AND FUTURE END USER ANALYSIS, 2025–2034, (USD MILLION)
FIGURE 49 COLUMBIA ONLINE DATING CURRENT AND FUTURE TYPE ANALYSIS, 2025–2034, (USD MILLION)
FIGURE 50 COLUMBIA ONLINE DATING CURRENT AND FUTURE END USER ANALYSIS, 2025–2034, (USD MILLION)
FIGURE 51 REST OF LATIN AMERICA ONLINE DATING CURRENT AND FUTURE TYPE ANALYSIS, 2025–2034, (USD MILLION)
FIGURE 52 REST OF LATIN AMERICA ONLINE DATING CURRENT AND FUTURE END USER ANALYSIS, 2025–2034, (USD MILLION)
FIGURE 53 EASTERN EUROPE ONLINE DATING CURRENT AND FUTURE MARKET VOLUME SHARE REGIONAL ANALYSIS, 2025–2034, (USD MILLION)
FIGURE 54 POLAND ONLINE DATING CURRENT AND FUTURE TYPE ANALYSIS, 2025–2034, (USD MILLION)
FIGURE 55 POLAND ONLINE DATING CURRENT AND FUTURE END USER ANALYSIS, 2025–2034, (USD MILLION)
FIGURE 56 RUSSIA ONLINE DATING CURRENT AND FUTURE TYPE ANALYSIS, 2025–2034, (USD MILLION)
FIGURE 57 RUSSIA ONLINE DATING CURRENT AND FUTURE END USER ANALYSIS, 2025–2034, (USD MILLION)
FIGURE 58 CZECH REPUBLIC ONLINE DATING CURRENT AND FUTURE TYPE ANALYSIS, 2025–2034, (USD MILLION)
FIGURE 59 CZECH REPUBLIC ONLINE DATING CURRENT AND FUTURE END USER ANALYSIS, 2025–2034, (USD MILLION)
FIGURE 60 ROMANIA ONLINE DATING CURRENT AND FUTURE TYPE ANALYSIS, 2025–2034, (USD MILLION)
FIGURE 61 ROMANIA ONLINE DATING CURRENT AND FUTURE END USER ANALYSIS, 2025–2034, (USD MILLION)
FIGURE 62 REST OF EASTERN EUROPE ONLINE DATING CURRENT AND FUTURE TYPE ANALYSIS, 2025–2034, (USD MILLION)
FIGURE 63 REST OF EASTERN EUROPE ONLINE DATING CURRENT AND FUTURE END USER ANALYSIS, 2025–2034, (USD MILLION)
FIGURE 64 WESTERN EUROPE ONLINE DATING CURRENT AND FUTURE MARKET VOLUME SHARE REGIONAL ANALYSIS, 2025–2034, (USD MILLION)
FIGURE 65 GERMANY ONLINE DATING CURRENT AND FUTURE TYPE ANALYSIS, 2025–2034, (USD MILLION)
FIGURE 66 GERMANY ONLINE DATING CURRENT AND FUTURE END USER ANALYSIS, 2025–2034, (USD MILLION)
FIGURE 67 FRANCE ONLINE DATING CURRENT AND FUTURE TYPE ANALYSIS, 2025–2034, (USD MILLION)
FIGURE 68 FRANCE ONLINE DATING CURRENT AND FUTURE END USER ANALYSIS, 2025–2034, (USD MILLION)
FIGURE 69 UK ONLINE DATING CURRENT AND FUTURE TYPE ANALYSIS, 2025–2034, (USD MILLION)
FIGURE 70 UK ONLINE DATING CURRENT AND FUTURE END USER ANALYSIS, 2025–2034, (USD MILLION)
FIGURE 71 SPAIN ONLINE DATING CURRENT AND FUTURE TYPE ANALYSIS, 2025–2034, (USD MILLION)
FIGURE 72 SPAIN ONLINE DATING CURRENT AND FUTURE END USER ANALYSIS, 2025–2034, (USD MILLION)
FIGURE 73 ITALY ONLINE DATING CURRENT AND FUTURE TYPE ANALYSIS, 2025–2034, (USD MILLION)
FIGURE 74 ITALY ONLINE DATING CURRENT AND FUTURE END USER ANALYSIS, 2025–2034, (USD MILLION)
FIGURE 75 REST OF WESTERN EUROPE ONLINE DATING CURRENT AND FUTURE TYPE ANALYSIS, 2025–2034, (USD MILLION)
FIGURE 76 REST OF WESTERN EUROPE ONLINE DATING CURRENT AND FUTURE END USER ANALYSIS, 2025–2034, (USD MILLION)
FIGURE 77 EAST ASIA AND PACIFIC ONLINE DATING CURRENT AND FUTURE MARKET VOLUME SHARE REGIONAL ANALYSIS, 2025–2034, (USD MILLION)
FIGURE 78 CHINA ONLINE DATING CURRENT AND FUTURE TYPE ANALYSIS, 2025–2034, (USD MILLION)
FIGURE 79 CHINA ONLINE DATING CURRENT AND FUTURE END USER ANALYSIS, 2025–2034, (USD MILLION)
FIGURE 80 JAPAN ONLINE DATING CURRENT AND FUTURE TYPE ANALYSIS, 2025–2034, (USD MILLION)
FIGURE 81 JAPAN ONLINE DATING CURRENT AND FUTURE END USER ANALYSIS, 2025–2034, (USD MILLION)
FIGURE 82 AUSTRALIA ONLINE DATING CURRENT AND FUTURE TYPE ANALYSIS, 2025–2034, (USD MILLION)
FIGURE 83 AUSTRALIA ONLINE DATING CURRENT AND FUTURE END USER ANALYSIS, 2025–2034, (USD MILLION)
FIGURE 84 CAMBODIA ONLINE DATING CURRENT AND FUTURE TYPE ANALYSIS, 2025–2034, (USD MILLION)
FIGURE 85 CAMBODIA ONLINE DATING CURRENT AND FUTURE END USER ANALYSIS, 2025–2034, (USD MILLION)
FIGURE 86 FIJI ONLINE DATING CURRENT AND FUTURE TYPE ANALYSIS, 2025–2034, (USD MILLION)
FIGURE 87 FIJI ONLINE DATING CURRENT AND FUTURE END USER ANALYSIS, 2025–2034, (USD MILLION)
FIGURE 88 INDONESIA ONLINE DATING CURRENT AND FUTURE TYPE ANALYSIS, 2025–2034, (USD MILLION)
FIGURE 89 INDONESIA ONLINE DATING CURRENT AND FUTURE END USER ANALYSIS, 2025–2034, (USD MILLION)
FIGURE 90 SOUTH KOREA ONLINE DATING CURRENT AND FUTURE TYPE ANALYSIS, 2025–2034, (USD MILLION)
FIGURE 91 SOUTH KOREA ONLINE DATING CURRENT AND FUTURE END USER ANALYSIS, 2025–2034, (USD MILLION)
FIGURE 92 REST OF EAST ASIA AND PACIFIC ONLINE DATING CURRENT AND FUTURE TYPE ANALYSIS, 2025–2034, (USD MILLION)
FIGURE 93 REST OF EAST ASIA AND PACIFIC ONLINE DATING CURRENT AND FUTURE END USER ANALYSIS, 2025–2034, (USD MILLION)
FIGURE 94 SEA AND SOUTH ASIA ONLINE DATING CURRENT AND FUTURE MARKET VOLUME SHARE REGIONAL ANALYSIS, 2025–2034, (USD MILLION)
FIGURE 95 BANGLADESH ONLINE DATING CURRENT AND FUTURE TYPE ANALYSIS, 2025–2034, (USD MILLION)
FIGURE 96 BANGLADESH ONLINE DATING CURRENT AND FUTURE END USER ANALYSIS, 2025–2034, (USD MILLION)
FIGURE 97 NEW ZEALAND ONLINE DATING CURRENT AND FUTURE TYPE ANALYSIS, 2025–2034, (USD MILLION)
FIGURE 98 NEW ZEALAND ONLINE DATING CURRENT AND FUTURE END USER ANALYSIS, 2025–2034, (USD MILLION)
FIGURE 99 INDIA ONLINE DATING CURRENT AND FUTURE TYPE ANALYSIS, 2025–2034, (USD MILLION)
FIGURE 100 INDIA ONLINE DATING CURRENT AND FUTURE END USER ANALYSIS, 2025–2034, (USD MILLION)
FIGURE 101 SINGAPORE ONLINE DATING CURRENT AND FUTURE TYPE ANALYSIS, 2025–2034, (USD MILLION)
FIGURE 102 SINGAPORE ONLINE DATING CURRENT AND FUTURE END USER ANALYSIS, 2025–2034, (USD MILLION)
FIGURE 103 THAILAND ONLINE DATING CURRENT AND FUTURE TYPE ANALYSIS, 2025–2034, (USD MILLION)
FIGURE 104 THAILAND ONLINE DATING CURRENT AND FUTURE END USER ANALYSIS, 2025–2034, (USD MILLION)
FIGURE 105 TAIWAN ONLINE DATING CURRENT AND FUTURE TYPE ANALYSIS, 2025–2034, (USD MILLION)
FIGURE 106 TAIWAN ONLINE DATING CURRENT AND FUTURE END USER ANALYSIS, 2025–2034, (USD MILLION)
FIGURE 107 MALAYSIA ONLINE DATING CURRENT AND FUTURE TYPE ANALYSIS, 2025–2034, (USD MILLION)
FIGURE 108 MALAYSIA ONLINE DATING CURRENT AND FUTURE END USER ANALYSIS, 2025–2034, (USD MILLION)
FIGURE 109 REST OF SEA AND SOUTH ASIA ONLINE DATING CURRENT AND FUTURE TYPE ANALYSIS, 2025–2034, (USD MILLION)
FIGURE 110 REST OF SEA AND SOUTH ASIA ONLINE DATING CURRENT AND FUTURE END USER ANALYSIS, 2025–2034, (USD MILLION)
FIGURE 111 MIDDLE EAST AND AFRICA ONLINE DATING CURRENT AND FUTURE MARKET VOLUME SHARE REGIONAL ANALYSIS, 2025–2034, (USD MILLION)
FIGURE 112 GCC COUNTRIES ONLINE DATING CURRENT AND FUTURE TYPE ANALYSIS, 2025–2034, (USD MILLION)
FIGURE 113 GCC COUNTRIES ONLINE DATING CURRENT AND FUTURE END USER ANALYSIS, 2025–2034, (USD MILLION)
FIGURE 114 SAUDI ARABIA ONLINE DATING CURRENT AND FUTURE TYPE ANALYSIS, 2025–2034, (USD MILLION)
FIGURE 115 SAUDI ARABIA ONLINE DATING CURRENT AND FUTURE END USER ANALYSIS, 2025–2034, (USD MILLION)
FIGURE 116 UAE ONLINE DATING CURRENT AND FUTURE TYPE ANALYSIS, 2025–2034, (USD MILLION)
FIGURE 117 UAE ONLINE DATING CURRENT AND FUTURE END USER ANALYSIS, 2025–2034, (USD MILLION)
FIGURE 118 BAHRAIN ONLINE DATING CURRENT AND FUTURE TYPE ANALYSIS, 2025–2034, (USD MILLION)
FIGURE 119 BAHRAIN ONLINE DATING CURRENT AND FUTURE END USER ANALYSIS, 2025–2034, (USD MILLION)
FIGURE 120 KUWAIT ONLINE DATING CURRENT AND FUTURE TYPE ANALYSIS, 2025–2034, (USD MILLION)
FIGURE 121 KUWAIT ONLINE DATING CURRENT AND FUTURE END USER ANALYSIS, 2025–2034, (USD MILLION)
FIGURE 122 OMAN ONLINE DATING CURRENT AND FUTURE TYPE ANALYSIS, 2025–2034, (USD MILLION)
FIGURE 123 OMAN ONLINE DATING CURRENT AND FUTURE END USER ANALYSIS, 2025–2034, (USD MILLION)
FIGURE 124 QATAR ONLINE DATING CURRENT AND FUTURE TYPE ANALYSIS, 2025–2034, (USD MILLION)
FIGURE 125 QATAR ONLINE DATING CURRENT AND FUTURE END USER ANALYSIS, 2025–2034, (USD MILLION)
FIGURE 126 EGYPT ONLINE DATING CURRENT AND FUTURE TYPE ANALYSIS, 2025–2034, (USD MILLION)
FIGURE 127 EGYPT ONLINE DATING CURRENT AND FUTURE END USER ANALYSIS, 2025–2034, (USD MILLION)
FIGURE 128 NIGERIA ONLINE DATING CURRENT AND FUTURE TYPE ANALYSIS, 2025–2034, (USD MILLION)
FIGURE 129 NIGERIA ONLINE DATING CURRENT AND FUTURE END USER ANALYSIS, 2025–2034, (USD MILLION)
FIGURE 130 SOUTH AFRICA ONLINE DATING CURRENT AND FUTURE TYPE ANALYSIS, 2025–2034, (USD MILLION)
FIGURE 131 SOUTH AFRICA ONLINE DATING CURRENT AND FUTURE END USER ANALYSIS, 2025–2034, (USD MILLION)
FIGURE 132 ISRAEL ONLINE DATING CURRENT AND FUTURE TYPE ANALYSIS, 2025–2034, (USD MILLION)
FIGURE 133 ISRAEL ONLINE DATING CURRENT AND FUTURE END USER ANALYSIS, 2025–2034, (USD MILLION)
FIGURE 134 REST OF MEA ONLINE DATING CURRENT AND FUTURE TYPE ANALYSIS, 2025–2034, (USD MILLION)
FIGURE 135 REST OF MEA ONLINE DATING CURRENT AND FUTURE END USER ANALYSIS, 2025–2034, (USD MILLION)
FIGURE 136 U. S. MARKET SHARE ANALYSIS BY TYPE (2024)
FIGURE 137 U. S. MARKET SHARE ANALYSIS BY END USER (2024)
FIGURE 138 CANADA MARKET SHARE ANALYSIS BY TYPE (2024)
FIGURE 139 CANADA MARKET SHARE ANALYSIS BY END USER (2024)
FIGURE 140 MEXICO MARKET SHARE ANALYSIS BY TYPE (2024)
FIGURE 141 MEXICO MARKET SHARE ANALYSIS BY END USER (2024)
FIGURE 142 CHINA MARKET SHARE ANALYSIS BY TYPE (2024)
FIGURE 143 CHINA MARKET SHARE ANALYSIS BY END USER (2024)
FIGURE 144 JAPAN MARKET SHARE ANALYSIS BY TYPE (2024)
FIGURE 145 JAPAN MARKET SHARE ANALYSIS BY END USER (2024)
FIGURE 146 INDIA MARKET SHARE ANALYSIS BY TYPE (2024)
FIGURE 147 INDIA MARKET SHARE ANALYSIS BY END USER (2024)
FIGURE 148 SOUTH KOREA MARKET SHARE ANALYSIS BY TYPE (2024)
FIGURE 149 SOUTH KOREA MARKET SHARE ANALYSIS BY END USER (2024)
FIGURE 150 SAUDI ARABIA MARKET SHARE ANALYSIS BY TYPE (2024)
FIGURE 151 SAUDI ARABIA MARKET SHARE ANALYSIS BY END USER (2024)
FIGURE 152 UAE MARKET SHARE ANALYSIS BY TYPE (2024)
FIGURE 153 UAE MARKET SHARE ANALYSIS BY END USER (2024)
FIGURE 154 EGYPT MARKET SHARE ANALYSIS BY TYPE (2024)
FIGURE 155 EGYPT MARKET SHARE ANALYSIS BY END USER (2024)
FIGURE 156 NIGERIA MARKET SHARE ANALYSIS BY TYPE (2024)
FIGURE 157 NIGERIA MARKET SHARE ANALYSIS BY END USER (2024)
FIGURE 158 SOUTH AFRICA MARKET SHARE ANALYSIS BY TYPE (2024)
FIGURE 159 SOUTH AFRICA MARKET SHARE ANALYSIS BY END USER (2024)
FIGURE 160 GERMANY MARKET SHARE ANALYSIS BY TYPE (2024)
FIGURE 161 GERMANY MARKET SHARE ANALYSIS BY END USER (2024)
FIGURE 162 FRANCE MARKET SHARE ANALYSIS BY TYPE (2024)
FIGURE 163 FRANCE MARKET SHARE ANALYSIS BY END USER (2024)
FIGURE 164 UK MARKET SHARE ANALYSIS BY TYPE (2024)
FIGURE 165 UK MARKET SHARE ANALYSIS BY END USER (2024)
FIGURE 166 SPAIN MARKET SHARE ANALYSIS BY TYPE (2024)
FIGURE 167 SPAIN MARKET SHARE ANALYSIS BY END USER (2024)
FIGURE 168 ITALY MARKET SHARE ANALYSIS BY TYPE (2024)
FIGURE 169 ITALY MARKET SHARE ANALYSIS BY END USER (2024)
FIGURE 170 BRAZIL MARKET SHARE ANALYSIS BY TYPE (2024)
FIGURE 171 BRAZIL MARKET SHARE ANALYSIS BY END USER (2024)
FIGURE 172 ARGENTINA MARKET SHARE ANALYSIS BY TYPE (2024)
FIGURE 173 ARGENTINA MARKET SHARE ANALYSIS BY END USER (2024)
FIGURE 174 COLUMBIA MARKET SHARE ANALYSIS BY TYPE (2024)
FIGURE 175 COLUMBIA MARKET SHARE ANALYSIS BY END USER (2024)
FIGURE 176 GLOBAL ONLINE DATING CURRENT AND FUTURE MARKET KEY COUNTRY LEVEL ANALYSIS, 2024–2034, (USD MILLION)
FIGURE 177 FINANCIAL OVERVIEW:
Key Player Analysis
Tinder: Tinder remains a market leader by reach and monetization. The app reports roughly 60–75 million monthly active users and near 9–10 million paying subscribers in 2025, supporting annual revenue near USD 1.9–2.0 billion; these scale metrics sustain high ARPU and advertiser interest. Tinder focuses on product-level retention and youth-centric features. The company pushes short-form video, in-app events, and AI-driven recommendations to lift session time and conversion; you should expect continued investment in personalization and verification to protect market share.
Happn: Happn positions itself as a location-based challenger with strong traction in dense urban markets. The platform reports user counts in the triple-digit millions and benefits from live-location matching that suits city commuters; this product-market fit creates higher local match rates in core metros. Happn differentiates on proximity-driven discovery and contextual prompts; it also tests video and safety tools to raise conversion. If you target city-first users, happn’s model can reduce CAC by improving first-contact relevance.
Match Group: Match Group serves as the market consolidator and portfolio leader. The parent company generates multi-billion dollar annual revenue and houses flagship properties such as Tinder, Hinge, and Match; its scale delivers roughly USD 3.4–3.5 billion in LTM revenue and a concentrated share of global dating app income. Strategically, Match Group is trimming costs while accelerating AI and trust investments; recent workforce adjustments and product overhauls aim to stabilize margins and refresh engagement. You should watch Match’s capital allocation and feature rollouts because they set platform benchmarks and raise barriers for mid-size competitors.
Zoosk: Zoosk operates as a niche challenger with behavioral-match technology and legacy scale in several non-English markets. Acquired by Spark Networks in 2019, Zoosk retains a sizeable user base and competes on behavioral signals rather than pure swipe mechanics; this approach supports differentiated match quality for older demographics. The company’s strategic focus is on product modernization and regional monetization; you should evaluate Zoosk for targeted portfolio plays where lower CAC and higher retention among certain cohorts improve LTV.
As of 2025, mobile-first behavior and growing social acceptance boost strong growth in the global online dating services market. The industry reached USD 5.64 billion in 2025 and is expected to grow at an 8.0% CAGR through 2034, driven by the popularity of app-based interactions. Mobile platforms now represent most new signups, user sessions, and premium conversions, with push notifications, swipe features, and real-time messaging enhancing user engagement. Younger users, especially those under 35, are the largest contributors to revenue. They show a greater willingness to subscribe and spend on premium matchmaking features. This demographic focus improves monetization potential, particularly for apps that use social-driven discovery models.
Product Experience and Engagement Tools Driving Monetization
For operators, the shift toward app usage requires ongoing investment in improving user experience and engagement options. Improvements in onboarding design, short video introductions, and gamified features directly relate to better retention and average revenue per user (ARPU). Product analytics show that better UX flows reduce signup abandonment, while personalized push campaigns boost conversions significantly. As mobile ecosystems grow, standing out from competitors increasingly depends on how smoothly platforms enable discovery, interaction, and communication after matches. This mobile-first trend secures app-based dating as the main driver of long-term industry growth.
Restraint
Privacy Risks and Regulatory Burdens Restrict Adoption
Data privacy issues continue to limit adoption and create operational hurdles across different regions. Online dating platforms manage sensitive personal, behavioral, and biometric data, making them frequent targets for regulatory scrutiny and user doubts. Compliance with EU GDPR, the Digital Services Act, and APAC data residency rules has raised costs by mid-single-digit percentages for operators that work across borders. High-profile data breaches, misinformation efforts, and AI-generated fake identities damage user trust and lead to churn spikes of several percentage points after security events. These trust gaps hinder growth by compelling platforms to balance accessibility and strict oversight.
Rising Operational Costs Compressing Margins
To address privacy and safety issues, platforms must invest heavily in identity verification, behavior moderation, fraud detection, and legal frameworks. This includes biometric authentication, real-time content screening, and machine-learning models designed to spot harmful interactions. These capabilities require specialized teams and raise operational expenses, limiting short-term free cash flow. Customer acquisition costs (CAC) also increase as reputational risks grow since brands must invest more in marketing to restore trust and attract new users. The combined impact of regulatory pressure and rising service costs restricts profitability, especially for smaller or newer markets.
Older adult adoption presents one of the best growth opportunities for the sector. In the U.S., about 13% of online dating users are 65 or older. This demographic values clear communication, safety guarantees, and simple interfaces. Platforms that offer tailored onboarding, human support, and curated introductions see stronger interest and longer retention among senior users. This group also has a higher lifetime value (LTV) because of lower churn rates and a greater willingness to pay for enhanced security or personalized matching options. Targeting this demographic requires careful product design and focused messaging, but it offers significant potential for recurring revenue.
Emerging Markets Driving User-Base Expansion
India and Southeast Asia are the fastest-growing regions, supported by mobile-first habits, increased internet access, and changing attitudes toward digital relationships. India alone is projected to reach about 29.2 million dating-app users by 2029, allowing for a regional CAGR of nearly 10% if subscription rates improve. These emerging markets have lower acquisition costs, larger young populations, and strong engagement with video content. Companies that localize pricing, incorporate regional language support, and adjust matching algorithms to fit cultural preferences can gain millions of new users each year. This positions APAC as a key area for strategic growth.
Trend
AI-Driven Matching and Moderation Transforming Product Direction
AI is changing the competitive landscape with improved matching, dynamic ranking algorithms, and better safety systems. Machine learning models refine recommendations based on user behavior, preferences, and subtle cues, minimizing irrelevant matches and speeding up the time to create meaningful connections. AI-driven moderation can now identify toxic behavior, impersonation, or harassment more accurately, reducing false positives by about five percentage points in trial runs. These improvements enhance platform credibility and safety, which are crucial for boosting retention.
Video-First Interaction and Verification Becoming Standard Features
Video-based features now account for over 40% of active sessions in many APAC markets, indicating a shift toward more authentic dating experiences. Leading platforms like Match Group, Bumble, and Hinge are increasingly integrating native video, live introductions, and biometric ID checks to build match confidence and lower catfishing risks. Real-time verification, selfie-based authentication, and short video prompts are becoming expected features among users. As digital intimacy becomes more engaging, platforms are investing in identity verification, age checks, and behavior scoring to foster trust. These advancements will continue to influence how platforms differentiate and organize subscription tiers in the coming years.
Recent Developments
Dec 2024 – Match Group: Match Group held its first Investor Day and announced a quarterly dividend of USD 0.19 per share plus a USD 1.5 billion share buyback authorization. This formal return-of-capital program signals management confidence in cash flow and tightens the capital structure to support M&A or AI investments.
Feb 2025 – Match Group: The company reported full-year results and emphasized AI-driven personalization as a central product priority while confirming execution of its Investor Day plan. You should view this as a shift from pure top-line growth toward margin improvement and feature-led monetization that aims to raise ARPU across brands.
Apr 2025 – Tinder (Match Group): Tinder released an AI-driven interactive chat experience as part of product experiments to increase engagement and shorten time-to-conversion. The move illustrates how major apps deploy generative and conversational AI to boost session length and trial-to-paid conversion among younger users.
Jul 2025 – Hinge: Hinge rolled out a targeted product and communications push focused on improving match follow-through and relationship outcomes; the campaign included research-backed guidance and new UX nudges to raise reply and meet-up rates. This initiative highlights Hinge’s strategic pivot toward relationship quality metrics as a point of differentiation versus swipe-first competitors.
Sep 2025 – Grindr: At a major investor conference, Grindr presented plans to broaden its positioning from a dating app toward a social network for LGBTQ+ users while outlining financial targets and growth priorities. The disclosure signals a strategic reorientation that could expand monetization channels and increase time spent per user if execution sustains engagement gains.