Optical Coherence Tomography Market Size & Growth Outlook 2034
Global Optical Coherence Tomography Market Size, Share & Growth Analysis By Technology (Time-Domain OCT, Spectral-Domain OCT, Swept-Source OCT), By Application (Ophthalmology, Cardiology, Oncology, Dermatology, Dentistry), By End User (Hospitals, Diagnostic Centers, Research Institutes), By Region & Key Players – Industry Trends, Clinical Advancements, AI Integration, Competitive Landscape & Forecast 2025–2034
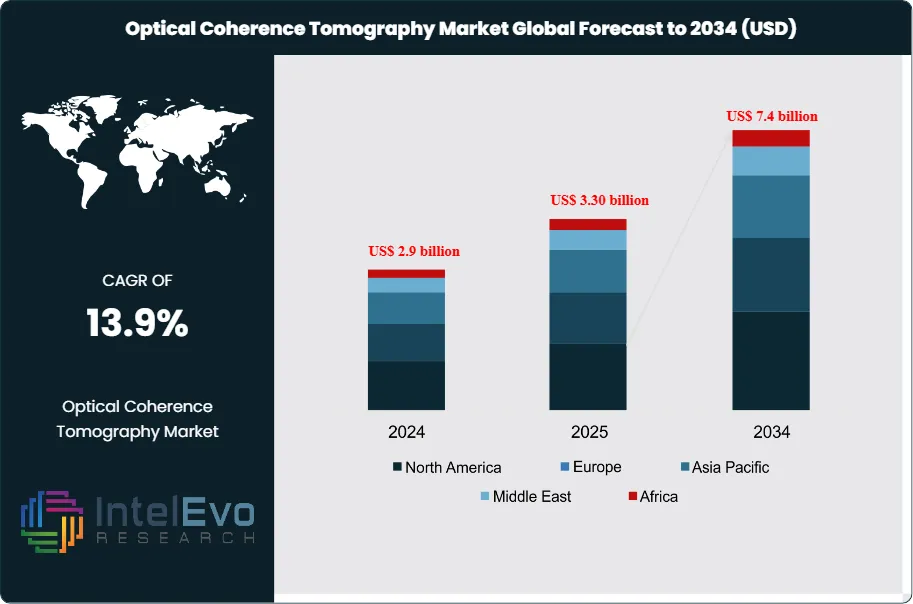
The Optical Coherence Tomography market is estimated at US$ 2.9 billion in 2024 and is on track to reach roughly US$ 7.4 billion by 2034, implying a compound annual growth rate of 13.9% over 2025–2034. This robust growth is driven by rising adoption of OCT in ophthalmology, cardiology, and oncology diagnostics, where high-resolution, non-invasive imaging is critical for early disease detection. Technological advancements such as swept-source OCT, AI-enabled image analysis, and portable OCT systems are further expanding clinical applications. In parallel, increasing investments in eye care infrastructure and growing screening programs across emerging markets are strengthening long-term market momentum and visibility.
Market growth reflects rising retinal disease prevalence and the shift toward high-resolution imaging as a core diagnostic standard in ophthalmology. Providers rely on spectral-domain and swept-source systems that deliver micron-level visualization of retinal layers and choroidal structures, which strengthens clinical decision accuracy in diabetic retinopathy, glaucoma, and age-related macular degeneration. Expanded use in anterior segment evaluation during cataract procedures also supports steady demand across surgical centers. Adoption rates in advanced markets such as North America and Western Europe exceed 60 percent in large ophthalmology networks, while Asia Pacific shows the fastest trajectory with double-digit annual installation growth.
Government programs shape broader access. Public funding directed toward portable platforms reduces cost barriers and supports primary care integration. The ARPA-H US$ 20 million program announced in February 2024 reinforces this direction by promoting affordable handheld systems intended for early-stage disease detection in community settings. These initiatives strengthen preventive screening and expand the addressable market in regions with constrained specialist capacity.
Technology advances reinforce supply-side momentum. Engineering teams transition from benchtop consoles to chip-based engines that shrink optical assemblies without reducing image fidelity. Photonic integrated circuits enable lightweight units suited for neurology, dermatology, cardiology, and dentistry. This shift opens new revenue streams as specialty clinics adopt OCT for optic neuritis evaluation, skin lesion depth mapping, intravascular plaque assessment, and periodontal visualization. Investment activity underscores this trend. Siloton secured US$ 1.06 million in October 2024 to advance its Akepa chip for AMD management, reflecting broader movement toward compact, consumer-ready systems and remote monitoring pathways. AI-driven segmentation and automated grading further improve workflow efficiency and support higher throughput in high-volume practices.
Industry consolidation among clinical research organizations strengthens evidence generation. Mergers expand access to quantitative OCT endpoints used in oncology, refractive surgery, and neurodegenerative disease research. The May 2024 merger of Palleos Healthcare GmbH and OCT Global SA created an oncology-focused CRO with integrated imaging expertise, accelerating trial design and regulatory alignment. This consolidation improves validation standards and supports faster acceptance of OCT-derived metrics in pharmaceutical development.
These forces together position the OCT market for sustained expansion as diagnostic precision, miniaturization, and digitally supported care models advance across regions.
Key Takeaways
Market Growth: The market reached US$ 2.9 billion in 2024 and posts a CAGR of 13.9 percent through 2034. Growth reflects rising demand for high-resolution imaging in retinal disease management and broader clinical use cases.
Product Type: Tabletop systems held 52.8 percent of global revenue in 2024. Providers choose these platforms for stable optics and higher throughput in ophthalmology clinics.
Technology: Spectral domain OCT accounted for 54.3 percent of the market. Faster acquisition speeds and sharper axial resolution support its use in diabetic retinopathy grading and glaucoma monitoring.
Application: Ophthalmology controlled 61.9 percent of revenue in 2024. Strong uptake links to rising cases of AMD and diabetic retinal disease and the need for precise structural mapping.
End User: Hospitals generated 47.2 percent of demand. Large patient volumes and higher budgets support wider adoption of advanced imaging units.
Driver: Portable and chip-based platforms expand access beyond specialist centers. Funding such as ARPA-H’s US$ 20 million program accelerates early detection models in primary care settings.
Restraint: High system prices and service contracts slow adoption in small clinics; acquisition costs often exceed US$ 60,000 per unit and raise replacement cycle timelines.
Opportunity: Handheld and catheter-based systems gain traction in cardiology and dermatology. These segments post projected double-digit CAGR and add new clinical revenue streams for manufacturers.
Trend: Photonic integrated circuits support lighter devices and remote screening. Recent investment, including Siloton’s US$ 1.06 million funding round for AMD-focused chips, signals rapid progress toward compact home-monitoring units.
Regional Analysis: North America held 37.2 percent of the market in 2024 due to strong reimbursement and early technology adoption. Asia Pacific records the fastest rise with projected CAGR above 14 percent as screening programs expand in China and India.
Product Type Analysis
Tabletop systems hold the strongest position in the product mix as they account for 52.8 percent of global revenue and continue to anchor clinical workflows in 2025. Providers rely on these units for consistent performance and high-resolution imaging, which supports accurate assessment of retinal layers, macular structure, and corneal integrity. Rising cases of AMD and diabetic retinopathy across Europe and Asia strengthen demand for stable diagnostic platforms that maintain image quality during high-volume screening.
Manufacturers expand the capabilities of tabletop systems through AI-assisted segmentation and automated quality control. Hospitals and research institutions use these platforms for longitudinal studies and multi-center trials that require reproducible imaging results. Integration with fundus photography and angiography streamlines diagnostics and shortens appointment times. As imaging departments upgrade infrastructure, tabletop OCT remains the preferred choice for detailed visualization and long-term disease tracking.
Handheld, Doppler, and catheter-based systems gain traction in specialized settings as clinicians seek portable units for bedside assessments or intravascular procedures. These formats advance adoption in cardiology, oncology, and dermatology, though they remain secondary in overall revenue contribution. Continued investment in compact optical engines supports wider use in community clinics and emergency departments.
Technology Analysis
Spectral domain OCT maintains the largest share at 54.3 percent and continues to lead in 2025 due to strong axial resolution and rapid scanning. Clinicians rely on this platform for early detection of microstructural changes in glaucoma, diabetic eye disease, and macular degeneration. The ongoing shift away from time-domain systems reflects the industry’s preference for higher fidelity imaging that supports precise monitoring.
Spectral domain systems extend into oncology, cardiology, and dermatology as improvements in detectors and light sources enhance penetration depth and contrast. Software integration with EMR platforms accelerates reporting and reduces administrative time. Swept-source OCT also gains momentum due to superior performance in deep choroidal imaging, which strengthens adoption in tertiary eye centers and research hospitals. These advances reinforce the position of spectral and swept-source systems as core technologies across multiple specialties.
Application Analysis
Ophthalmology remains the primary application area and accounts for 61.9 percent of global revenue. Rising screening volumes for glaucoma, macular edema, and diabetic eye disease support steady expansion in 2025. OCT functions as a standard imaging tool in retinal clinics due to its ability to reveal subtle structural changes that guide targeted therapy. Aging populations in North America, Europe, China, and Japan drive sustained use across hospital and outpatient settings.
Advanced features such as swept-source angiography and adaptive optics extend the scope of vascular imaging and support earlier disease detection. AI-enabled assessments accelerate workflow and improve consistency across large patient cohorts. Oncology, cardiology, and dermatology report rising use of OCT as clinicians adopt the technology for tumor margin analysis, intravascular plaque characterization, and skin lesion depth evaluation. These secondary segments strengthen overall market diversity and create additional revenue opportunities.
End-Use Analysis
Hospitals hold 47.2 percent of end-use revenue due to their broad diagnostic portfolios and ability to invest in advanced imaging platforms. Multispecialty centers integrate OCT across ophthalmology, neurology, dermatology, and cardiology units to support full-spectrum diagnostics. Rising cataract surgery volumes and diabetic eye disease cases reinforce demand for precise imaging tools that enhance clinical decision accuracy.
Intraoperative OCT gains momentum in neurosurgery and oncology as surgeons adopt real-time structural guidance for margin evaluation. Diagnostic imaging centers and ambulatory surgical centers expand adoption as portable and hybrid systems reduce installation barriers. Investments in digital infrastructure across Europe and Asia Pacific accelerate connectivity between OCT systems and centralized reporting hubs. These improvements strengthen efficiency and support wider use of OCT in collaborative care models.
Regional Analysis
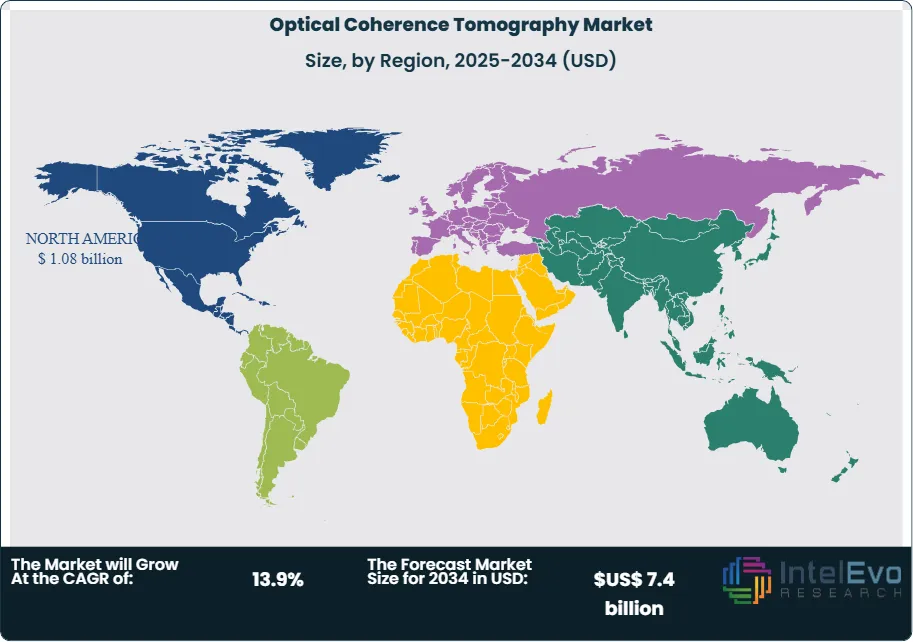
North America maintains a 37.2 percent share and continues to lead usage in 2025 due to high demand for non-invasive imaging and strong clinical adoption in ophthalmology and cardiology. Manufacturers such as Carl Zeiss Meditec and Leica Microsystems expand their portfolios with swept-source systems that enhance visualization of choroidal structures. Research agencies support multi-modal integration programs and community screening initiatives. Health systems in major cities deploy portable units for emergency assessments, while AI-supported analysis tools improve triage and support telemedicine across rural areas.
Europe reports steady growth driven by reimbursement support for retinal imaging and increased investment in OCT-based neurological and oncology research. Regulatory pathways encourage earlier adoption of advanced probes and software modules. Asia Pacific records the fastest rise as governments scale diabetic retinopathy screening and expand imaging access in secondary cities. China and Japan invest heavily in hospital-grade systems, while India adopts handheld formats for rural outreach. Local manufacturing clusters in Vietnam and Thailand reduce component costs and expand regional supply capacity. These trends position Asia Pacific as the strongest growth engine during the forecast period.
By Product Type, (Tabletop, Handheld, Doppler, Catheter based), By Technology, (Spectral domain OCT, Time domain OCT, Swept-source OCT), By Application, (Ophthalmology, Oncology, Dermatology, Cardiology, Others), By End Use, (Hospitals, Ambulatory surgical centers, Diagnostic imaging centers, Others)
Research Methodology
Primary Research- 100 Interviews of Stakeholders
Secondary Research
Desk Research
Regional scope
North America (United States, Canada, Mexico)
Latin America (Brazil, Argentina, Columbia)
East Asia And Pacific (China, Japan, South Korea, Australia, Cambodia, Fiji, Indonesia)
Sea And South Asia (India, Singapore, Thailand, Taiwan, Malaysia)
Eastern Europe (Poland, Russia, Czech Republic, Romania)
Western Europe (Germany, U.K., France, Spain, Itlay)
Middle East & Africa (GCC Countries, Egypt, Nigeria, South Africa, Israel)
Competitive Landscape
Agfa-Gevaert, NIDEK, OPTOPOL Technology, Abbott Laboratories, Canon Medical Systems, Heidelberg Engineering, Michelson Diagnostics, Carl Zeiss Meditec, Danaher, Novacam Technologies
Customization Scope
Customization for segments, region/country-level will be provided. Moreover, additional customization can be done based on the requirements.
Pricing and Purchase Options
Avail customized purchase options to meet your exact research needs. We have three licenses to opt for: Single User License, Multi-User License (Up to 5 Users), Corporate Use License (Unlimited User and Printable PDF).
TABLE OF CONTENTS
1. EXECUTIVE SUMMARY
1.1. MARKET SNAPSHOT
1.2. KEY FINDINGS & INSIGHTS
1.3. ANALYST RECOMMENDATIONS
1.4. FUTURE OUTLOOK
2. RESEARCH METHODOLOGY
2.1. MARKET DEFINITION & SCOPE
2.2. RESEARCH OBJECTIVES: PRIMARY & SECONDARY DATA SOURCES
2.3. DATA COLLECTION SOURCES
2.3.1. COVERAGE OF 100+ PRIMARY RESEARCH/CONSULTATION CALLS WITH INDUSTRY STAKEHOLDERS
FIGURE 17 NORTH AMERICA OPTICAL COHERENCE TOMOGRAPHY CURRENT AND FUTURE TYPE ANALYSIS, 2025–2034, (USD MILLION)
FIGURE 18 NORTH AMERICA OPTICAL COHERENCE TOMOGRAPHY CURRENT AND FUTURE END USER ANALYSIS, 2025–2034, (USD MILLION)
FIGURE 19 MARKET SHARE BY COUNTRY
FIGURE 20 LATIN AMERICA OPTICAL COHERENCE TOMOGRAPHY CURRENT AND FUTURE TYPE ANALYSIS, 2025–2034, (USD MILLION)
FIGURE 21 LATIN AMERICA OPTICAL COHERENCE TOMOGRAPHY CURRENT AND FUTURE END USER ANALYSIS, 2025–2034, (USD MILLION)
FIGURE 22 MARKET SHARE BY COUNTRY
FIGURE 23 EASTERN EUROPE OPTICAL COHERENCE TOMOGRAPHY CURRENT AND FUTURE TYPE ANALYSIS, 2025–2034, (USD MILLION)
FIGURE 24 EASTERN EUROPE OPTICAL COHERENCE TOMOGRAPHY CURRENT AND FUTURE END USER ANALYSIS, 2025–2034, (USD MILLION)
FIGURE 25 MARKET SHARE BY COUNTRY
FIGURE 26 WESTERN EUROPE OPTICAL COHERENCE TOMOGRAPHY CURRENT AND FUTURE TYPE ANALYSIS, 2025–2034, (USD MILLION)
FIGURE 27 WESTERN EUROPE OPTICAL COHERENCE TOMOGRAPHY CURRENT AND FUTURE END USER ANALYSIS, 2025–2034, (USD MILLION)
FIGURE 28 MARKET SHARE BY COUNTRY
FIGURE 29 EAST ASIA AND PACIFIC OPTICAL COHERENCE TOMOGRAPHY CURRENT AND FUTURE TYPE ANALYSIS, 2025–2034, (USD MILLION)
FIGURE 30 EAST ASIA AND PACIFIC OPTICAL COHERENCE TOMOGRAPHY CURRENT AND FUTURE END USER ANALYSIS, 2025–2034, (USD MILLION)
FIGURE 31 MARKET SHARE BY COUNTRY
FIGURE 32 SEA AND SOUTH ASIA OPTICAL COHERENCE TOMOGRAPHY CURRENT AND FUTURE TYPE ANALYSIS, 2025–2034, (USD MILLION)
FIGURE 33 SEA AND SOUTH ASIA OPTICAL COHERENCE TOMOGRAPHY CURRENT AND FUTURE END USER ANALYSIS, 2025–2034, (USD MILLION)
FIGURE 34 MARKET SHARE BY COUNTRY
FIGURE 35 MIDDLE EAST AND AFRICA OPTICAL COHERENCE TOMOGRAPHY CURRENT AND FUTURE TYPE ANALYSIS, 2025–2034, (USD MILLION)
FIGURE 36 MIDDLE EAST AND AFRICA OPTICAL COHERENCE TOMOGRAPHY CURRENT AND FUTURE END USER ANALYSIS, 2025–2034, (USD MILLION)
FIGURE 37 NORTH AMERICA OPTICAL COHERENCE TOMOGRAPHY CURRENT AND FUTURE MARKET VOLUME SHARE REGIONAL ANALYSIS, 2025–2034, (USD MILLION)
FIGURE 38 U.S. OPTICAL COHERENCE TOMOGRAPHY CURRENT AND FUTURE TYPE ANALYSIS, 2025–2034, (USD MILLION)
FIGURE 39 U.S. OPTICAL COHERENCE TOMOGRAPHY CURRENT AND FUTURE END USER ANALYSIS, 2025–2034, (USD MILLION)
FIGURE 40 CANADA OPTICAL COHERENCE TOMOGRAPHY CURRENT AND FUTURE TYPE ANALYSIS, 2025–2034, (USD MILLION)
FIGURE 41 CANADA OPTICAL COHERENCE TOMOGRAPHY CURRENT AND FUTURE END USER ANALYSIS, 2025–2034, (USD MILLION)
FIGURE 42 LATIN AMERICA OPTICAL COHERENCE TOMOGRAPHY CURRENT AND FUTURE MARKET VOLUME SHARE REGIONAL ANALYSIS, 2025–2034, (USD MILLION)
FIGURE 43 MEXICO OPTICAL COHERENCE TOMOGRAPHY CURRENT AND FUTURE TYPE ANALYSIS, 2025–2034, (USD MILLION)
FIGURE 44 MEXICO OPTICAL COHERENCE TOMOGRAPHY CURRENT AND FUTURE END USER ANALYSIS, 2025–2034, (USD MILLION)
FIGURE 45 BRAZIL OPTICAL COHERENCE TOMOGRAPHY CURRENT AND FUTURE TYPE ANALYSIS, 2025–2034, (USD MILLION)
FIGURE 46 BRAZIL OPTICAL COHERENCE TOMOGRAPHY CURRENT AND FUTURE END USER ANALYSIS, 2025–2034, (USD MILLION)
FIGURE 47 ARGENTINA OPTICAL COHERENCE TOMOGRAPHY CURRENT AND FUTURE TYPE ANALYSIS, 2025–2034, (USD MILLION)
FIGURE 48 ARGENTINA OPTICAL COHERENCE TOMOGRAPHY CURRENT AND FUTURE END USER ANALYSIS, 2025–2034, (USD MILLION)
FIGURE 49 COLUMBIA OPTICAL COHERENCE TOMOGRAPHY CURRENT AND FUTURE TYPE ANALYSIS, 2025–2034, (USD MILLION)
FIGURE 50 COLUMBIA OPTICAL COHERENCE TOMOGRAPHY CURRENT AND FUTURE END USER ANALYSIS, 2025–2034, (USD MILLION)
FIGURE 51 REST OF LATIN AMERICA OPTICAL COHERENCE TOMOGRAPHY CURRENT AND FUTURE TYPE ANALYSIS, 2025–2034, (USD MILLION)
FIGURE 52 REST OF LATIN AMERICA OPTICAL COHERENCE TOMOGRAPHY CURRENT AND FUTURE END USER ANALYSIS, 2025–2034, (USD MILLION)
FIGURE 53 EASTERN EUROPE OPTICAL COHERENCE TOMOGRAPHY CURRENT AND FUTURE MARKET VOLUME SHARE REGIONAL ANALYSIS, 2025–2034, (USD MILLION)
FIGURE 54 POLAND OPTICAL COHERENCE TOMOGRAPHY CURRENT AND FUTURE TYPE ANALYSIS, 2025–2034, (USD MILLION)
FIGURE 55 POLAND OPTICAL COHERENCE TOMOGRAPHY CURRENT AND FUTURE END USER ANALYSIS, 2025–2034, (USD MILLION)
FIGURE 56 RUSSIA OPTICAL COHERENCE TOMOGRAPHY CURRENT AND FUTURE TYPE ANALYSIS, 2025–2034, (USD MILLION)
FIGURE 57 RUSSIA OPTICAL COHERENCE TOMOGRAPHY CURRENT AND FUTURE END USER ANALYSIS, 2025–2034, (USD MILLION)
FIGURE 58 CZECH REPUBLIC OPTICAL COHERENCE TOMOGRAPHY CURRENT AND FUTURE TYPE ANALYSIS, 2025–2034, (USD MILLION)
FIGURE 59 CZECH REPUBLIC OPTICAL COHERENCE TOMOGRAPHY CURRENT AND FUTURE END USER ANALYSIS, 2025–2034, (USD MILLION)
FIGURE 60 ROMANIA OPTICAL COHERENCE TOMOGRAPHY CURRENT AND FUTURE TYPE ANALYSIS, 2025–2034, (USD MILLION)
FIGURE 61 ROMANIA OPTICAL COHERENCE TOMOGRAPHY CURRENT AND FUTURE END USER ANALYSIS, 2025–2034, (USD MILLION)
FIGURE 62 REST OF EASTERN EUROPE OPTICAL COHERENCE TOMOGRAPHY CURRENT AND FUTURE TYPE ANALYSIS, 2025–2034, (USD MILLION)
FIGURE 63 REST OF EASTERN EUROPE OPTICAL COHERENCE TOMOGRAPHY CURRENT AND FUTURE END USER ANALYSIS, 2025–2034, (USD MILLION)
FIGURE 64 WESTERN EUROPE OPTICAL COHERENCE TOMOGRAPHY CURRENT AND FUTURE MARKET VOLUME SHARE REGIONAL ANALYSIS, 2025–2034, (USD MILLION)
FIGURE 65 GERMANY OPTICAL COHERENCE TOMOGRAPHY CURRENT AND FUTURE TYPE ANALYSIS, 2025–2034, (USD MILLION)
FIGURE 66 GERMANY OPTICAL COHERENCE TOMOGRAPHY CURRENT AND FUTURE END USER ANALYSIS, 2025–2034, (USD MILLION)
FIGURE 67 FRANCE OPTICAL COHERENCE TOMOGRAPHY CURRENT AND FUTURE TYPE ANALYSIS, 2025–2034, (USD MILLION)
FIGURE 68 FRANCE OPTICAL COHERENCE TOMOGRAPHY CURRENT AND FUTURE END USER ANALYSIS, 2025–2034, (USD MILLION)
FIGURE 69 UK OPTICAL COHERENCE TOMOGRAPHY CURRENT AND FUTURE TYPE ANALYSIS, 2025–2034, (USD MILLION)
FIGURE 70 UK OPTICAL COHERENCE TOMOGRAPHY CURRENT AND FUTURE END USER ANALYSIS, 2025–2034, (USD MILLION)
FIGURE 71 SPAIN OPTICAL COHERENCE TOMOGRAPHY CURRENT AND FUTURE TYPE ANALYSIS, 2025–2034, (USD MILLION)
FIGURE 72 SPAIN OPTICAL COHERENCE TOMOGRAPHY CURRENT AND FUTURE END USER ANALYSIS, 2025–2034, (USD MILLION)
FIGURE 73 ITALY OPTICAL COHERENCE TOMOGRAPHY CURRENT AND FUTURE TYPE ANALYSIS, 2025–2034, (USD MILLION)
FIGURE 74 ITALY OPTICAL COHERENCE TOMOGRAPHY CURRENT AND FUTURE END USER ANALYSIS, 2025–2034, (USD MILLION)
FIGURE 75 REST OF WESTERN EUROPE OPTICAL COHERENCE TOMOGRAPHY CURRENT AND FUTURE TYPE ANALYSIS, 2025–2034, (USD MILLION)
FIGURE 76 REST OF WESTERN EUROPE OPTICAL COHERENCE TOMOGRAPHY CURRENT AND FUTURE END USER ANALYSIS, 2025–2034, (USD MILLION)
FIGURE 77 EAST ASIA AND PACIFIC OPTICAL COHERENCE TOMOGRAPHY CURRENT AND FUTURE MARKET VOLUME SHARE REGIONAL ANALYSIS, 2025–2034, (USD MILLION)
FIGURE 78 CHINA OPTICAL COHERENCE TOMOGRAPHY CURRENT AND FUTURE TYPE ANALYSIS, 2025–2034, (USD MILLION)
FIGURE 79 CHINA OPTICAL COHERENCE TOMOGRAPHY CURRENT AND FUTURE END USER ANALYSIS, 2025–2034, (USD MILLION)
FIGURE 80 JAPAN OPTICAL COHERENCE TOMOGRAPHY CURRENT AND FUTURE TYPE ANALYSIS, 2025–2034, (USD MILLION)
FIGURE 81 JAPAN OPTICAL COHERENCE TOMOGRAPHY CURRENT AND FUTURE END USER ANALYSIS, 2025–2034, (USD MILLION)
FIGURE 82 AUSTRALIA OPTICAL COHERENCE TOMOGRAPHY CURRENT AND FUTURE TYPE ANALYSIS, 2025–2034, (USD MILLION)
FIGURE 83 AUSTRALIA OPTICAL COHERENCE TOMOGRAPHY CURRENT AND FUTURE END USER ANALYSIS, 2025–2034, (USD MILLION)
FIGURE 84 CAMBODIA OPTICAL COHERENCE TOMOGRAPHY CURRENT AND FUTURE TYPE ANALYSIS, 2025–2034, (USD MILLION)
FIGURE 85 CAMBODIA OPTICAL COHERENCE TOMOGRAPHY CURRENT AND FUTURE END USER ANALYSIS, 2025–2034, (USD MILLION)
FIGURE 86 FIJI OPTICAL COHERENCE TOMOGRAPHY CURRENT AND FUTURE TYPE ANALYSIS, 2025–2034, (USD MILLION)
FIGURE 87 FIJI OPTICAL COHERENCE TOMOGRAPHY CURRENT AND FUTURE END USER ANALYSIS, 2025–2034, (USD MILLION)
FIGURE 88 INDONESIA OPTICAL COHERENCE TOMOGRAPHY CURRENT AND FUTURE TYPE ANALYSIS, 2025–2034, (USD MILLION)
FIGURE 89 INDONESIA OPTICAL COHERENCE TOMOGRAPHY CURRENT AND FUTURE END USER ANALYSIS, 2025–2034, (USD MILLION)
FIGURE 90 SOUTH KOREA OPTICAL COHERENCE TOMOGRAPHY CURRENT AND FUTURE TYPE ANALYSIS, 2025–2034, (USD MILLION)
FIGURE 91 SOUTH KOREA OPTICAL COHERENCE TOMOGRAPHY CURRENT AND FUTURE END USER ANALYSIS, 2025–2034, (USD MILLION)
FIGURE 92 REST OF EAST ASIA AND PACIFIC OPTICAL COHERENCE TOMOGRAPHY CURRENT AND FUTURE TYPE ANALYSIS, 2025–2034, (USD MILLION)
FIGURE 93 REST OF EAST ASIA AND PACIFIC OPTICAL COHERENCE TOMOGRAPHY CURRENT AND FUTURE END USER ANALYSIS, 2025–2034, (USD MILLION)
FIGURE 94 SEA AND SOUTH ASIA OPTICAL COHERENCE TOMOGRAPHY CURRENT AND FUTURE MARKET VOLUME SHARE REGIONAL ANALYSIS, 2025–2034, (USD MILLION)
FIGURE 95 BANGLADESH OPTICAL COHERENCE TOMOGRAPHY CURRENT AND FUTURE TYPE ANALYSIS, 2025–2034, (USD MILLION)
FIGURE 96 BANGLADESH OPTICAL COHERENCE TOMOGRAPHY CURRENT AND FUTURE END USER ANALYSIS, 2025–2034, (USD MILLION)
FIGURE 97 NEW ZEALAND OPTICAL COHERENCE TOMOGRAPHY CURRENT AND FUTURE TYPE ANALYSIS, 2025–2034, (USD MILLION)
FIGURE 98 NEW ZEALAND OPTICAL COHERENCE TOMOGRAPHY CURRENT AND FUTURE END USER ANALYSIS, 2025–2034, (USD MILLION)
FIGURE 99 INDIA OPTICAL COHERENCE TOMOGRAPHY CURRENT AND FUTURE TYPE ANALYSIS, 2025–2034, (USD MILLION)
FIGURE 100 INDIA OPTICAL COHERENCE TOMOGRAPHY CURRENT AND FUTURE END USER ANALYSIS, 2025–2034, (USD MILLION)
FIGURE 101 SINGAPORE OPTICAL COHERENCE TOMOGRAPHY CURRENT AND FUTURE TYPE ANALYSIS, 2025–2034, (USD MILLION)
FIGURE 102 SINGAPORE OPTICAL COHERENCE TOMOGRAPHY CURRENT AND FUTURE END USER ANALYSIS, 2025–2034, (USD MILLION)
FIGURE 103 THAILAND OPTICAL COHERENCE TOMOGRAPHY CURRENT AND FUTURE TYPE ANALYSIS, 2025–2034, (USD MILLION)
FIGURE 104 THAILAND OPTICAL COHERENCE TOMOGRAPHY CURRENT AND FUTURE END USER ANALYSIS, 2025–2034, (USD MILLION)
FIGURE 105 TAIWAN OPTICAL COHERENCE TOMOGRAPHY CURRENT AND FUTURE TYPE ANALYSIS, 2025–2034, (USD MILLION)
FIGURE 106 TAIWAN OPTICAL COHERENCE TOMOGRAPHY CURRENT AND FUTURE END USER ANALYSIS, 2025–2034, (USD MILLION)
FIGURE 107 MALAYSIA OPTICAL COHERENCE TOMOGRAPHY CURRENT AND FUTURE TYPE ANALYSIS, 2025–2034, (USD MILLION)
FIGURE 108 MALAYSIA OPTICAL COHERENCE TOMOGRAPHY CURRENT AND FUTURE END USER ANALYSIS, 2025–2034, (USD MILLION)
FIGURE 109 REST OF SEA AND SOUTH ASIA OPTICAL COHERENCE TOMOGRAPHY CURRENT AND FUTURE TYPE ANALYSIS, 2025–2034, (USD MILLION)
FIGURE 110 REST OF SEA AND SOUTH ASIA OPTICAL COHERENCE TOMOGRAPHY CURRENT AND FUTURE END USER ANALYSIS, 2025–2034, (USD MILLION)
FIGURE 111 MIDDLE EAST AND AFRICA OPTICAL COHERENCE TOMOGRAPHY CURRENT AND FUTURE MARKET VOLUME SHARE REGIONAL ANALYSIS, 2025–2034, (USD MILLION)
FIGURE 112 GCC COUNTRIES OPTICAL COHERENCE TOMOGRAPHY CURRENT AND FUTURE TYPE ANALYSIS, 2025–2034, (USD MILLION)
FIGURE 113 GCC COUNTRIES OPTICAL COHERENCE TOMOGRAPHY CURRENT AND FUTURE END USER ANALYSIS, 2025–2034, (USD MILLION)
FIGURE 114 SAUDI ARABIA OPTICAL COHERENCE TOMOGRAPHY CURRENT AND FUTURE TYPE ANALYSIS, 2025–2034, (USD MILLION)
FIGURE 115 SAUDI ARABIA OPTICAL COHERENCE TOMOGRAPHY CURRENT AND FUTURE END USER ANALYSIS, 2025–2034, (USD MILLION)
FIGURE 116 UAE OPTICAL COHERENCE TOMOGRAPHY CURRENT AND FUTURE TYPE ANALYSIS, 2025–2034, (USD MILLION)
FIGURE 117 UAE OPTICAL COHERENCE TOMOGRAPHY CURRENT AND FUTURE END USER ANALYSIS, 2025–2034, (USD MILLION)
FIGURE 118 BAHRAIN OPTICAL COHERENCE TOMOGRAPHY CURRENT AND FUTURE TYPE ANALYSIS, 2025–2034, (USD MILLION)
FIGURE 119 BAHRAIN OPTICAL COHERENCE TOMOGRAPHY CURRENT AND FUTURE END USER ANALYSIS, 2025–2034, (USD MILLION)
FIGURE 120 KUWAIT OPTICAL COHERENCE TOMOGRAPHY CURRENT AND FUTURE TYPE ANALYSIS, 2025–2034, (USD MILLION)
FIGURE 121 KUWAIT OPTICAL COHERENCE TOMOGRAPHY CURRENT AND FUTURE END USER ANALYSIS, 2025–2034, (USD MILLION)
FIGURE 122 OMAN OPTICAL COHERENCE TOMOGRAPHY CURRENT AND FUTURE TYPE ANALYSIS, 2025–2034, (USD MILLION)
FIGURE 123 OMAN OPTICAL COHERENCE TOMOGRAPHY CURRENT AND FUTURE END USER ANALYSIS, 2025–2034, (USD MILLION)
FIGURE 124 QATAR OPTICAL COHERENCE TOMOGRAPHY CURRENT AND FUTURE TYPE ANALYSIS, 2025–2034, (USD MILLION)
FIGURE 125 QATAR OPTICAL COHERENCE TOMOGRAPHY CURRENT AND FUTURE END USER ANALYSIS, 2025–2034, (USD MILLION)
FIGURE 126 EGYPT OPTICAL COHERENCE TOMOGRAPHY CURRENT AND FUTURE TYPE ANALYSIS, 2025–2034, (USD MILLION)
FIGURE 127 EGYPT OPTICAL COHERENCE TOMOGRAPHY CURRENT AND FUTURE END USER ANALYSIS, 2025–2034, (USD MILLION)
FIGURE 128 NIGERIA OPTICAL COHERENCE TOMOGRAPHY CURRENT AND FUTURE TYPE ANALYSIS, 2025–2034, (USD MILLION)
FIGURE 129 NIGERIA OPTICAL COHERENCE TOMOGRAPHY CURRENT AND FUTURE END USER ANALYSIS, 2025–2034, (USD MILLION)
FIGURE 130 SOUTH AFRICA OPTICAL COHERENCE TOMOGRAPHY CURRENT AND FUTURE TYPE ANALYSIS, 2025–2034, (USD MILLION)
FIGURE 131 SOUTH AFRICA OPTICAL COHERENCE TOMOGRAPHY CURRENT AND FUTURE END USER ANALYSIS, 2025–2034, (USD MILLION)
FIGURE 132 ISRAEL OPTICAL COHERENCE TOMOGRAPHY CURRENT AND FUTURE TYPE ANALYSIS, 2025–2034, (USD MILLION)
FIGURE 133 ISRAEL OPTICAL COHERENCE TOMOGRAPHY CURRENT AND FUTURE END USER ANALYSIS, 2025–2034, (USD MILLION)
FIGURE 134 REST OF MEA OPTICAL COHERENCE TOMOGRAPHY CURRENT AND FUTURE TYPE ANALYSIS, 2025–2034, (USD MILLION)
FIGURE 135 REST OF MEA OPTICAL COHERENCE TOMOGRAPHY CURRENT AND FUTURE END USER ANALYSIS, 2025–2034, (USD MILLION)
FIGURE 136 U. S. MARKET SHARE ANALYSIS BY TYPE (2024)
FIGURE 137 U. S. MARKET SHARE ANALYSIS BY END USER (2024)
FIGURE 138 CANADA MARKET SHARE ANALYSIS BY TYPE (2024)
FIGURE 139 CANADA MARKET SHARE ANALYSIS BY END USER (2024)
FIGURE 140 MEXICO MARKET SHARE ANALYSIS BY TYPE (2024)
FIGURE 141 MEXICO MARKET SHARE ANALYSIS BY END USER (2024)
FIGURE 142 CHINA MARKET SHARE ANALYSIS BY TYPE (2024)
FIGURE 143 CHINA MARKET SHARE ANALYSIS BY END USER (2024)
FIGURE 144 JAPAN MARKET SHARE ANALYSIS BY TYPE (2024)
FIGURE 145 JAPAN MARKET SHARE ANALYSIS BY END USER (2024)
FIGURE 146 INDIA MARKET SHARE ANALYSIS BY TYPE (2024)
FIGURE 147 INDIA MARKET SHARE ANALYSIS BY END USER (2024)
FIGURE 148 SOUTH KOREA MARKET SHARE ANALYSIS BY TYPE (2024)
FIGURE 149 SOUTH KOREA MARKET SHARE ANALYSIS BY END USER (2024)
FIGURE 150 SAUDI ARABIA MARKET SHARE ANALYSIS BY TYPE (2024)
FIGURE 151 SAUDI ARABIA MARKET SHARE ANALYSIS BY END USER (2024)
FIGURE 152 UAE MARKET SHARE ANALYSIS BY TYPE (2024)
FIGURE 153 UAE MARKET SHARE ANALYSIS BY END USER (2024)
FIGURE 154 EGYPT MARKET SHARE ANALYSIS BY TYPE (2024)
FIGURE 155 EGYPT MARKET SHARE ANALYSIS BY END USER (2024)
FIGURE 156 NIGERIA MARKET SHARE ANALYSIS BY TYPE (2024)
FIGURE 157 NIGERIA MARKET SHARE ANALYSIS BY END USER (2024)
FIGURE 158 SOUTH AFRICA MARKET SHARE ANALYSIS BY TYPE (2024)
FIGURE 159 SOUTH AFRICA MARKET SHARE ANALYSIS BY END USER (2024)
FIGURE 160 GERMANY MARKET SHARE ANALYSIS BY TYPE (2024)
FIGURE 161 GERMANY MARKET SHARE ANALYSIS BY END USER (2024)
FIGURE 162 FRANCE MARKET SHARE ANALYSIS BY TYPE (2024)
FIGURE 163 FRANCE MARKET SHARE ANALYSIS BY END USER (2024)
FIGURE 164 UK MARKET SHARE ANALYSIS BY TYPE (2024)
FIGURE 165 UK MARKET SHARE ANALYSIS BY END USER (2024)
FIGURE 166 SPAIN MARKET SHARE ANALYSIS BY TYPE (2024)
FIGURE 167 SPAIN MARKET SHARE ANALYSIS BY END USER (2024)
FIGURE 168 ITALY MARKET SHARE ANALYSIS BY TYPE (2024)
FIGURE 169 ITALY MARKET SHARE ANALYSIS BY END USER (2024)
FIGURE 170 BRAZIL MARKET SHARE ANALYSIS BY TYPE (2024)
FIGURE 171 BRAZIL MARKET SHARE ANALYSIS BY END USER (2024)
FIGURE 172 ARGENTINA MARKET SHARE ANALYSIS BY TYPE (2024)
FIGURE 173 ARGENTINA MARKET SHARE ANALYSIS BY END USER (2024)
FIGURE 174 COLUMBIA MARKET SHARE ANALYSIS BY TYPE (2024)
FIGURE 175 COLUMBIA MARKET SHARE ANALYSIS BY END USER (2024)
FIGURE 176 GLOBAL OPTICAL COHERENCE TOMOGRAPHY CURRENT AND FUTURE MARKET KEY COUNTRY LEVEL ANALYSIS, 2024–2034, (USD MILLION)
FIGURE 177 FINANCIAL OVERVIEW:
Key Player Analysis
OPTOPOL Technology: OPTOPOL Technology positions itself as a leader in ophthalmic OCT systems with a strong footprint in Europe and growing distribution in Asia. Its Revo platform series supports high-throughput clinics with fast scan speeds and automated segmentation tools. The company invests in AI modules that refine layer detection and reduce review time for you and other clinicians managing glaucoma and diabetic eye disease. In 2025, OPTOPOL expands its product line with compact units designed for satellite clinics and mobile screening programs, supporting regions with limited specialist access.
The firm strengthens its position through partnerships with hospital groups in Germany and Poland that validate new imaging algorithms across large patient datasets. OPTOPOL also improves interoperability through smoother integration with electronic health record systems. This strategy broadens its reach in markets where streamlined reporting influences procurement decisions. Revenue growth remains steady as the company captures share from mid-tier competitors seeking reliable but cost-efficient systems.
Novacam Technologies: Novacam Technologies operates as an innovator in high-precision, fiber-based OCT systems tailored to industrial and medical applications. Its Microcam platform addresses complex inspection environments and supports material analysis with micron-level accuracy. The company’s diversification into medical OCT positions it as a niche player with strong engineering capability and appeal among research facilities that require specialized configurations. Demand in 2025 increases for modular probes used in dermatology and tissue characterization studies.
Novacam invests in R&D for swept-source modules that offer deeper penetration and stable performance in both laboratory and clinical settings. Collaborations with universities in Canada and the United States advance imaging protocols for oncology and neurodegenerative research. The company differentiates itself through custom system design and competitive pricing that attracts buyers seeking flexible architectures. These moves expand its relevance within the broader OCT ecosystem and support steady contract growth across research-intensive markets.
NIDEK: NIDEK holds a strong challenger position in the global OCT market supported by an extensive ophthalmic equipment portfolio and broad presence across Asia, North America, and the Middle East. Its RetinaScan series integrates spectral-domain capabilities with automated reporting tools that appeal to high-volume eye centers. In 2025, NIDEK scales its AI-driven diagnostic support platform to help you detect early disease patterns with greater consistency. The company’s reach across both premium and mid-priced segments strengthens adoption in emerging markets where budget constraints matter.
NIDEK pursues expansion through distributor alliances and service network upgrades that shorten maintenance cycles. It also invests in multimodal systems that combine OCT with fundus imaging to streamline workflow. These developments improve its competitive position in markets where integrated imaging influences purchasing decisions. NIDEK’s focus on reliability, service availability, and broad product coverage enables steady share gains as clinics modernize diagnostic infrastructure.
MarketKey Players
Agfa-Gevaert
NIDEK
OPTOPOL Technology
Abbott Laboratories
Canon Medical Systems
Heidelberg Engineering
Michelson Diagnostics
Carl Zeiss Meditec
Danaher
Novacam Technologies
Driver:
Rising Glaucoma Burden Driving Routine OCT Screening
The OCT market enters 2025 with stronger demand as glaucoma prevalence rises across aging populations. Providers rely on OCT to measure structural changes in the retinal nerve fiber layer with precision, which strengthens its role in routine evaluations. Global case counts continue to climb and the financial burden of untreated disease pushes health systems to expand screening programs. These conditions raise procedure volumes in hospitals and outpatient clinics and reinforce the need for spectral-domain platforms that deliver consistent, quantifiable results.
Regulatory Endorsement and Automated Analysis Accelerate Adoption
Regulatory bodies now endorse OCT as a core tool for monitoring glaucoma progression, which encourages wider reimbursement and accelerates procurement cycles. Device makers respond with automated analysis modules that reduce interpretation time in high-volume practices. Universities and specialty centers expand training for optometrists and ophthalmologists, allowing you to integrate OCT earlier in patient pathways. This momentum supports steady market growth and secures OCT’s position as a primary imaging tool for chronic eye disease.
Restraint:
High System Costs Limiting Access in Budget-Constrained Settings
High acquisition and maintenance costs continue to limit access in 2025, particularly for smaller clinics and public facilities. System prices commonly range from US$8,000 to US$70,000 depending on capability, and ongoing expenses for software updates and calibration add further pressure. These costs slow adoption in developing regions and force providers to delay replacement cycles. Variations in reimbursement also create uncertainty, which restricts broader use in preventive care.
Reimbursement Gaps and Legacy Equipment Slowing Penetration
Facilities with limited budgets rely on older imaging tools that lack the precision required for early detection of retinal disease. This constraint widens diagnostic gaps between high-income and low-income settings and affects patient outcomes. Manufacturers evaluate alternative financing structures, but long approval timelines for subsidies continue to challenge access. Without cost reductions, market penetration remains uneven across regions.
Opportunity:
Growing Use of Intravascular OCT in Cardiovascular Interventions
Expansion into cardiovascular care presents a strong growth pathway for 2025. Intravascular OCT provides detailed visualization of vessel walls and stent placement that surpasses conventional angiography. Cardiologists adopt OCT to guide interventions and assess plaque morphology, which strengthens clinical confidence and broadens demand in catheterization labs. Regulatory progress supports this shift. The FDA granted 510(k) clearance to the Gentuity HF-OCT Imaging System in late 2024, signaling wider acceptance of OCT in high-acuity procedures.
Clinical Partnerships and Regulatory Clearances Expanding Applications
Industry alliances with heart institutes and academic centers accelerate training and enable you to integrate OCT into routine interventional workflows. Health systems with large cardiovascular caseloads view OCT as a tool that lowers complication rates and supports better long-term outcomes. These developments create new revenue streams for manufacturers and diversify dependence on ophthalmic applications.
Trend:
Emergence of Home-Based OCT for Remote Retinal Monitoring
Home-based OCT systems emerge as a prominent trend heading into 2025 as providers look for reliable remote monitoring tools for diseases such as neovascular AMD. Portable devices equipped with automated analysis software allow patients to complete scans at home and transmit results to clinicians for review. The FDA’s de novo authorization of Notal Vision’s SCANLY Home OCT system in 2024 establishes a regulatory foundation for broader adoption.
These systems reduce clinic visits and strengthen adherence to treatment plans. Cloud-based platforms support daily monitoring and early detection of fluid changes, which helps you intervene before significant vision loss occurs. Growth in teleophthalmology and remote care models reinforces this shift. As manufacturers refine device usability, home-based OCT gains traction among providers seeking efficient, continuous management for chronic retinal disease.
Recent Developments
Dec 2024 – Carl Zeiss Meditec: Announced a commercial release of an upgraded swept-source OCT platform with enhanced choroidal imaging and AI-based segmentation; initial pricing targets hospital procurement at approximately US$120,000 per unit and projected first-year sales of US$45 million. This product strengthens Zeiss’s premium portfolio and pressures competitors in tertiary centers to match deep-tissue imaging capabilities.
Feb 2025 – Siloton: Closed a Series A extension valued at US$5.0 million to accelerate Akepa photonic chip development for AMD and to scale pilot manufacturing capacity by 40 percent. The capital raise shortens the time to lower-cost, chip-based OCT modules and improves the company’s bargaining position with OEM partners.
Apr 2025 – Notal Vision: Expanded SCANLY commercial deployment into the EU through a partnership with a regional retina clinic network covering 50 sites; early adopters report a 25 percent reduction in in-clinic monitoring visits. Wider roll-out enhances remote monitoring adoption and provides Notal Vision with recurring-device revenue and cloud services income.
Jul 2025 – NIDEK: Secured a distribution and service agreement across India and Southeast Asia valued at an estimated US$12 million over three years; the deal includes local training hubs and a spare-parts logistics center to reduce downtime by up to 30 percent. The partnership accelerates NIDEK’s market share gains in fast-growing APAC markets and improves total-cost-of-ownership for regional buyers.
Sep 2025 – Novacam Technologies: Launched a medical-grade swept-source OCT module and signed pilot contracts with three university hospitals for oncology and dermatology trials; initial contracts total an estimated US$2.5 million in equipment and support fees. The move positions Novacam to capture niche research demand and to offer modular probe architectures for specialty clinical workflows.