Global Partial Discharge Monitoring Systems Market Size, Share, Analysis Report By Type (Temporary Monitoring System, Permanent Monitoring System), Application (Power Cables, Transformers, GIS, Others), Region and Key Players - Industry Segment Overview, Market Dynamics, Competitive Strategies, Trends and Forecast 2025-2034
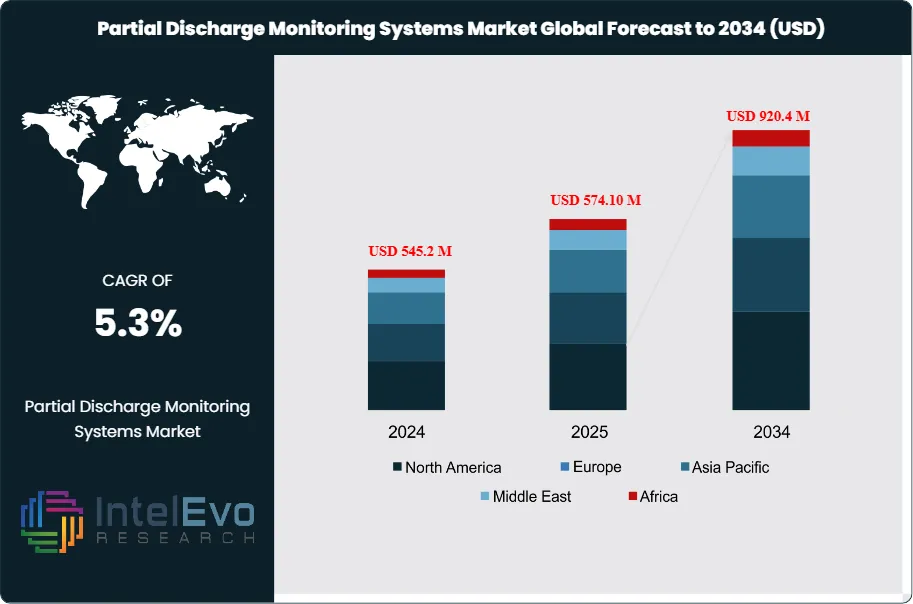
The Partial Discharge Monitoring Systems Market size is projected to reach approximately USD 920.4 million by 2034, up from USD 545.2 million in 2024, growing at a CAGR of 5.3% during the forecast period from 2025 to 2034. The market growth is driven by the increasing need for high-voltage equipment monitoring, predictive maintenance, and power grid reliability. Rising adoption in utilities, industrial, and renewable energy sectors is accelerating demand. Advanced monitoring technologies, coupled with growing awareness about asset lifespan optimization and operational safety, and are expected to fuel market expansion globally.
Partial discharge monitoring systems are essential tools used in high-voltage electrical equipment to detect and assess partial discharges—small, localized electrical sparks that occur within insulation due to defects or stress. While these discharges do not immediately cause equipment failure, they can gradually deteriorate the insulation, potentially leading to significant breakdowns if left unmonitored. These systems utilize various sensors, such as ultrasonic or electromagnetic types, to continuously monitor and collect data on PD activity. The information gathered helps maintenance teams evaluate the severity and location of the issue, enabling timely intervention. Widely used in power plants, substations, and industrial settings, these systems play a crucial role in improving equipment reliability, preventing unexpected failures, and reducing operational downtime by facilitating predictive maintenance strategies.
The growth dynamics of the partial discharge (PD) monitoring systems market are driven by the increasing demand for reliable and uninterrupted power supply across industries. As power infrastructures age and the global energy sector expands—especially with rising renewable energy integration—there is a heightened need to monitor the condition of high-voltage equipment like transformers, switchgear, and cables. Partial discharge monitoring systems are gaining traction because they help detect insulation faults early, thereby preventing costly failures and unplanned outages.
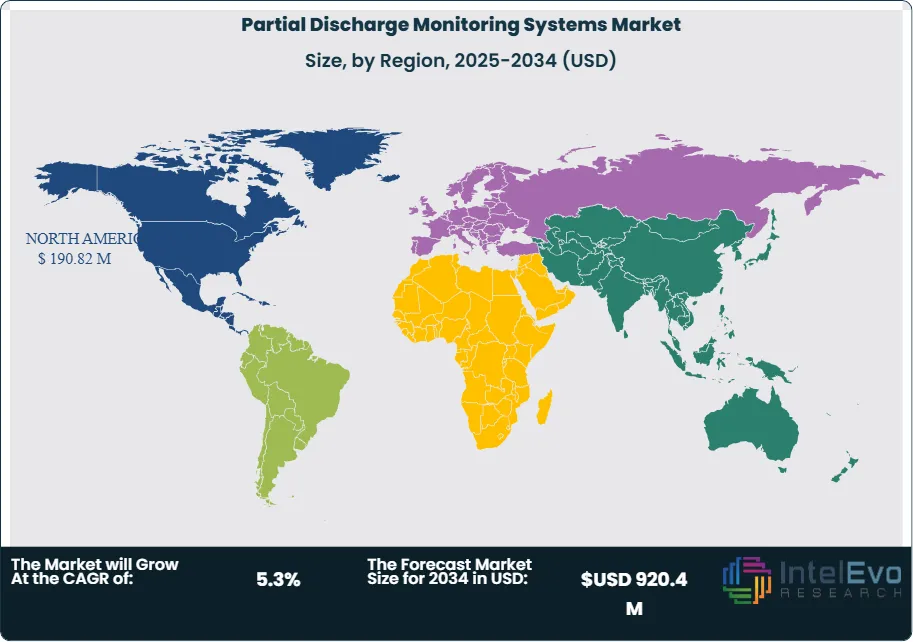
North America’s leadership in the partial discharge (PD) monitoring systems market is largely attributed to its well-established power infrastructure, advanced industrial base, and ongoing emphasis on energy efficiency and system reliability. Industries such as power generation, utilities, aerospace, and manufacturing are actively incorporating PD monitoring to reduce downtime and enhance equipment performance. The aging grid infrastructure in the U.S. and Canada necessitates continuous condition monitoring to avoid unexpected failures, while strict regulations further push the need for such systems.
The COVID-19 pandemic had a mixed impact on the partial discharge monitoring systems (PDMS) market. On one hand, the demand for PDMS systems saw some disruptions due to delayed project timelines, reduced industrial activity, and supply chain challenges during the lockdowns. Many industries faced temporary shutdowns, which delayed the installation and maintenance of power infrastructure. On the other hand, the pandemic also highlighted the importance of reliable and continuous monitoring of critical infrastructure, driving the adoption of PDMS for remote monitoring and predictive maintenance. With the increasing shift toward automation and the need for minimal on-site interventions, the pandemic accelerated the demand for digital and remote monitoring solutions, including PDMS, to ensure uninterrupted operation of energy systems.
Key Takeaways:
Market Growth: The partial discharge monitoring systems market is expected to reach USD 920.4 million by 2034, growing at a robust CAGR of 5.3%, indicating strong market expansion.
Type Segment Dominance: The type segment is dominated by permanent monitoring system, accounting for over 57% of the market share. Permanent monitoring systems are integrated into electrical infrastructure like transformers and cables, offering continuous health assessments. They provide real-time alerts for potential issues, helping operators maintain system reliability and prevent failures.
Application Segment Insights: GIS is anticipated to hold the largest market share. Gas Insulated Switchgear (GIS) plays a crucial role in modern energy networks by efficiently controlling electrical flow with minimal risk of outages. Their popularity in urban and industrial areas, where space is limited and reliability is essential, has driven demand. Partial discharge monitoring enhances GIS performance by detecting early signs of potential failures, ensuring safe and reliable operation, and preventing service interruptions.
Driver: A key driver for the partial discharge monitoring systems market is the rising demand for reliable and uninterrupted power supply. As aging electrical infrastructure and high-voltage equipment require constant monitoring to avoid failures, industries are increasingly investing in these systems to enhance safety, reduce downtime, and support preventive maintenance strategies.
Restraint: A major restraint in the partial discharge monitoring systems market is the high initial investment and installation complexity. These systems often require specialized equipment and technical expertise, making them less accessible for smaller utilities or companies with limited budgets. Additionally, integrating them into existing infrastructure can be challenging, especially in older systems.
Opportunity: A key opportunity in the partial discharge monitoring systems market lies in the growing investments in renewable energy and smart grids. As utilities modernize their infrastructure to support cleaner energy and digital transformation, the demand for reliable, real-time monitoring solutions increases. This creates strong potential for partial discharge systems to be integrated into next-generation power systems to enhance safety, efficiency, and equipment lifespan.
Trend: The integration of AI and machine learning is transforming PD monitoring systems by enhancing their predictive maintenance capabilities. These technologies allow for the analysis of large datasets, helping to predict potential equipment failures, reduce downtime, and improve operational efficiency.
Regional Analysis: Partial discharge monitoring systems detect small electrical faults in high-voltage equipment that can lead to insulation failure. By identifying early signs of wear or damage, these systems help prevent costly breakdowns, improve equipment reliability, and support predictive maintenance in industries like energy, utilities, and aerospace.
Type Analysis:
The type segment is divided into temporary monitoring system and permanent monitoring system. The permanent monitoring system segment dominated the market, with a market share of around 57% accounting for 305.2 million 2024. Permanent monitoring systems are embedded directly into key electrical infrastructure such as transformers, switchgear, and power cables, offering continuous health assessments without requiring manual inspections. This real-time monitoring is vital for maintaining the integrity of critical power systems. By providing immediate alerts for potential problems, these systems enable operators to address issues promptly, reducing the risk of unexpected failures and improving overall system reliability and efficiency.
Application Analysis:
The application segment is divided into power cables, transformers, GIS, and others. The GIS segment dominated the market, with a market share of around 32% accounting for 171.3 million 2024. Gas Insulated Switchgear (GIS) is a critical component in modern electrical grids, offering efficient and reliable control of electrical flow while minimizing the risk of outages. Its compact design and ability to operate in challenging urban and industrial environments, where space is limited and reliability is paramount, have led to its widespread adoption. Partial discharge monitoring systems play an essential role in enhancing GIS performance. These systems detect early signs of insulation degradation or potential failures, enabling preventive maintenance and helping avoid catastrophic breakdowns. By integrating partial discharge monitoring, GIS units can operate more safely and reliably, minimizing service interruptions and extending their operational lifespan, which is especially crucial in critical infrastructure.
Region Analysis:
North America Leads With 35% Market Share in the Partial Discharge Monitoring Systems Market. Partial discharge monitoring systems are used to detect tiny electrical discharges that occur within the insulation of high-voltage equipment, such as transformers, switchgear, and cables. These discharges—called partial discharges—happen when insulation begins to degrade, often due to stress, contamination, or defects. If left unchecked, they can grow over time and eventually cause equipment failure, leading to costly downtime or even dangerous accidents. Partial discharge monitoring systems work by continuously observing electrical signals, ultrasonic noise, or electromagnetic waves emitted during these discharges. By identifying early warning signs, these systems allow engineers and operators to take preventive action before serious damage occurs. This is especially valuable in industries where high-voltage equipment is critical, such as energy, utilities, manufacturing, and aerospace. Ultimately, partial discharge monitoring helps extend equipment life, improve safety, and reduce maintenance costs by shifting from reactive to predictive maintenance strategies.
By Type (Temporary Monitoring System, Permanent Monitoring System), By System Type (Online Partial Discharge , Offline Partial Discharge), By Equipment Type (Transformers, Switchgear, Cables & Terminations, Generators, Rotating Machines), By Application (Power Utilities, Industrial, Renewable Energy, Research & Testing Laboratories), By End User (Electrical Utilities, Industrial Plants, OEMs, Testing & Certification Agencies, Others)
Research Methodology
Primary Research- 100 Interviews of Stakeholders
Secondary Research
Desk Research
Regional scope
North America (United States, Canada, Mexico)
Latin America (Brazil, Argentina, Columbia)
East Asia And Pacific (China, Japan, South Korea, Australia, Cambodia, Fiji, Indonesia)
Sea And South Asia (India, Singapore, Thailand, Taiwan, Malaysia)
Eastern Europe (Poland, Russia, Czech Republic, Romania)
Western Europe (Germany, U.K., France, Spain, Itlay)
Middle East & Africa (GCC Countries, Egypt, Nigeria, South Africa, Israel)
Customization for segments, region/country-level will be provided. Moreover, additional customization can be done based on the requirements.
Pricing and Purchase Options
Avail customized purchase options to meet your exact research needs. We have three licenses to opt for: Single User License, Multi-User License (Up to 5 Users), Corporate Use License (Unlimited User and Printable PDF).
TABLE OF CONTENTS
1. EXECUTIVE SUMMARY
1.1. MARKET SNAPSHOT
1.2. KEY FINDINGS & INSIGHTS
1.3. ANALYST RECOMMENDATIONS
1.4. FUTURE OUTLOOK
2. RESEARCH METHODOLOGY
2.1. MARKET DEFINITION & SCOPE
2.2. RESEARCH OBJECTIVES: PRIMARY & SECONDARY DATA SOURCES
2.3. DATA COLLECTION SOURCES
2.3.1. COVERAGE OF 100+ PRIMARY RESEARCH/CONSULTATION CALLS WITH INDUSTRY STAKEHOLDERS
FIGURE 17 NORTH AMERICA PARTIAL DISCHARGE MONITORING SYSTEMS CURRENT AND FUTURE TYPE ANALYSIS, 2025–2034, (USD MILLION)
FIGURE 18 NORTH AMERICA PARTIAL DISCHARGE MONITORING SYSTEMS CURRENT AND FUTURE END USER ANALYSIS, 2025–2034, (USD MILLION)
FIGURE 19 MARKET SHARE BY COUNTRY
FIGURE 20 LATIN AMERICA PARTIAL DISCHARGE MONITORING SYSTEMS CURRENT AND FUTURE TYPE ANALYSIS, 2025–2034, (USD MILLION)
FIGURE 21 LATIN AMERICA PARTIAL DISCHARGE MONITORING SYSTEMS CURRENT AND FUTURE END USER ANALYSIS, 2025–2034, (USD MILLION)
FIGURE 22 MARKET SHARE BY COUNTRY
FIGURE 23 EASTERN EUROPE PARTIAL DISCHARGE MONITORING SYSTEMS CURRENT AND FUTURE TYPE ANALYSIS, 2025–2034, (USD MILLION)
FIGURE 24 EASTERN EUROPE PARTIAL DISCHARGE MONITORING SYSTEMS CURRENT AND FUTURE END USER ANALYSIS, 2025–2034, (USD MILLION)
FIGURE 25 MARKET SHARE BY COUNTRY
FIGURE 26 WESTERN EUROPE PARTIAL DISCHARGE MONITORING SYSTEMS CURRENT AND FUTURE TYPE ANALYSIS, 2025–2034, (USD MILLION)
FIGURE 27 WESTERN EUROPE PARTIAL DISCHARGE MONITORING SYSTEMS CURRENT AND FUTURE END USER ANALYSIS, 2025–2034, (USD MILLION)
FIGURE 28 MARKET SHARE BY COUNTRY
FIGURE 29 EAST ASIA AND PACIFIC PARTIAL DISCHARGE MONITORING SYSTEMS CURRENT AND FUTURE TYPE ANALYSIS, 2025–2034, (USD MILLION)
FIGURE 30 EAST ASIA AND PACIFIC PARTIAL DISCHARGE MONITORING SYSTEMS CURRENT AND FUTURE END USER ANALYSIS, 2025–2034, (USD MILLION)
FIGURE 31 MARKET SHARE BY COUNTRY
FIGURE 32 SEA AND SOUTH ASIA PARTIAL DISCHARGE MONITORING SYSTEMS CURRENT AND FUTURE TYPE ANALYSIS, 2025–2034, (USD MILLION)
FIGURE 33 SEA AND SOUTH ASIA PARTIAL DISCHARGE MONITORING SYSTEMS CURRENT AND FUTURE END USER ANALYSIS, 2025–2034, (USD MILLION)
FIGURE 34 MARKET SHARE BY COUNTRY
FIGURE 35 MIDDLE EAST AND AFRICA PARTIAL DISCHARGE MONITORING SYSTEMS CURRENT AND FUTURE TYPE ANALYSIS, 2025–2034, (USD MILLION)
FIGURE 36 MIDDLE EAST AND AFRICA PARTIAL DISCHARGE MONITORING SYSTEMS CURRENT AND FUTURE END USER ANALYSIS, 2025–2034, (USD MILLION)
FIGURE 37 NORTH AMERICA PARTIAL DISCHARGE MONITORING SYSTEMS CURRENT AND FUTURE MARKET VOLUME SHARE REGIONAL ANALYSIS, 2025–2034, (USD MILLION)
FIGURE 38 U.S. PARTIAL DISCHARGE MONITORING SYSTEMS CURRENT AND FUTURE TYPE ANALYSIS, 2025–2034, (USD MILLION)
FIGURE 39 U.S. PARTIAL DISCHARGE MONITORING SYSTEMS CURRENT AND FUTURE END USER ANALYSIS, 2025–2034, (USD MILLION)
FIGURE 40 CANADA PARTIAL DISCHARGE MONITORING SYSTEMS CURRENT AND FUTURE TYPE ANALYSIS, 2025–2034, (USD MILLION)
FIGURE 41 CANADA PARTIAL DISCHARGE MONITORING SYSTEMS CURRENT AND FUTURE END USER ANALYSIS, 2025–2034, (USD MILLION)
FIGURE 42 LATIN AMERICA PARTIAL DISCHARGE MONITORING SYSTEMS CURRENT AND FUTURE MARKET VOLUME SHARE REGIONAL ANALYSIS, 2025–2034, (USD MILLION)
FIGURE 43 MEXICO PARTIAL DISCHARGE MONITORING SYSTEMS CURRENT AND FUTURE TYPE ANALYSIS, 2025–2034, (USD MILLION)
FIGURE 44 MEXICO PARTIAL DISCHARGE MONITORING SYSTEMS CURRENT AND FUTURE END USER ANALYSIS, 2025–2034, (USD MILLION)
FIGURE 45 BRAZIL PARTIAL DISCHARGE MONITORING SYSTEMS CURRENT AND FUTURE TYPE ANALYSIS, 2025–2034, (USD MILLION)
FIGURE 46 BRAZIL PARTIAL DISCHARGE MONITORING SYSTEMS CURRENT AND FUTURE END USER ANALYSIS, 2025–2034, (USD MILLION)
FIGURE 47 ARGENTINA PARTIAL DISCHARGE MONITORING SYSTEMS CURRENT AND FUTURE TYPE ANALYSIS, 2025–2034, (USD MILLION)
FIGURE 48 ARGENTINA PARTIAL DISCHARGE MONITORING SYSTEMS CURRENT AND FUTURE END USER ANALYSIS, 2025–2034, (USD MILLION)
FIGURE 49 COLUMBIA PARTIAL DISCHARGE MONITORING SYSTEMS CURRENT AND FUTURE TYPE ANALYSIS, 2025–2034, (USD MILLION)
FIGURE 50 COLUMBIA PARTIAL DISCHARGE MONITORING SYSTEMS CURRENT AND FUTURE END USER ANALYSIS, 2025–2034, (USD MILLION)
FIGURE 51 REST OF LATIN AMERICA PARTIAL DISCHARGE MONITORING SYSTEMS CURRENT AND FUTURE TYPE ANALYSIS, 2025–2034, (USD MILLION)
FIGURE 52 REST OF LATIN AMERICA PARTIAL DISCHARGE MONITORING SYSTEMS CURRENT AND FUTURE END USER ANALYSIS, 2025–2034, (USD MILLION)
FIGURE 53 EASTERN EUROPE PARTIAL DISCHARGE MONITORING SYSTEMS CURRENT AND FUTURE MARKET VOLUME SHARE REGIONAL ANALYSIS, 2025–2034, (USD MILLION)
FIGURE 54 POLAND PARTIAL DISCHARGE MONITORING SYSTEMS CURRENT AND FUTURE TYPE ANALYSIS, 2025–2034, (USD MILLION)
FIGURE 55 POLAND PARTIAL DISCHARGE MONITORING SYSTEMS CURRENT AND FUTURE END USER ANALYSIS, 2025–2034, (USD MILLION)
FIGURE 56 RUSSIA PARTIAL DISCHARGE MONITORING SYSTEMS CURRENT AND FUTURE TYPE ANALYSIS, 2025–2034, (USD MILLION)
FIGURE 57 RUSSIA PARTIAL DISCHARGE MONITORING SYSTEMS CURRENT AND FUTURE END USER ANALYSIS, 2025–2034, (USD MILLION)
FIGURE 58 CZECH REPUBLIC PARTIAL DISCHARGE MONITORING SYSTEMS CURRENT AND FUTURE TYPE ANALYSIS, 2025–2034, (USD MILLION)
FIGURE 59 CZECH REPUBLIC PARTIAL DISCHARGE MONITORING SYSTEMS CURRENT AND FUTURE END USER ANALYSIS, 2025–2034, (USD MILLION)
FIGURE 60 ROMANIA PARTIAL DISCHARGE MONITORING SYSTEMS CURRENT AND FUTURE TYPE ANALYSIS, 2025–2034, (USD MILLION)
FIGURE 61 ROMANIA PARTIAL DISCHARGE MONITORING SYSTEMS CURRENT AND FUTURE END USER ANALYSIS, 2025–2034, (USD MILLION)
FIGURE 62 REST OF EASTERN EUROPE PARTIAL DISCHARGE MONITORING SYSTEMS CURRENT AND FUTURE TYPE ANALYSIS, 2025–2034, (USD MILLION)
FIGURE 63 REST OF EASTERN EUROPE PARTIAL DISCHARGE MONITORING SYSTEMS CURRENT AND FUTURE END USER ANALYSIS, 2025–2034, (USD MILLION)
FIGURE 64 WESTERN EUROPE PARTIAL DISCHARGE MONITORING SYSTEMS CURRENT AND FUTURE MARKET VOLUME SHARE REGIONAL ANALYSIS, 2025–2034, (USD MILLION)
FIGURE 65 GERMANY PARTIAL DISCHARGE MONITORING SYSTEMS CURRENT AND FUTURE TYPE ANALYSIS, 2025–2034, (USD MILLION)
FIGURE 66 GERMANY PARTIAL DISCHARGE MONITORING SYSTEMS CURRENT AND FUTURE END USER ANALYSIS, 2025–2034, (USD MILLION)
FIGURE 67 FRANCE PARTIAL DISCHARGE MONITORING SYSTEMS CURRENT AND FUTURE TYPE ANALYSIS, 2025–2034, (USD MILLION)
FIGURE 68 FRANCE PARTIAL DISCHARGE MONITORING SYSTEMS CURRENT AND FUTURE END USER ANALYSIS, 2025–2034, (USD MILLION)
FIGURE 69 UK PARTIAL DISCHARGE MONITORING SYSTEMS CURRENT AND FUTURE TYPE ANALYSIS, 2025–2034, (USD MILLION)
FIGURE 70 UK PARTIAL DISCHARGE MONITORING SYSTEMS CURRENT AND FUTURE END USER ANALYSIS, 2025–2034, (USD MILLION)
FIGURE 71 SPAIN PARTIAL DISCHARGE MONITORING SYSTEMS CURRENT AND FUTURE TYPE ANALYSIS, 2025–2034, (USD MILLION)
FIGURE 72 SPAIN PARTIAL DISCHARGE MONITORING SYSTEMS CURRENT AND FUTURE END USER ANALYSIS, 2025–2034, (USD MILLION)
FIGURE 73 ITALY PARTIAL DISCHARGE MONITORING SYSTEMS CURRENT AND FUTURE TYPE ANALYSIS, 2025–2034, (USD MILLION)
FIGURE 74 ITALY PARTIAL DISCHARGE MONITORING SYSTEMS CURRENT AND FUTURE END USER ANALYSIS, 2025–2034, (USD MILLION)
FIGURE 75 REST OF WESTERN EUROPE PARTIAL DISCHARGE MONITORING SYSTEMS CURRENT AND FUTURE TYPE ANALYSIS, 2025–2034, (USD MILLION)
FIGURE 76 REST OF WESTERN EUROPE PARTIAL DISCHARGE MONITORING SYSTEMS CURRENT AND FUTURE END USER ANALYSIS, 2025–2034, (USD MILLION)
FIGURE 77 EAST ASIA AND PACIFIC PARTIAL DISCHARGE MONITORING SYSTEMS CURRENT AND FUTURE MARKET VOLUME SHARE REGIONAL ANALYSIS, 2025–2034, (USD MILLION)
FIGURE 78 CHINA PARTIAL DISCHARGE MONITORING SYSTEMS CURRENT AND FUTURE TYPE ANALYSIS, 2025–2034, (USD MILLION)
FIGURE 79 CHINA PARTIAL DISCHARGE MONITORING SYSTEMS CURRENT AND FUTURE END USER ANALYSIS, 2025–2034, (USD MILLION)
FIGURE 80 JAPAN PARTIAL DISCHARGE MONITORING SYSTEMS CURRENT AND FUTURE TYPE ANALYSIS, 2025–2034, (USD MILLION)
FIGURE 81 JAPAN PARTIAL DISCHARGE MONITORING SYSTEMS CURRENT AND FUTURE END USER ANALYSIS, 2025–2034, (USD MILLION)
FIGURE 82 AUSTRALIA PARTIAL DISCHARGE MONITORING SYSTEMS CURRENT AND FUTURE TYPE ANALYSIS, 2025–2034, (USD MILLION)
FIGURE 83 AUSTRALIA PARTIAL DISCHARGE MONITORING SYSTEMS CURRENT AND FUTURE END USER ANALYSIS, 2025–2034, (USD MILLION)
FIGURE 84 CAMBODIA PARTIAL DISCHARGE MONITORING SYSTEMS CURRENT AND FUTURE TYPE ANALYSIS, 2025–2034, (USD MILLION)
FIGURE 85 CAMBODIA PARTIAL DISCHARGE MONITORING SYSTEMS CURRENT AND FUTURE END USER ANALYSIS, 2025–2034, (USD MILLION)
FIGURE 86 FIJI PARTIAL DISCHARGE MONITORING SYSTEMS CURRENT AND FUTURE TYPE ANALYSIS, 2025–2034, (USD MILLION)
FIGURE 87 FIJI PARTIAL DISCHARGE MONITORING SYSTEMS CURRENT AND FUTURE END USER ANALYSIS, 2025–2034, (USD MILLION)
FIGURE 88 INDONESIA PARTIAL DISCHARGE MONITORING SYSTEMS CURRENT AND FUTURE TYPE ANALYSIS, 2025–2034, (USD MILLION)
FIGURE 89 INDONESIA PARTIAL DISCHARGE MONITORING SYSTEMS CURRENT AND FUTURE END USER ANALYSIS, 2025–2034, (USD MILLION)
FIGURE 90 SOUTH KOREA PARTIAL DISCHARGE MONITORING SYSTEMS CURRENT AND FUTURE TYPE ANALYSIS, 2025–2034, (USD MILLION)
FIGURE 91 SOUTH KOREA PARTIAL DISCHARGE MONITORING SYSTEMS CURRENT AND FUTURE END USER ANALYSIS, 2025–2034, (USD MILLION)
FIGURE 92 REST OF EAST ASIA AND PACIFIC PARTIAL DISCHARGE MONITORING SYSTEMS CURRENT AND FUTURE TYPE ANALYSIS, 2025–2034, (USD MILLION)
FIGURE 93 REST OF EAST ASIA AND PACIFIC PARTIAL DISCHARGE MONITORING SYSTEMS CURRENT AND FUTURE END USER ANALYSIS, 2025–2034, (USD MILLION)
FIGURE 94 SEA AND SOUTH ASIA PARTIAL DISCHARGE MONITORING SYSTEMS CURRENT AND FUTURE MARKET VOLUME SHARE REGIONAL ANALYSIS, 2025–2034, (USD MILLION)
FIGURE 95 BANGLADESH PARTIAL DISCHARGE MONITORING SYSTEMS CURRENT AND FUTURE TYPE ANALYSIS, 2025–2034, (USD MILLION)
FIGURE 96 BANGLADESH PARTIAL DISCHARGE MONITORING SYSTEMS CURRENT AND FUTURE END USER ANALYSIS, 2025–2034, (USD MILLION)
FIGURE 97 NEW ZEALAND PARTIAL DISCHARGE MONITORING SYSTEMS CURRENT AND FUTURE TYPE ANALYSIS, 2025–2034, (USD MILLION)
FIGURE 98 NEW ZEALAND PARTIAL DISCHARGE MONITORING SYSTEMS CURRENT AND FUTURE END USER ANALYSIS, 2025–2034, (USD MILLION)
FIGURE 99 INDIA PARTIAL DISCHARGE MONITORING SYSTEMS CURRENT AND FUTURE TYPE ANALYSIS, 2025–2034, (USD MILLION)
FIGURE 100 INDIA PARTIAL DISCHARGE MONITORING SYSTEMS CURRENT AND FUTURE END USER ANALYSIS, 2025–2034, (USD MILLION)
FIGURE 101 SINGAPORE PARTIAL DISCHARGE MONITORING SYSTEMS CURRENT AND FUTURE TYPE ANALYSIS, 2025–2034, (USD MILLION)
FIGURE 102 SINGAPORE PARTIAL DISCHARGE MONITORING SYSTEMS CURRENT AND FUTURE END USER ANALYSIS, 2025–2034, (USD MILLION)
FIGURE 103 THAILAND PARTIAL DISCHARGE MONITORING SYSTEMS CURRENT AND FUTURE TYPE ANALYSIS, 2025–2034, (USD MILLION)
FIGURE 104 THAILAND PARTIAL DISCHARGE MONITORING SYSTEMS CURRENT AND FUTURE END USER ANALYSIS, 2025–2034, (USD MILLION)
FIGURE 105 TAIWAN PARTIAL DISCHARGE MONITORING SYSTEMS CURRENT AND FUTURE TYPE ANALYSIS, 2025–2034, (USD MILLION)
FIGURE 106 TAIWAN PARTIAL DISCHARGE MONITORING SYSTEMS CURRENT AND FUTURE END USER ANALYSIS, 2025–2034, (USD MILLION)
FIGURE 107 MALAYSIA PARTIAL DISCHARGE MONITORING SYSTEMS CURRENT AND FUTURE TYPE ANALYSIS, 2025–2034, (USD MILLION)
FIGURE 108 MALAYSIA PARTIAL DISCHARGE MONITORING SYSTEMS CURRENT AND FUTURE END USER ANALYSIS, 2025–2034, (USD MILLION)
FIGURE 109 REST OF SEA AND SOUTH ASIA PARTIAL DISCHARGE MONITORING SYSTEMS CURRENT AND FUTURE TYPE ANALYSIS, 2025–2034, (USD MILLION)
FIGURE 110 REST OF SEA AND SOUTH ASIA PARTIAL DISCHARGE MONITORING SYSTEMS CURRENT AND FUTURE END USER ANALYSIS, 2025–2034, (USD MILLION)
FIGURE 111 MIDDLE EAST AND AFRICA PARTIAL DISCHARGE MONITORING SYSTEMS CURRENT AND FUTURE MARKET VOLUME SHARE REGIONAL ANALYSIS, 2025–2034, (USD MILLION)
FIGURE 112 GCC COUNTRIES PARTIAL DISCHARGE MONITORING SYSTEMS CURRENT AND FUTURE TYPE ANALYSIS, 2025–2034, (USD MILLION)
FIGURE 113 GCC COUNTRIES PARTIAL DISCHARGE MONITORING SYSTEMS CURRENT AND FUTURE END USER ANALYSIS, 2025–2034, (USD MILLION)
FIGURE 114 SAUDI ARABIA PARTIAL DISCHARGE MONITORING SYSTEMS CURRENT AND FUTURE TYPE ANALYSIS, 2025–2034, (USD MILLION)
FIGURE 115 SAUDI ARABIA PARTIAL DISCHARGE MONITORING SYSTEMS CURRENT AND FUTURE END USER ANALYSIS, 2025–2034, (USD MILLION)
FIGURE 116 UAE PARTIAL DISCHARGE MONITORING SYSTEMS CURRENT AND FUTURE TYPE ANALYSIS, 2025–2034, (USD MILLION)
FIGURE 117 UAE PARTIAL DISCHARGE MONITORING SYSTEMS CURRENT AND FUTURE END USER ANALYSIS, 2025–2034, (USD MILLION)
FIGURE 118 BAHRAIN PARTIAL DISCHARGE MONITORING SYSTEMS CURRENT AND FUTURE TYPE ANALYSIS, 2025–2034, (USD MILLION)
FIGURE 119 BAHRAIN PARTIAL DISCHARGE MONITORING SYSTEMS CURRENT AND FUTURE END USER ANALYSIS, 2025–2034, (USD MILLION)
FIGURE 120 KUWAIT PARTIAL DISCHARGE MONITORING SYSTEMS CURRENT AND FUTURE TYPE ANALYSIS, 2025–2034, (USD MILLION)
FIGURE 121 KUWAIT PARTIAL DISCHARGE MONITORING SYSTEMS CURRENT AND FUTURE END USER ANALYSIS, 2025–2034, (USD MILLION)
FIGURE 122 OMAN PARTIAL DISCHARGE MONITORING SYSTEMS CURRENT AND FUTURE TYPE ANALYSIS, 2025–2034, (USD MILLION)
FIGURE 123 OMAN PARTIAL DISCHARGE MONITORING SYSTEMS CURRENT AND FUTURE END USER ANALYSIS, 2025–2034, (USD MILLION)
FIGURE 124 QATAR PARTIAL DISCHARGE MONITORING SYSTEMS CURRENT AND FUTURE TYPE ANALYSIS, 2025–2034, (USD MILLION)
FIGURE 125 QATAR PARTIAL DISCHARGE MONITORING SYSTEMS CURRENT AND FUTURE END USER ANALYSIS, 2025–2034, (USD MILLION)
FIGURE 126 EGYPT PARTIAL DISCHARGE MONITORING SYSTEMS CURRENT AND FUTURE TYPE ANALYSIS, 2025–2034, (USD MILLION)
FIGURE 127 EGYPT PARTIAL DISCHARGE MONITORING SYSTEMS CURRENT AND FUTURE END USER ANALYSIS, 2025–2034, (USD MILLION)
FIGURE 128 NIGERIA PARTIAL DISCHARGE MONITORING SYSTEMS CURRENT AND FUTURE TYPE ANALYSIS, 2025–2034, (USD MILLION)
FIGURE 129 NIGERIA PARTIAL DISCHARGE MONITORING SYSTEMS CURRENT AND FUTURE END USER ANALYSIS, 2025–2034, (USD MILLION)
FIGURE 130 SOUTH AFRICA PARTIAL DISCHARGE MONITORING SYSTEMS CURRENT AND FUTURE TYPE ANALYSIS, 2025–2034, (USD MILLION)
FIGURE 131 SOUTH AFRICA PARTIAL DISCHARGE MONITORING SYSTEMS CURRENT AND FUTURE END USER ANALYSIS, 2025–2034, (USD MILLION)
FIGURE 132 ISRAEL PARTIAL DISCHARGE MONITORING SYSTEMS CURRENT AND FUTURE TYPE ANALYSIS, 2025–2034, (USD MILLION)
FIGURE 133 ISRAEL PARTIAL DISCHARGE MONITORING SYSTEMS CURRENT AND FUTURE END USER ANALYSIS, 2025–2034, (USD MILLION)
FIGURE 134 REST OF MEA PARTIAL DISCHARGE MONITORING SYSTEMS CURRENT AND FUTURE TYPE ANALYSIS, 2025–2034, (USD MILLION)
FIGURE 135 REST OF MEA PARTIAL DISCHARGE MONITORING SYSTEMS CURRENT AND FUTURE END USER ANALYSIS, 2025–2034, (USD MILLION)
FIGURE 136 U. S. MARKET SHARE ANALYSIS BY TYPE (2024)
FIGURE 137 U. S. MARKET SHARE ANALYSIS BY END USER (2024)
FIGURE 138 CANADA MARKET SHARE ANALYSIS BY TYPE (2024)
FIGURE 139 CANADA MARKET SHARE ANALYSIS BY END USER (2024)
FIGURE 140 MEXICO MARKET SHARE ANALYSIS BY TYPE (2024)
FIGURE 141 MEXICO MARKET SHARE ANALYSIS BY END USER (2024)
FIGURE 142 CHINA MARKET SHARE ANALYSIS BY TYPE (2024)
FIGURE 143 CHINA MARKET SHARE ANALYSIS BY END USER (2024)
FIGURE 144 JAPAN MARKET SHARE ANALYSIS BY TYPE (2024)
FIGURE 145 JAPAN MARKET SHARE ANALYSIS BY END USER (2024)
FIGURE 146 INDIA MARKET SHARE ANALYSIS BY TYPE (2024)
FIGURE 147 INDIA MARKET SHARE ANALYSIS BY END USER (2024)
FIGURE 148 SOUTH KOREA MARKET SHARE ANALYSIS BY TYPE (2024)
FIGURE 149 SOUTH KOREA MARKET SHARE ANALYSIS BY END USER (2024)
FIGURE 150 SAUDI ARABIA MARKET SHARE ANALYSIS BY TYPE (2024)
FIGURE 151 SAUDI ARABIA MARKET SHARE ANALYSIS BY END USER (2024)
FIGURE 152 UAE MARKET SHARE ANALYSIS BY TYPE (2024)
FIGURE 153 UAE MARKET SHARE ANALYSIS BY END USER (2024)
FIGURE 154 EGYPT MARKET SHARE ANALYSIS BY TYPE (2024)
FIGURE 155 EGYPT MARKET SHARE ANALYSIS BY END USER (2024)
FIGURE 156 NIGERIA MARKET SHARE ANALYSIS BY TYPE (2024)
FIGURE 157 NIGERIA MARKET SHARE ANALYSIS BY END USER (2024)
FIGURE 158 SOUTH AFRICA MARKET SHARE ANALYSIS BY TYPE (2024)
FIGURE 159 SOUTH AFRICA MARKET SHARE ANALYSIS BY END USER (2024)
FIGURE 160 GERMANY MARKET SHARE ANALYSIS BY TYPE (2024)
FIGURE 161 GERMANY MARKET SHARE ANALYSIS BY END USER (2024)
FIGURE 162 FRANCE MARKET SHARE ANALYSIS BY TYPE (2024)
FIGURE 163 FRANCE MARKET SHARE ANALYSIS BY END USER (2024)
FIGURE 164 UK MARKET SHARE ANALYSIS BY TYPE (2024)
FIGURE 165 UK MARKET SHARE ANALYSIS BY END USER (2024)
FIGURE 166 SPAIN MARKET SHARE ANALYSIS BY TYPE (2024)
FIGURE 167 SPAIN MARKET SHARE ANALYSIS BY END USER (2024)
FIGURE 168 ITALY MARKET SHARE ANALYSIS BY TYPE (2024)
FIGURE 169 ITALY MARKET SHARE ANALYSIS BY END USER (2024)
FIGURE 170 BRAZIL MARKET SHARE ANALYSIS BY TYPE (2024)
FIGURE 171 BRAZIL MARKET SHARE ANALYSIS BY END USER (2024)
FIGURE 172 ARGENTINA MARKET SHARE ANALYSIS BY TYPE (2024)
FIGURE 173 ARGENTINA MARKET SHARE ANALYSIS BY END USER (2024)
FIGURE 174 COLUMBIA MARKET SHARE ANALYSIS BY TYPE (2024)
FIGURE 175 COLUMBIA MARKET SHARE ANALYSIS BY END USER (2024)
FIGURE 176 GLOBAL PARTIAL DISCHARGE MONITORING SYSTEMS CURRENT AND FUTURE MARKET KEY COUNTRY LEVEL ANALYSIS, 2024–2034, (USD MILLION)
FIGURE 177 FINANCIAL OVERVIEW:
Key Players Analysis:
Siemens: Siemens is a leading player in the partial discharge monitoring systems market, known for its broad portfolio of electrical and automation products. The company’s partial discharge monitoring systems are equipped with advanced digital and IoT technologies, enabling enhanced data management and predictive maintenance capabilities. Siemens' strong brand presence, extensive global reach, and continuous technological advancements give it a competitive edge in the energy and power sector. Its solutions are widely adopted by utilities and industrial operators worldwide, positioning Siemens as a crucial player in the market.
Qualitrol: Qualitrol is a prominent player in the partial discharge monitoring systems market, with a long-standing reputation for providing reliable monitoring and protection equipment for electric grids. The company offers a range of comprehensive monitoring solutions, including real-time data analysis, which helps organizations prevent equipment failures and optimize asset performance. Qualitrol's focus on customer service and its ability to offer tailored solutions ensure that it meets the specific needs of clients. Additionally, its global network and continuous product innovation further enhance its competitive edge, reinforcing its position as a key player in the industry.
OMICRON: OMICRON stands out as a market leader in the partial discharge monitoring systems sector due to its innovative solutions in testing, diagnostics, and monitoring. The company's systems are known for their high precision and reliability, making them highly valued by utility companies and industrial operators worldwide. OMICRON's strong commitment to research and development allows it to stay at the forefront of technological advancements, ensuring its products meet the evolving needs of the industry. Its expertise in power grid management further strengthens its competitive position, making OMICRON a trusted choice for organizations looking to enhance the reliability and efficiency of their power infrastructure.
Market Key Players
Qualitrol
Siemens
Prysmian Group
Meggitt Sensing Systems
Eaton
Megger
Doble Engineering Company
LS Cable & System
Mitsubishi Electric
HVPD Ltd.
EA Technology
OMICRON
APM Technologies
Rugged Monitoring
PMDT
PowerPD Inc.
IPEC Limited
Dynamic Ratings
Altanova Group
Dimrus
Innovit Electric
Driver:
Rising Demand for Reliability
The increasing demand for reliable electrical equipment is a major driver of the partial discharge monitoring systems market. Industries and utilities are increasingly adopting advanced monitoring systems to avoid unplanned downtimes and costly equipment failures. By detecting early signs of insulation breakdowns, partial discharge monitoring enables proactive maintenance and prevents severe issues before they occur. Rising investments in power infrastructure, particularly in emerging economies, are further fueling market growth. As these countries expand and upgrade their power grids, efficient monitoring systems are crucial to ensuring the reliability and longevity of both new and existing electrical assets. Additionally, the growth of renewable energy installations, such as wind and solar power, is pushing the demand for partial discharge monitoring. Renewable energy systems, particularly offshore wind farms, require durable monitoring solutions to maintain optimal performance under various environmental conditions, highlighting the critical role of partial discharge monitoring in sustaining these systems’ efficiency.
Restrain:
High installation Costs
High initial installation costs are a significant restraint for the partial discharge monitoring systems market. The upfront expenses related to purchasing equipment, installing systems, and maintaining them are particularly burdensome for large-scale industrial or utility applications. Smaller organizations may find it difficult to justify these costs, which limits their adoption of such technologies. Additionally, limited awareness of partial discharge monitoring in developing regions poses another challenge. Many businesses and utilities in emerging economies may not fully grasp the value of these systems or lack the resources to implement them, slowing the widespread adoption of these technologies in these markets.
Opportunities:
Smart Grids and IoT Provide
The expansion of smart grids and the integration of IoT-based monitoring solutions present significant growth opportunities for the partial discharge monitoring systems market. As power grids become more advanced and interconnected, the demand for real-time monitoring and predictive maintenance tools rises, providing a substantial opportunity for market growth. Another promising opportunity is the increasing adoption of partial discharge monitoring systems in offshore wind and solar projects. These renewable energy installations require continuous monitoring to ensure optimal performance and prevent costly downtime. Partial discharge monitoring systems play a crucial role in maintaining efficiency, especially in harsh environmental conditions. The shift towards condition-based monitoring in industrial equipment also drives market potential. Many industries are moving from reactive to predictive maintenance, with partial discharge monitoring systems helping to predict and prevent equipment failures before they happen, thus enhancing operational efficiency.
Trends:
Increasing AI adoption
The adoption of AI and machine learning for predictive maintenance is a significant trend in the partial discharge monitoring systems market. AI-powered systems can process large volumes of data from partial discharge sensors, enabling early detection of potential equipment failures and reducing the likelihood of unplanned downtime. This trend is driving companies to invest in more advanced, intelligent monitoring systems to enhance operational efficiency and minimize maintenance costs. Another emerging trend is the use of digital twins for power equipment monitoring. By creating virtual models of physical assets, companies can simulate equipment behavior and predict future performance. This technology allows for more proactive and accurate maintenance strategies. When combined with partial discharge monitoring systems, digital twins offer deeper insights into the health of equipment, improving asset management and prolonging the lifespan of critical infrastructure.
Recent Development:
In September 2024, Japan and China reached a significant agreement concerning the release of treated radioactive water from the Fukushima nuclear plant. Under this agreement, international sampling and monitoring of the discharged water will be conducted, with oversight from the International Atomic Energy Agency (IAEA). This deal has helped alleviate tensions between the two countries and has paved the way for the gradual resumption of Chinese imports of Japanese seafood, which had been halted due to concerns over the safety of the water discharge. The collaboration highlights a mutual commitment to transparency and environmental monitoring.
In October 2023, High Voltage Partial Discharge (HVPD) was rebranded as Monitra to better reflect its commitment to digital monitoring solutions for high-voltage asset management. This rebranding underscores the company's focus on using advanced, data-driven tools to enhance the safety, reliability, and longevity of electrical systems. Monitra aims to provide cutting-edge monitoring solutions that help utilities and industries optimize their high-voltage infrastructure, reduce downtime, and improve maintenance strategies, ensuring the long-term performance of critical assets.
In February 2024, SON (Standards Organisation of Nigeria) inaugurated a new laboratory aimed at assessing the quality of generators and transformers, addressing the issue of substandard products in the Nigerian market. This initiative is designed to enhance product reliability, ensure compliance with international standards, and improve the overall regulatory framework of the power sector. By focusing on quality control, SON aims to reduce the prevalence of faulty equipment and strengthen the integrity of Nigeria's energy infrastructure.