Pasta and Noodles Market Size, Growth & Forecast | 4.65% CAGR
Global Pasta and Noodles Market Size, Share & Analysis By Type (Pasta, Noodles), By Category (Dried, Fresh/Instant, Canned or Frozen), By Distribution Channel (Supermarkets & Hypermarkets, Convenience Stores, Specialty Stores, Online Retail, Others), By End-User Consumption Patterns Industry Overview, Pricing Dynamics, Brand Competition, Regional Demand & Forecast 2025–2034
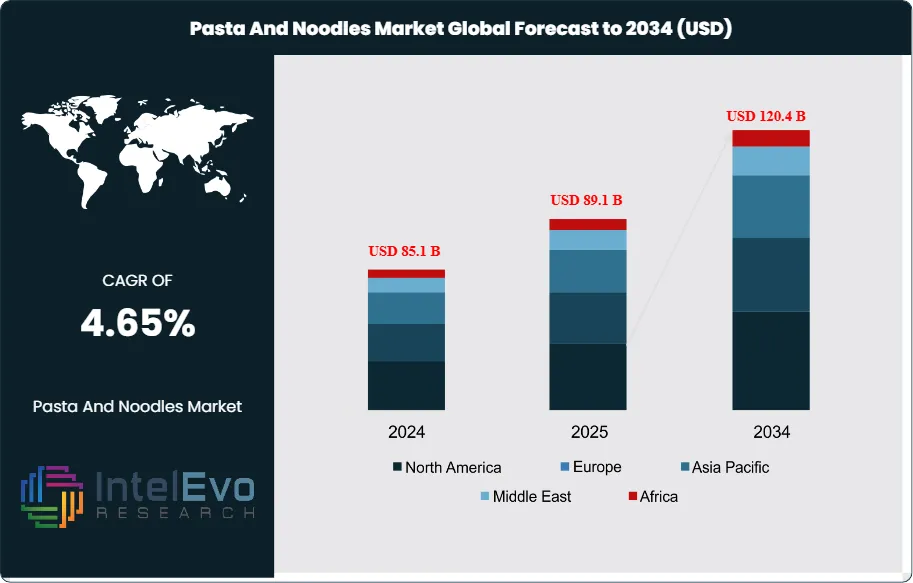
The Pasta and Noodles Market size is expected to be worth around USD 120.4 billion by 2034, from USD 85.1 billion in 2024, growing at a CAGR of 4.65% during the forecast period from 2025 to 2034. Building on centuries of culinary adoption, the category has transitioned from pantry staple to a dynamic, innovation-led segment of the packaged foods industry. Over the last decade, market expansion has been underpinned by rising urbanization, time-pressed households, and widening availability across modern retail and e-commerce. In 2024, supply-side conditions are broadly supportive, with global wheat output approaching 770 million tonnes, ensuring adequate raw material availability even as producers manage quality differentials and price volatility. On the demand side, convenience remains a central driver: ready-to-cook and ready-to-eat formats continue to outpace the broader category, with urban sell-through rising by roughly 5% per year. Cultural convergence is also expanding the addressable base, as consumption of Italian and Asian cuisines grows at about 7% annually in North America and Europe, catalyzing cross-over innovation (e.g., Italian pasta with Asian flavors and vice versa).
The product mix is tilting toward higher-value attributes—high-protein, fiber-enriched, gluten-free, and clean-label offerings—supported by the rapid uptake of plant-based and alternative-grain lines, a subsegment expected to grow near 6% CAGR over the next five years. Digitalization and automation are reshaping manufacturing and route-to-market: smart dosing and drying technologies improve yield and consistency; advanced packaging lines enable portion-controlled, microwaveable, and recyclable formats; and data-driven promotions are lifting online penetration, particularly in direct-to-consumer bundles and subscription packs. Key challenges include exposure to agricultural commodity swings, energy costs, and regulatory tightening on labeling, sodium reduction, and sustainability mandates; players with hedged procurement, flexible formulations, and recyclable packaging are better positioned to defend margins.
Regionally, Europe remains a volume and premiumization anchor, while North America benefits from robust ethnic and better-for-you adoption. Asia Pacific is the principal growth engine—led by China’s large base in instant formats and accelerating demand in India and Southeast Asia—supported by expanding cold chains and modern trade. Emerging opportunities are also visible in the Middle East & Africa and parts of Latin America, where per-capita consumption is low but rising alongside incomes. For investors, the most attractive hotspots combine scale and premium trade-up: Asia Pacific for volume-led growth, and developed markets for margin-accretive innovation and private-label partnerships.
Key Takeaways
Market Growth: The global Pasta & Noodles market is projected to rise from USD 85.1 Bn in 2024 to USD 129.4 Bn by 2034, at a 4.6% CAGR, driven by convenience-led demand, cross-cultural cuisine adoption, and wider modern retail/e-commerce reach.
Product Type: Pasta leads with 58.7% value share in 2024, supported by broad household penetration, premiumization (high-protein, fiber-enriched, gluten-free lines), and strong brand depth from multinationals (e.g., Barilla) and private labels.
Distribution Channel: Hypermarkets & Supermarkets account for 47.2% of category sales, reflecting their role in price discovery, private-label expansion, and promotional intensity; however, online and convenience formats are capturing incremental trips in urban corridors.
Driver: Rising preference for time-saving meals is boosting ready-to-cook/ready-to-eat formats, with urban sell-through rising ~5% YoY; robust wheat availability (~770 million tonnes in 2024) underpins stable upstream supply, limiting major volume disruptions.
Restraint: Exposure to agricultural and energy cost volatility compresses margins, with historical commodity swings of 10–20% translating to 100–150 bps EBIT pressure in unhedged portfolios; tightening sodium-reduction and labeling rules in the EU/NA add ~2–3% in reformulation/packaging costs through 2028.
Opportunity: Plant-based/alternative-grain SKUs (chickpea, lentil, brown rice) are forecast to expand at ~6% CAGR (2025–2030), aided by flexitarian adoption and premium price realization; players that pair nutrition claims with recyclable, portion-controlled packaging can outgrow the market by 200–300 bps.
Trend: Format innovation is shifting toward dried and shelf-stable options (still 52.3% share) with microwaveable cups/bowls and instant kits showing high-single- to low-double-digit growth; leaders (e.g., Nissin, Maggi/ Nestlé, Indofood) are scaling AI-informed flavor launches and automated packaging for faster rotation.
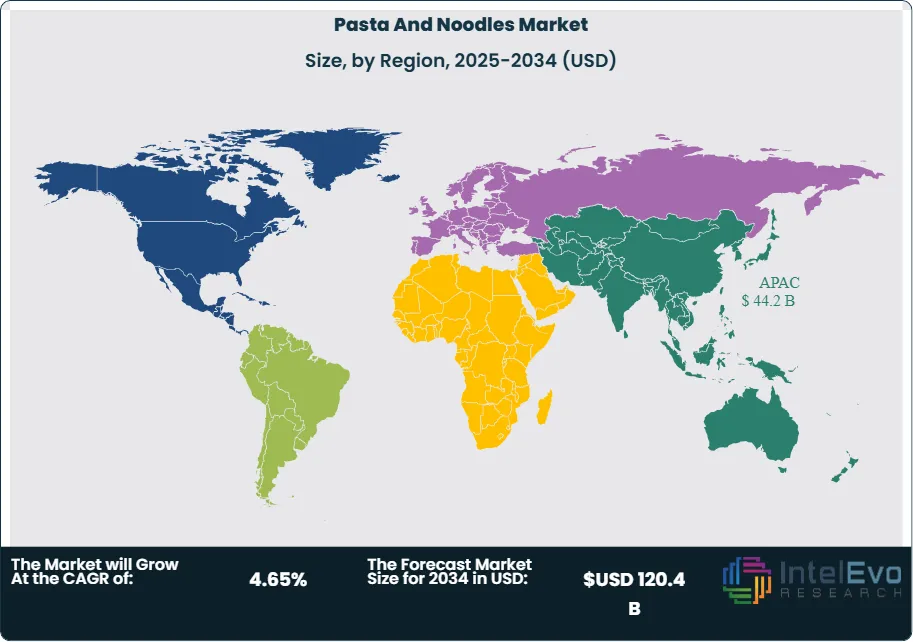
Regional Analysis:APAC dominates with 53.2% share (USD 44.2 Bn in 2024), propelled by China’s instant segment and accelerating demand in India and Southeast Asia; Europe remains a premiumization anchor, while North America benefits from ethnic-cuisine adoption. Fastest growth is expected in APAC (≈4–5% CAGR) and selected Middle East/Africa markets from a low per-capita base.
Type Analysis
Pasta continues to anchor category value in 2025, retaining an estimated ~58.7% revenue share on the back of entrenched household penetration, culinary versatility, and sustained premiumization. Trade-up is visible in high-protein, fiber-enriched, whole-grain, and gluten-free SKUs, with leading brands (e.g., Barilla) and private labels expanding differentiated ranges that command 10–20% price premiums versus standard lines. Innovation in shapes, sauces, and ready-meal pairings is also nudging average selling prices upward, helping pasta outgrow volume in developed markets.
Noodles remain the scale growth engine, particularly across Asia Pacific, where instant, ramen, and stir-fry formats benefit from strong convenience cues and flavor localization. As urban working households expand, single-serve cups and bowls show high-single-digit volume gains, while better-for-you noodle variants (reduced sodium, air-dried, alternative grains) are widening the addressable consumer base. Together, these dynamics position noodles to capture a rising share of incremental category growth through 2030, even as pasta sustains value leadership.
Application Analysis
Dried formats lead the product mix with ~52.3% share, supported by long shelf life, ease of storage, and broad recipe compatibility. Pantry-stocking behavior that intensified during recent supply disruptions has normalized at a higher baseline, and value-for-money positioning keeps dried SKUs central to both retail baskets and foodservice back-of-house menus. Operationally, higher line speeds and improved drying controls are lifting yield and consistency, supporting margins despite input-cost volatility.
Fresh/instant offerings are the fastest to rotate at point of sale, propelled by microwaveable cups, ready-to-heat trays, and chef-inspired broths and sauces. Convenience retail and e-commerce bundles are sustaining high-single- to low-double-digit growth, with major players (Nissin, Nestlé/Maggi, Indofood) using rapid flavor testing to localize portfolios. Canned or frozen niches remain smaller but strategically important for premium and seasonal occasions; flash-frozen filled pasta and frozen noodle kits are gaining traction in North America and Europe as retailers expand freezer space and meal-kit adjacencies.
End-Use Analysis
Household consumption (retail) accounts for roughly ~70% of global demand in 2025, buoyed by multi-pack promotions, private-label expansion, and digital coupons that improve price-per-serve economics. At-home cooking trends—especially weeknight pasta dishes and instant noodle meals—continue to anchor repeat purchases, while subscription boxes and D2C bundles are lifting retention.
Foodservice represents ~25–28% of category volumes and is recovering on-premise traffic alongside delivery growth. Quick-service restaurants and cloud kitchens are introducing regionally tailored noodle bowls and pasta entrees, supporting menu innovation cycles and premium price points. Institutional channels (education, healthcare, workplace) comprise the remainder, emphasizing cost-stable dried SKUs and nutrition-forward formulations to meet procurement standards.
Regional Analysis
Asia Pacific remains the demand center with ~53.2% share (valued at USD 44.2 Bn in 2024) and is set to outpace the global market through 2030, underpinned by large base consumption, rapid urbanization, and continuous flavor localization. China leads in instant formats, while India and Southeast Asia are expanding distribution into Tier-2/3 cities via modern trade and convenience formats, reinforcing double-digit growth pockets for noodles and value dried SKUs.
Europe sustains premium value density through authentic durum pasta, artisanal cues, and health-led innovation, while North America benefits from cross-cuisine adoption and better-for-you positioning. Latin America and the Middle East & Africa present catch-up opportunities from a low per-capita base; as cold-chain and modern retail improve, these regions are expected to deliver above-market CAGRs (≈4–6%), particularly in value dried pasta and flavor-forward instant noodles. For investors, the most attractive near-term hotspots pair APAC’s scale with developed-market premiumization, balancing volume growth with margin accretion.
By Type (Pasta, Noodles), By Category (Dried, Fresh/Instant, Canned or Frozen), By Distribution Channel (Supermarkets & Hypermarkets, Convenience Stores, Specialty Stores, Online Retail, Others)
Research Methodology
Primary Research- 100 Interviews of Stakeholders
Secondary Research
Desk Research
Regional scope
North America (United States, Canada, Mexico)
Latin America (Brazil, Argentina, Columbia)
East Asia And Pacific (China, Japan, South Korea, Australia, Cambodia, Fiji, Indonesia)
Sea And South Asia (India, Singapore, Thailand, Taiwan, Malaysia)
Eastern Europe (Poland, Russia, Czech Republic, Romania)
Western Europe (Germany, U.K., France, Spain, Itlay)
Middle East & Africa (GCC Countries, Egypt, Nigeria, South Africa, Israel)
Competitive Landscape
Acecook Vietnam Co., Ltd., General Mills, Inc., ITC Limited, Nissin Foods, TreeHouse Foods Inc., Nestlé S.A., Conagra Brands, Inc., Ebro Foods SA, Barilla Group, Campbell Soup Company, Jinmailang Foods Co., Ltd, Del Monte Foods, Unilever, Bambino Agro Industries Ltd, Other Key Players
Customization Scope
Customization for segments, region/country-level will be provided. Moreover, additional customization can be done based on the requirements.
Pricing and Purchase Options
Avail customized purchase options to meet your exact research needs. We have three licenses to opt for: Single User License, Multi-User License (Up to 5 Users), Corporate Use License (Unlimited User and Printable PDF).
TABLE OF CONTENTS
1. EXECUTIVE SUMMARY
1.1. MARKET SNAPSHOT
1.2. KEY FINDINGS & INSIGHTS
1.3. ANALYST RECOMMENDATIONS
1.4. FUTURE OUTLOOK
2. RESEARCH METHODOLOGY
2.1. MARKET DEFINITION & SCOPE
2.2. RESEARCH OBJECTIVES: PRIMARY & SECONDARY DATA SOURCES
2.3. DATA COLLECTION SOURCES
2.3.1. COVERAGE OF 100+ PRIMARY RESEARCH/CONSULTATION CALLS WITH INDUSTRY STAKEHOLDERS
FIGURE 17 NORTH AMERICA PASTA AND NOODLES SYSTEM CURRENT AND FUTURE TYPE ANALYSIS, 2025–2034, (USD MILLION)
FIGURE 18 NORTH AMERICA PASTA AND NOODLES SYSTEM CURRENT AND FUTURE END USER ANALYSIS, 2025–2034, (USD MILLION)
FIGURE 19 MARKET SHARE BY COUNTRY
FIGURE 20 LATIN AMERICA PASTA AND NOODLES SYSTEM CURRENT AND FUTURE TYPE ANALYSIS, 2025–2034, (USD MILLION)
FIGURE 21 LATIN AMERICA PASTA AND NOODLES SYSTEM CURRENT AND FUTURE END USER ANALYSIS, 2025–2034, (USD MILLION)
FIGURE 22 MARKET SHARE BY COUNTRY
FIGURE 23 EASTERN EUROPE PASTA AND NOODLES SYSTEM CURRENT AND FUTURE TYPE ANALYSIS, 2025–2034, (USD MILLION)
FIGURE 24 EASTERN EUROPE PASTA AND NOODLES SYSTEM CURRENT AND FUTURE END USER ANALYSIS, 2025–2034, (USD MILLION)
FIGURE 25 MARKET SHARE BY COUNTRY
FIGURE 26 WESTERN EUROPE PASTA AND NOODLES SYSTEM CURRENT AND FUTURE TYPE ANALYSIS, 2025–2034, (USD MILLION)
FIGURE 27 WESTERN EUROPE PASTA AND NOODLES SYSTEM CURRENT AND FUTURE END USER ANALYSIS, 2025–2034, (USD MILLION)
FIGURE 28 MARKET SHARE BY COUNTRY
FIGURE 29 EAST ASIA AND PACIFIC PASTA AND NOODLES SYSTEM CURRENT AND FUTURE TYPE ANALYSIS, 2025–2034, (USD MILLION)
FIGURE 30 EAST ASIA AND PACIFIC PASTA AND NOODLES SYSTEM CURRENT AND FUTURE END USER ANALYSIS, 2025–2034, (USD MILLION)
FIGURE 31 MARKET SHARE BY COUNTRY
FIGURE 32 SEA AND SOUTH ASIA PASTA AND NOODLES SYSTEM CURRENT AND FUTURE TYPE ANALYSIS, 2025–2034, (USD MILLION)
FIGURE 33 SEA AND SOUTH ASIA PASTA AND NOODLES SYSTEM CURRENT AND FUTURE END USER ANALYSIS, 2025–2034, (USD MILLION)
FIGURE 34 MARKET SHARE BY COUNTRY
FIGURE 35 MIDDLE EAST AND AFRICA PASTA AND NOODLES SYSTEM CURRENT AND FUTURE TYPE ANALYSIS, 2025–2034, (USD MILLION)
FIGURE 36 MIDDLE EAST AND AFRICA PASTA AND NOODLES SYSTEM CURRENT AND FUTURE END USER ANALYSIS, 2025–2034, (USD MILLION)
FIGURE 37 NORTH AMERICA PASTA AND NOODLES SYSTEM CURRENT AND FUTURE MARKET VOLUME SHARE REGIONAL ANALYSIS, 2025–2034, (USD MILLION)
FIGURE 38 U.S. PASTA AND NOODLES SYSTEM CURRENT AND FUTURE TYPE ANALYSIS, 2025–2034, (USD MILLION)
FIGURE 39 U.S. PASTA AND NOODLES SYSTEM CURRENT AND FUTURE END USER ANALYSIS, 2025–2034, (USD MILLION)
FIGURE 40 CANADA PASTA AND NOODLES SYSTEM CURRENT AND FUTURE TYPE ANALYSIS, 2025–2034, (USD MILLION)
FIGURE 41 CANADA PASTA AND NOODLES SYSTEM CURRENT AND FUTURE END USER ANALYSIS, 2025–2034, (USD MILLION)
FIGURE 42 LATIN AMERICA PASTA AND NOODLES SYSTEM CURRENT AND FUTURE MARKET VOLUME SHARE REGIONAL ANALYSIS, 2025–2034, (USD MILLION)
FIGURE 43 MEXICO PASTA AND NOODLES SYSTEM CURRENT AND FUTURE TYPE ANALYSIS, 2025–2034, (USD MILLION)
FIGURE 44 MEXICO PASTA AND NOODLES SYSTEM CURRENT AND FUTURE END USER ANALYSIS, 2025–2034, (USD MILLION)
FIGURE 45 BRAZIL PASTA AND NOODLES SYSTEM CURRENT AND FUTURE TYPE ANALYSIS, 2025–2034, (USD MILLION)
FIGURE 46 BRAZIL PASTA AND NOODLES SYSTEM CURRENT AND FUTURE END USER ANALYSIS, 2025–2034, (USD MILLION)
FIGURE 47 ARGENTINA PASTA AND NOODLES SYSTEM CURRENT AND FUTURE TYPE ANALYSIS, 2025–2034, (USD MILLION)
FIGURE 48 ARGENTINA PASTA AND NOODLES SYSTEM CURRENT AND FUTURE END USER ANALYSIS, 2025–2034, (USD MILLION)
FIGURE 49 COLUMBIA PASTA AND NOODLES SYSTEM CURRENT AND FUTURE TYPE ANALYSIS, 2025–2034, (USD MILLION)
FIGURE 50 COLUMBIA PASTA AND NOODLES SYSTEM CURRENT AND FUTURE END USER ANALYSIS, 2025–2034, (USD MILLION)
FIGURE 51 REST OF LATIN AMERICA PASTA AND NOODLES SYSTEM CURRENT AND FUTURE TYPE ANALYSIS, 2025–2034, (USD MILLION)
FIGURE 52 REST OF LATIN AMERICA PASTA AND NOODLES SYSTEM CURRENT AND FUTURE END USER ANALYSIS, 2025–2034, (USD MILLION)
FIGURE 53 EASTERN EUROPE PASTA AND NOODLES SYSTEM CURRENT AND FUTURE MARKET VOLUME SHARE REGIONAL ANALYSIS, 2025–2034, (USD MILLION)
FIGURE 54 POLAND PASTA AND NOODLES SYSTEM CURRENT AND FUTURE TYPE ANALYSIS, 2025–2034, (USD MILLION)
FIGURE 55 POLAND PASTA AND NOODLES SYSTEM CURRENT AND FUTURE END USER ANALYSIS, 2025–2034, (USD MILLION)
FIGURE 56 RUSSIA PASTA AND NOODLES SYSTEM CURRENT AND FUTURE TYPE ANALYSIS, 2025–2034, (USD MILLION)
FIGURE 57 RUSSIA PASTA AND NOODLES SYSTEM CURRENT AND FUTURE END USER ANALYSIS, 2025–2034, (USD MILLION)
FIGURE 58 CZECH REPUBLIC PASTA AND NOODLES SYSTEM CURRENT AND FUTURE TYPE ANALYSIS, 2025–2034, (USD MILLION)
FIGURE 59 CZECH REPUBLIC PASTA AND NOODLES SYSTEM CURRENT AND FUTURE END USER ANALYSIS, 2025–2034, (USD MILLION)
FIGURE 60 ROMANIA PASTA AND NOODLES SYSTEM CURRENT AND FUTURE TYPE ANALYSIS, 2025–2034, (USD MILLION)
FIGURE 61 ROMANIA PASTA AND NOODLES SYSTEM CURRENT AND FUTURE END USER ANALYSIS, 2025–2034, (USD MILLION)
FIGURE 62 REST OF EASTERN EUROPE PASTA AND NOODLES SYSTEM CURRENT AND FUTURE TYPE ANALYSIS, 2025–2034, (USD MILLION)
FIGURE 63 REST OF EASTERN EUROPE PASTA AND NOODLES SYSTEM CURRENT AND FUTURE END USER ANALYSIS, 2025–2034, (USD MILLION)
FIGURE 64 WESTERN EUROPE PASTA AND NOODLES SYSTEM CURRENT AND FUTURE MARKET VOLUME SHARE REGIONAL ANALYSIS, 2025–2034, (USD MILLION)
FIGURE 65 GERMANY PASTA AND NOODLES SYSTEM CURRENT AND FUTURE TYPE ANALYSIS, 2025–2034, (USD MILLION)
FIGURE 66 GERMANY PASTA AND NOODLES SYSTEM CURRENT AND FUTURE END USER ANALYSIS, 2025–2034, (USD MILLION)
FIGURE 67 FRANCE PASTA AND NOODLES SYSTEM CURRENT AND FUTURE TYPE ANALYSIS, 2025–2034, (USD MILLION)
FIGURE 68 FRANCE PASTA AND NOODLES SYSTEM CURRENT AND FUTURE END USER ANALYSIS, 2025–2034, (USD MILLION)
FIGURE 69 UK PASTA AND NOODLES SYSTEM CURRENT AND FUTURE TYPE ANALYSIS, 2025–2034, (USD MILLION)
FIGURE 70 UK PASTA AND NOODLES SYSTEM CURRENT AND FUTURE END USER ANALYSIS, 2025–2034, (USD MILLION)
FIGURE 71 SPAIN PASTA AND NOODLES SYSTEM CURRENT AND FUTURE TYPE ANALYSIS, 2025–2034, (USD MILLION)
FIGURE 72 SPAIN PASTA AND NOODLES SYSTEM CURRENT AND FUTURE END USER ANALYSIS, 2025–2034, (USD MILLION)
FIGURE 73 ITALY PASTA AND NOODLES SYSTEM CURRENT AND FUTURE TYPE ANALYSIS, 2025–2034, (USD MILLION)
FIGURE 74 ITALY PASTA AND NOODLES SYSTEM CURRENT AND FUTURE END USER ANALYSIS, 2025–2034, (USD MILLION)
FIGURE 75 REST OF WESTERN EUROPE PASTA AND NOODLES SYSTEM CURRENT AND FUTURE TYPE ANALYSIS, 2025–2034, (USD MILLION)
FIGURE 76 REST OF WESTERN EUROPE PASTA AND NOODLES SYSTEM CURRENT AND FUTURE END USER ANALYSIS, 2025–2034, (USD MILLION)
FIGURE 77 EAST ASIA AND PACIFIC PASTA AND NOODLES SYSTEM CURRENT AND FUTURE MARKET VOLUME SHARE REGIONAL ANALYSIS, 2025–2034, (USD MILLION)
FIGURE 78 CHINA PASTA AND NOODLES SYSTEM CURRENT AND FUTURE TYPE ANALYSIS, 2025–2034, (USD MILLION)
FIGURE 79 CHINA PASTA AND NOODLES SYSTEM CURRENT AND FUTURE END USER ANALYSIS, 2025–2034, (USD MILLION)
FIGURE 80 JAPAN PASTA AND NOODLES SYSTEM CURRENT AND FUTURE TYPE ANALYSIS, 2025–2034, (USD MILLION)
FIGURE 81 JAPAN PASTA AND NOODLES SYSTEM CURRENT AND FUTURE END USER ANALYSIS, 2025–2034, (USD MILLION)
FIGURE 82 AUSTRALIA PASTA AND NOODLES SYSTEM CURRENT AND FUTURE TYPE ANALYSIS, 2025–2034, (USD MILLION)
FIGURE 83 AUSTRALIA PASTA AND NOODLES SYSTEM CURRENT AND FUTURE END USER ANALYSIS, 2025–2034, (USD MILLION)
FIGURE 84 CAMBODIA PASTA AND NOODLES SYSTEM CURRENT AND FUTURE TYPE ANALYSIS, 2025–2034, (USD MILLION)
FIGURE 85 CAMBODIA PASTA AND NOODLES SYSTEM CURRENT AND FUTURE END USER ANALYSIS, 2025–2034, (USD MILLION)
FIGURE 86 FIJI PASTA AND NOODLES SYSTEM CURRENT AND FUTURE TYPE ANALYSIS, 2025–2034, (USD MILLION)
FIGURE 87 FIJI PASTA AND NOODLES SYSTEM CURRENT AND FUTURE END USER ANALYSIS, 2025–2034, (USD MILLION)
FIGURE 88 INDONESIA PASTA AND NOODLES SYSTEM CURRENT AND FUTURE TYPE ANALYSIS, 2025–2034, (USD MILLION)
FIGURE 89 INDONESIA PASTA AND NOODLES SYSTEM CURRENT AND FUTURE END USER ANALYSIS, 2025–2034, (USD MILLION)
FIGURE 90 SOUTH KOREA PASTA AND NOODLES SYSTEM CURRENT AND FUTURE TYPE ANALYSIS, 2025–2034, (USD MILLION)
FIGURE 91 SOUTH KOREA PASTA AND NOODLES SYSTEM CURRENT AND FUTURE END USER ANALYSIS, 2025–2034, (USD MILLION)
FIGURE 92 REST OF EAST ASIA AND PACIFIC PASTA AND NOODLES SYSTEM CURRENT AND FUTURE TYPE ANALYSIS, 2025–2034, (USD MILLION)
FIGURE 93 REST OF EAST ASIA AND PACIFIC PASTA AND NOODLES SYSTEM CURRENT AND FUTURE END USER ANALYSIS, 2025–2034, (USD MILLION)
FIGURE 94 SEA AND SOUTH ASIA PASTA AND NOODLES SYSTEM CURRENT AND FUTURE MARKET VOLUME SHARE REGIONAL ANALYSIS, 2025–2034, (USD MILLION)
FIGURE 95 BANGLADESH PASTA AND NOODLES SYSTEM CURRENT AND FUTURE TYPE ANALYSIS, 2025–2034, (USD MILLION)
FIGURE 96 BANGLADESH PASTA AND NOODLES SYSTEM CURRENT AND FUTURE END USER ANALYSIS, 2025–2034, (USD MILLION)
FIGURE 97 NEW ZEALAND PASTA AND NOODLES SYSTEM CURRENT AND FUTURE TYPE ANALYSIS, 2025–2034, (USD MILLION)
FIGURE 98 NEW ZEALAND PASTA AND NOODLES SYSTEM CURRENT AND FUTURE END USER ANALYSIS, 2025–2034, (USD MILLION)
FIGURE 99 INDIA PASTA AND NOODLES SYSTEM CURRENT AND FUTURE TYPE ANALYSIS, 2025–2034, (USD MILLION)
FIGURE 100 INDIA PASTA AND NOODLES SYSTEM CURRENT AND FUTURE END USER ANALYSIS, 2025–2034, (USD MILLION)
FIGURE 101 SINGAPORE PASTA AND NOODLES SYSTEM CURRENT AND FUTURE TYPE ANALYSIS, 2025–2034, (USD MILLION)
FIGURE 102 SINGAPORE PASTA AND NOODLES SYSTEM CURRENT AND FUTURE END USER ANALYSIS, 2025–2034, (USD MILLION)
FIGURE 103 THAILAND PASTA AND NOODLES SYSTEM CURRENT AND FUTURE TYPE ANALYSIS, 2025–2034, (USD MILLION)
FIGURE 104 THAILAND PASTA AND NOODLES SYSTEM CURRENT AND FUTURE END USER ANALYSIS, 2025–2034, (USD MILLION)
FIGURE 105 TAIWAN PASTA AND NOODLES SYSTEM CURRENT AND FUTURE TYPE ANALYSIS, 2025–2034, (USD MILLION)
FIGURE 106 TAIWAN PASTA AND NOODLES SYSTEM CURRENT AND FUTURE END USER ANALYSIS, 2025–2034, (USD MILLION)
FIGURE 107 MALAYSIA PASTA AND NOODLES SYSTEM CURRENT AND FUTURE TYPE ANALYSIS, 2025–2034, (USD MILLION)
FIGURE 108 MALAYSIA PASTA AND NOODLES SYSTEM CURRENT AND FUTURE END USER ANALYSIS, 2025–2034, (USD MILLION)
FIGURE 109 REST OF SEA AND SOUTH ASIA PASTA AND NOODLES SYSTEM CURRENT AND FUTURE TYPE ANALYSIS, 2025–2034, (USD MILLION)
FIGURE 110 REST OF SEA AND SOUTH ASIA PASTA AND NOODLES SYSTEM CURRENT AND FUTURE END USER ANALYSIS, 2025–2034, (USD MILLION)
FIGURE 111 MIDDLE EAST AND AFRICA PASTA AND NOODLES SYSTEM CURRENT AND FUTURE MARKET VOLUME SHARE REGIONAL ANALYSIS, 2025–2034, (USD MILLION)
FIGURE 112 GCC COUNTRIES PASTA AND NOODLES SYSTEM CURRENT AND FUTURE TYPE ANALYSIS, 2025–2034, (USD MILLION)
FIGURE 113 GCC COUNTRIES PASTA AND NOODLES SYSTEM CURRENT AND FUTURE END USER ANALYSIS, 2025–2034, (USD MILLION)
FIGURE 114 SAUDI ARABIA PASTA AND NOODLES SYSTEM CURRENT AND FUTURE TYPE ANALYSIS, 2025–2034, (USD MILLION)
FIGURE 115 SAUDI ARABIA PASTA AND NOODLES SYSTEM CURRENT AND FUTURE END USER ANALYSIS, 2025–2034, (USD MILLION)
FIGURE 116 UAE PASTA AND NOODLES SYSTEM CURRENT AND FUTURE TYPE ANALYSIS, 2025–2034, (USD MILLION)
FIGURE 117 UAE PASTA AND NOODLES SYSTEM CURRENT AND FUTURE END USER ANALYSIS, 2025–2034, (USD MILLION)
FIGURE 118 BAHRAIN PASTA AND NOODLES SYSTEM CURRENT AND FUTURE TYPE ANALYSIS, 2025–2034, (USD MILLION)
FIGURE 119 BAHRAIN PASTA AND NOODLES SYSTEM CURRENT AND FUTURE END USER ANALYSIS, 2025–2034, (USD MILLION)
FIGURE 120 KUWAIT PASTA AND NOODLES SYSTEM CURRENT AND FUTURE TYPE ANALYSIS, 2025–2034, (USD MILLION)
FIGURE 121 KUWAIT PASTA AND NOODLES SYSTEM CURRENT AND FUTURE END USER ANALYSIS, 2025–2034, (USD MILLION)
FIGURE 122 OMAN PASTA AND NOODLES SYSTEM CURRENT AND FUTURE TYPE ANALYSIS, 2025–2034, (USD MILLION)
FIGURE 123 OMAN PASTA AND NOODLES SYSTEM CURRENT AND FUTURE END USER ANALYSIS, 2025–2034, (USD MILLION)
FIGURE 124 QATAR PASTA AND NOODLES SYSTEM CURRENT AND FUTURE TYPE ANALYSIS, 2025–2034, (USD MILLION)
FIGURE 125 QATAR PASTA AND NOODLES SYSTEM CURRENT AND FUTURE END USER ANALYSIS, 2025–2034, (USD MILLION)
FIGURE 126 EGYPT PASTA AND NOODLES SYSTEM CURRENT AND FUTURE TYPE ANALYSIS, 2025–2034, (USD MILLION)
FIGURE 127 EGYPT PASTA AND NOODLES SYSTEM CURRENT AND FUTURE END USER ANALYSIS, 2025–2034, (USD MILLION)
FIGURE 128 NIGERIA PASTA AND NOODLES SYSTEM CURRENT AND FUTURE TYPE ANALYSIS, 2025–2034, (USD MILLION)
FIGURE 129 NIGERIA PASTA AND NOODLES SYSTEM CURRENT AND FUTURE END USER ANALYSIS, 2025–2034, (USD MILLION)
FIGURE 130 SOUTH AFRICA PASTA AND NOODLES SYSTEM CURRENT AND FUTURE TYPE ANALYSIS, 2025–2034, (USD MILLION)
FIGURE 131 SOUTH AFRICA PASTA AND NOODLES SYSTEM CURRENT AND FUTURE END USER ANALYSIS, 2025–2034, (USD MILLION)
FIGURE 132 ISRAEL PASTA AND NOODLES SYSTEM CURRENT AND FUTURE TYPE ANALYSIS, 2025–2034, (USD MILLION)
FIGURE 133 ISRAEL PASTA AND NOODLES SYSTEM CURRENT AND FUTURE END USER ANALYSIS, 2025–2034, (USD MILLION)
FIGURE 134 REST OF MEA PASTA AND NOODLES SYSTEM CURRENT AND FUTURE TYPE ANALYSIS, 2025–2034, (USD MILLION)
FIGURE 135 REST OF MEA PASTA AND NOODLES SYSTEM CURRENT AND FUTURE END USER ANALYSIS, 2025–2034, (USD MILLION)
FIGURE 136 U. S. MARKET SHARE ANALYSIS BY TYPE (2024)
FIGURE 137 U. S. MARKET SHARE ANALYSIS BY END USER (2024)
FIGURE 138 CANADA MARKET SHARE ANALYSIS BY TYPE (2024)
FIGURE 139 CANADA MARKET SHARE ANALYSIS BY END USER (2024)
FIGURE 140 MEXICO MARKET SHARE ANALYSIS BY TYPE (2024)
FIGURE 141 MEXICO MARKET SHARE ANALYSIS BY END USER (2024)
FIGURE 142 CHINA MARKET SHARE ANALYSIS BY TYPE (2024)
FIGURE 143 CHINA MARKET SHARE ANALYSIS BY END USER (2024)
FIGURE 144 JAPAN MARKET SHARE ANALYSIS BY TYPE (2024)
FIGURE 145 JAPAN MARKET SHARE ANALYSIS BY END USER (2024)
FIGURE 146 INDIA MARKET SHARE ANALYSIS BY TYPE (2024)
FIGURE 147 INDIA MARKET SHARE ANALYSIS BY END USER (2024)
FIGURE 148 SOUTH KOREA MARKET SHARE ANALYSIS BY TYPE (2024)
FIGURE 149 SOUTH KOREA MARKET SHARE ANALYSIS BY END USER (2024)
FIGURE 150 SAUDI ARABIA MARKET SHARE ANALYSIS BY TYPE (2024)
FIGURE 151 SAUDI ARABIA MARKET SHARE ANALYSIS BY END USER (2024)
FIGURE 152 UAE MARKET SHARE ANALYSIS BY TYPE (2024)
FIGURE 153 UAE MARKET SHARE ANALYSIS BY END USER (2024)
FIGURE 154 EGYPT MARKET SHARE ANALYSIS BY TYPE (2024)
FIGURE 155 EGYPT MARKET SHARE ANALYSIS BY END USER (2024)
FIGURE 156 NIGERIA MARKET SHARE ANALYSIS BY TYPE (2024)
FIGURE 157 NIGERIA MARKET SHARE ANALYSIS BY END USER (2024)
FIGURE 158 SOUTH AFRICA MARKET SHARE ANALYSIS BY TYPE (2024)
FIGURE 159 SOUTH AFRICA MARKET SHARE ANALYSIS BY END USER (2024)
FIGURE 160 GERMANY MARKET SHARE ANALYSIS BY TYPE (2024)
FIGURE 161 GERMANY MARKET SHARE ANALYSIS BY END USER (2024)
FIGURE 162 FRANCE MARKET SHARE ANALYSIS BY TYPE (2024)
FIGURE 163 FRANCE MARKET SHARE ANALYSIS BY END USER (2024)
FIGURE 164 UK MARKET SHARE ANALYSIS BY TYPE (2024)
FIGURE 165 UK MARKET SHARE ANALYSIS BY END USER (2024)
FIGURE 166 SPAIN MARKET SHARE ANALYSIS BY TYPE (2024)
FIGURE 167 SPAIN MARKET SHARE ANALYSIS BY END USER (2024)
FIGURE 168 ITALY MARKET SHARE ANALYSIS BY TYPE (2024)
FIGURE 169 ITALY MARKET SHARE ANALYSIS BY END USER (2024)
FIGURE 170 BRAZIL MARKET SHARE ANALYSIS BY TYPE (2024)
FIGURE 171 BRAZIL MARKET SHARE ANALYSIS BY END USER (2024)
FIGURE 172 ARGENTINA MARKET SHARE ANALYSIS BY TYPE (2024)
FIGURE 173 ARGENTINA MARKET SHARE ANALYSIS BY END USER (2024)
FIGURE 174 COLUMBIA MARKET SHARE ANALYSIS BY TYPE (2024)
FIGURE 175 COLUMBIA MARKET SHARE ANALYSIS BY END USER (2024)
FIGURE 176 GLOBAL PASTA AND NOODLES SYSTEM CURRENT AND FUTURE MARKET KEY COUNTRY LEVEL ANALYSIS, 2024–2034, (USD MILLION)
FIGURE 177 FINANCIAL OVERVIEW:
Key Player Analysis
Nestlé S.A.: A category leader across emerging markets, Nestlé leverages the Maggi platform (instant noodles, recipe mixes, meal kits) to pair everyday affordability with rapid flavor localization. As of 2025, the company benefits from strong positions in Asia and Africa—regions that collectively account for more than half of global noodle demand—while expanding microwaveable cups and fortified SKUs aimed at value-conscious, health-seeking consumers. E-commerce and quick-commerce partnerships are delivering mid-teens online growth in priority cities, supported by data-driven promo cadence and digital recipe ecosystems that lift repeat purchase.
Nestlé’s strategic focus centers on portfolio renovation (reduced sodium, whole-grain and high-fiber lines), line-speed investments for flexible packaging, and selective capacity additions in high-growth corridors (India, Southeast Asia). Fortification programs and compliance capabilities provide an edge with regulators and institutional buyers, while sustainability commitments (recyclable mono-material packs, energy-efficient plants) increasingly influence retailer shelf access and large tenders.
Barilla Group: Positioned as a global leader in dry pasta and an innovator in premium health-forward ranges, Barilla anchors the category’s value pool in Europe and North America. The company has scaled Protein+, whole-grain, and legume-based pastas—segments expanding at an estimated 6–8% CAGR through 2030—and continues to command price premiums of 10–20% versus standard lines. In 2025, Barilla’s vertically aligned durum wheat sourcing and milling network supports quality consistency and cost control amid commodity volatility.
Strategically, Barilla is deepening R&D in texture optimization for alternative flours, expanding recyclable/renewable packaging, and using precision marketing to trade shoppers up to specialty SKUs. Digital and D2C capabilities (including fresh and meal-solution adjacencies) help capture premium occasions, while retailer collaborations on shelf-ready packaging and planogram analytics improve rotation and margin density.
Nissin Foods: A category innovator and disruptor, Nissin continues to set the pace in instant formats with Cup Noodles and Top Ramen, combining quick preparation with bold, localized flavors. International businesses have delivered high-single to low-double digit growth in recent years, with 2025 priorities centered on baked/air-dried lines, reduced-sodium recipes, and microwave-ready formats that tap “convenience-plus” demand. Packaging shifts toward paper-based and recyclable solutions enhance sustainability credentials and retailer acceptance.
Nissin’s differentiators include fast-cycle flavor development using consumer analytics and AI, strong convenience-store and modern-trade execution in Japan and the U.S., and a manufacturing footprint optimized for short runs and seasonal/limited editions. These capabilities translate into superior SKU productivity, while collaborations with foodservice and co-branding initiatives keep the brand culturally relevant and price-resilient.
Unilever: Operating as a challenger with outsized influence on meal occasions, Unilever competes through Knorr (instant noodles in select markets, pasta sides, sauces, and seasonings) to drive household penetration and frequency in the category. In 2025, the company’s scale in flavor systems and culinary platforms underpins cross-selling: sauces and bouillons raise attachment to pasta and noodle baskets, while on-pack recipes and digital cooking assistants support conversion and repeat rates.
Strategically, Unilever is prioritizing portfolio simplification, sodium and additive reduction across Knorr ranges, and recyclable packaging aligned with large retailers’ sustainability scorecards. The company’s route-to-market strength in EMEA and Latin America—combined with data-led promotion planning and strong private-label collaboration experience—positions it to capture incremental value as online grocery for ambient meal solutions grows at a low-teens CAGR through the decade.
As of 2025, category momentum is anchored in “convenience-plus” consumption and broad retail access. Single-serve cups, microwaveable bowls, and ready-to-cook kits continue to pull new occasions into the pasta and noodles basket, with urban sell-through of convenience formats rising ~5% YoY and Asia Pacific sustaining scale demand (≈53% global share). Core shelf-stable lines (dried formats at ~52% share) enable pantry-stocking and cost-per-serve advantages, while premium cues—high-protein, whole grain, gluten-free—lift mix and pricing. Together, these dynamics support the market’s medium-term trajectory (~3.6% CAGR through 2034) and reward portfolios that blend speed (instant formats) with health-forward formulations and omnichannel availability.
Restraint:
Health Concerns and Cost Volatility Restrain Market Expansion
Health scrutiny around refined carbohydrates and sodium is creating measurable headwinds in developed markets. In North America and Europe, a rising share of consumers (≈20–25%) report moderating refined-carb intake, pressuring traditional wheat-based SKUs and elevating the bar for reformulation. Cost volatility compounds the challenge: swings in wheat and energy can expand COGS by 8–12% in tight quarters, translating into ~120–180 bps gross-margin compression for unhedged players. Tighter labeling and sodium targets add a further 2–3% to reformulation and packaging costs, forcing manufacturers to prioritize procurement hedging, pack-price architecture, and rapid iteration of better-for-you lines to defend profitability.
Opportunity:
High-Growth Opportunities in Plant-Based and Protein-Enhanced SKUs
Plant-based, gluten-free, and protein-enriched platforms represent the most attractive growth seam over 2025–2030. Legume-, quinoa-, and brown-rice–based pastas, along with air-dried and reduced-sodium noodle ranges, are expanding at an estimated 6–8% CAGR—2–3x the core category—supported by flexitarian adoption and willingness to pay 10–20% price premiums. At current baselines, this trajectory could unlock USD 8–12 billion in incremental global revenue by 2030, with outsized upside in APAC convenience channels and in Europe/North America through specialty retail and online D2C bundles. Strategically, winning propositions pair nutrient density (protein/fiber claims) with portion control and recyclable packaging, underpinned by co-manufacturing capacity for alternative flours.
Trend:
Tech-Driven Innovation and Sustainability Redefine Market Trends
A rapid shift toward tech-enabled innovation and sustainable operations is reshaping competitiveness. Market leaders are deploying AI/ML to localize flavors and optimize promo cadence, accelerating concept-to-shelf timelines and improving SKU productivity in modern trade and e-commerce. On the manufacturing side, smart drying, inline quality sensors, and automated packing are lifting yield and reducing labor intensity, while commitments to mono-material, recyclable packs and lower-energy processes are becoming table stakes for tenders and retail shelf space. Private label is simultaneously scaling higher-quality tiers—particularly in Europe—intensifying price/mix pressure and compelling brands to differentiate through functionality (protein+, whole grain), culinary collaborations, and premium instant formats growing at high-single to low-double digits.
Recent Developments
Dec 2024 – Barilla Group: Barilla converted the majority of its Italian domestic pallet flows to CHEP’s reusable pooling system, with targeted annual savings of ~3,700 tonnes CO₂, >290 tonnes of waste, and ~3,100 m³ of wood as the transition phases in from Feb 2025 (8-month completion plan). Strategic impact: Improves supply-chain efficiency and sustainability credentials while lowering logistics risk and costs in Barilla’s home market.
Feb 2025 – Ebro Foods: Reported FY2024 revenue of €3.14bn (+1.8% YoY) and net profit of €208m (+11.2%), with the pasta business up 6.1% and expansion momentum in Africa and Australia. Strategic impact: Reinforces pasta-led growth and geographic diversification, supporting margin resilience against private-label competition.
Apr 2025 – Nestlé (India): In its FY2024–25 update, Nestlé India flagged mid-single-digit growth in Prepared Dishes & Cooking Aids with MAGGI returning to volume growth, aided by portfolio renovation and route-to-market execution. Strategic impact: Re-acceleration in the core noodles franchise strengthens category leadership and underpins capacity planning in growth corridors.
Jul 2025 – Nissin Foods: Launched “Kanzen Meal,” the company’s first frozen meal lineup (e.g., Fettuccine Alfredo, Spaghetti Bolognese) at US$6.99–7.99 SRP, with initial rollouts in the U.S. West Coast and Southeast ahead of broader expansion through spring 2026; positioned as a critical pillar of growth. Strategic impact: Extends Nissin beyond ambient instant noodles into higher-value frozen meals, widening occasions and defending share as GLP-1 usage reshapes meal choices.
Sep 2025 – Indofood CBP (Indomie): Issued a statement confirming full compliance of Indomie instant noodles with BPOM (Indonesia) and Codex standards; products are made in facilities certified to ISO 22000/FSSC 22000. Strategic impact: Strengthens regulatory assurance and protects export market access following safety-related scrutiny in select markets.