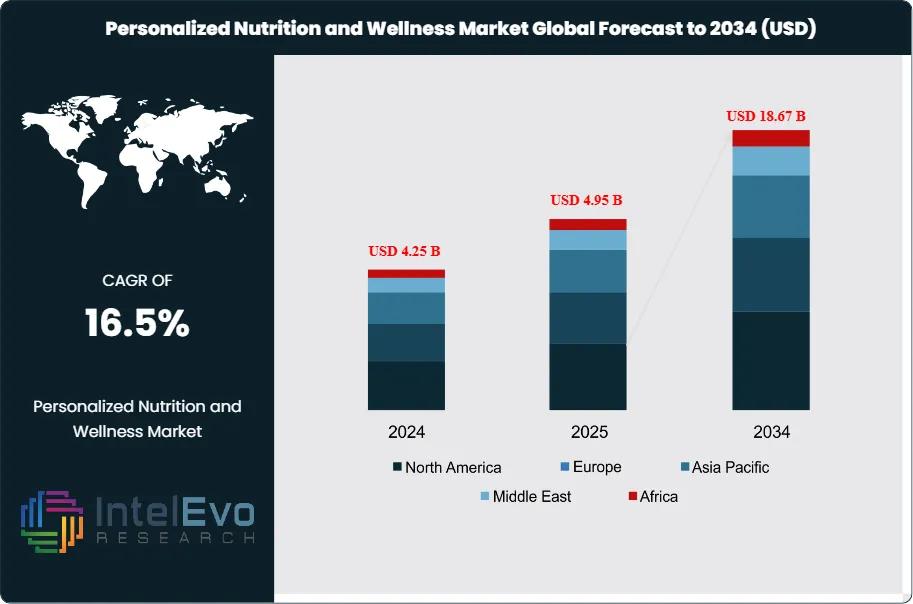
The Personalized Nutrition and Wellness Market size is projected to be worth around USD 18.67 billion by 2034, up from approximately USD 4.25 billion in 2024, growing at a CAGR of 16.5% during the forecast period from 2025 to 2034. This remarkable growth reflects the rising consumer demand for tailored dietary solutions, AI-driven health tracking, and genetic-based nutrition plans. With growing awareness around preventive healthcare and the integration of digital health platforms, personalized wellness is becoming a mainstream global movement driving the future of health innovation.
The Personalized Nutrition and Wellness Market focuses on providing tailored dietary and health solutions based on individual needs, preferences, and genetic profiles. This market has evolved in response to increasing consumer demand for personalized health and wellness options, facilitated by advancements in technology and digital health solutions. Currently valued at approximately USD 4.25 billion in 2024, the market is witnessing significant growth due to rising health consciousness and a shift toward preventive healthcare measures. Key market players are leveraging data analytics and genetic testing to offer customized nutrition plans and wellness products, addressing diverse consumer preferences across different demographics.
The growth dynamics of the Personalized Nutrition and Wellness Market are fueled by several factors. The increasing prevalence of lifestyle-related diseases, such as obesity and diabetes, drives consumers toward personalized health solutions to manage their health proactively. Furthermore, advancements in digital health technologies, including mobile apps and wearables, enhance consumer engagement and make personalized wellness solutions more accessible. Another significant driver is the rising awareness of nutrition's role in health maintenance, prompting individuals to seek tailored dietary options. As consumers become more informed about the benefits of personalized nutrition, they are more likely to invest in these products and services, fostering market growth.
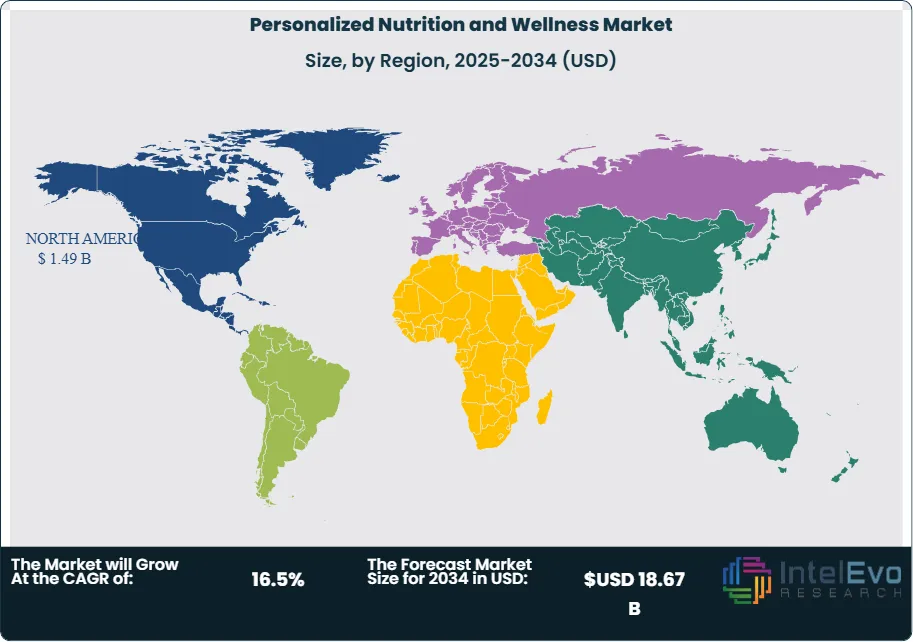
North America dominates the Personalized Nutrition and Wellness Market, driven by high consumer awareness and adoption of digital health tools. The U.S. is particularly influential due to its advanced healthcare infrastructure and a strong emphasis on health and wellness. Europe also presents substantial growth opportunities, with countries like the UK and Germany witnessing increasing consumer interest in personalized nutrition solutions. The Asia-Pacific region is anticipated to exhibit the fastest growth rate, attributed to rising disposable incomes, urbanization, and a growing prevalence of lifestyle diseases. Countries like China and India are experiencing a surge in demand for personalized health solutions, highlighting the region's potential.
The COVID-19 pandemic had a profound impact on the Personalized Nutrition and Wellness Market. The crisis heightened consumer awareness of health and wellness, leading to increased demand for personalized health solutions as individuals sought to boost their immunity and overall well-being. Lockdowns and social distancing measures accelerated the adoption of digital health technologies, as consumers turned to online platforms for health and nutrition guidance. This shift is expected to have lasting effects, as more individuals recognize the value of personalized approaches to health management in a post-pandemic world.
Key Takeaways:
Market Growth: The personalized nutrition and wellness market is expected to reach USD 18.67 billion by 2034, growing at a robust CAGR of 16.50%, indicating strong market expansion.
Type Segment Analysis: The market for personalized nutrition products is experiencing rapid growth, driven by increasing consumer demand for tailored health solutions that cater to individual dietary preferences and needs.
Distribution Channel Analysis: The online distribution channel is gaining prominence, as consumers increasingly turn to e-commerce platforms for personalized nutrition solutions, providing convenience and a wider range of options.
Driver: Rising health consciousness and an increased focus on preventive healthcare are driving demand for personalized nutrition solutions, as consumers seek ways to optimize their health and well-being.
Restraint: Limited awareness of personalized nutrition benefits among certain demographics may hinder market growth. Additionally, the higher cost of customized products could restrict accessibility for some consumers.
Opportunity: There is significant growth potential in emerging markets, particularly in Asia-Pacific, where rising disposable incomes and increasing health awareness present opportunities for personalized nutrition providers.
Trend: A growing trend towards integrating technology, such as mobile apps and wearables, is enhancing consumer engagement and personalizing health experiences.
Regional Analysis: North America is currently the dominant region in the market, driven by high consumer awareness and advanced healthcare infrastructure, while Asia-Pacific is expected to experience the fastest growth rate due to rising health consciousness.
Type:
The Type segment of the Personalized Nutrition and Wellness Market includes personalized nutrition products and personalized supplements. Personalized nutrition products are tailored food items designed to meet specific dietary needs based on individual health data, preferences, and goals. This segment is witnessing rapid growth as consumers increasingly seek customized solutions to address health concerns such as obesity, diabetes, and nutrient deficiencies. Personalized supplements, on the other hand, are formulated to complement individual dietary requirements and are often based on genetic testing or lifestyle analysis. As awareness around nutrition and health management increases, this segment is expected to expand significantly, driven by innovations in food technology and growing consumer preference for tailored health solutions.
Distribution Channel:
The Distribution Channel segment encompasses online and offline sales channels. Online distribution has gained substantial traction due to the rise of e-commerce and mobile shopping platforms, which provide consumers with easy access to a wide range of personalized nutrition products. This channel allows for greater convenience and often includes detailed product information, customer reviews, and tailored recommendations based on consumer profiles. In contrast, offline distribution, including retail stores and health food outlets, continues to play a significant role, especially for consumers who prefer to engage with products directly before purchase. As both channels evolve, companies are adopting omnichannel strategies to enhance customer experience and maximize market reach, catering to diverse consumer preferences.
Application:
The Application segment includes weight management, health management, fitness nutrition, and preventive healthcare. Weight management remains a prominent application, as personalized nutrition solutions help individuals achieve specific weight loss or maintenance goals through customized meal plans and supplements. Health management focuses on providing tailored dietary strategies to address chronic health conditions, including heart disease and diabetes, helping consumers improve their overall health. Fitness nutrition targets athletes and fitness enthusiasts seeking to enhance performance and recovery through personalized dietary interventions. Finally, preventive healthcare emphasizes the importance of nutrition in preventing illness, with tailored dietary advice aimed at promoting long-term wellness. This segment is growing rapidly, driven by increasing consumer awareness of the link between nutrition and health outcomes.
End User:
The End User segment comprises individual consumers and healthcare professionals. Individual consumers are the primary drivers of the personalized nutrition market, as they seek tailored health solutions to optimize their well-being and address specific health concerns. This group includes health-conscious individuals, athletes, and those managing chronic diseases. Healthcare professionals play a crucial role in this market by providing personalized dietary recommendations and endorsing specific products based on their patients' needs. As healthcare professionals increasingly recognize the benefits of personalized nutrition in clinical settings, their involvement is expected to grow, leading to more collaborative approaches in dietary management. This segment underscores the importance of personalized nutrition in both everyday life and professional healthcare environments.
Region Analysis:
North America Leads with 35% Market Share in the Personalized Nutrition and Wellness Market: North America currently dominates the Personalized Nutrition and Wellness Market, holding approximately 35% of the total market share. This dominance can be attributed to several factors, including a high level of health consciousness among consumers and advanced healthcare infrastructure. The presence of numerous established companies and innovative startups in the region has fostered a competitive environment, driving the development of new personalized nutrition products and technologies. Additionally, a strong emphasis on preventive healthcare and wellness is influencing consumer behavior, leading to increased investment in personalized nutrition solutions. The region's sophisticated distribution channels, particularly e-commerce platforms, also contribute to its substantial market share by providing consumers with easy access to tailored products.
Asia-Pacific is emerging as the fastest-growing region in the Personalized Nutrition and Wellness Market, with a projected growth rate exceeding 20% CAGR over the next decade. This rapid expansion is fueled by rising disposable incomes, increasing health awareness, and a growing prevalence of lifestyle-related diseases. Urbanization and changing dietary habits further contribute to the demand for personalized nutrition solutions in this region. Countries like China and India are witnessing significant shifts in consumer preferences, as individuals seek customized dietary plans to address specific health concerns. Additionally, the proliferation of technology, including mobile apps and online platforms for personalized nutrition, is enhancing consumer engagement and access to tailored health solutions. Other regions, such as Europe and Latin America, also show potential for growth, albeit at a slower pace compared to Asia-Pacific, as they continue to adapt to evolving consumer trends in health and wellness.
Customization for segments, region/country-level will be provided. Moreover, additional customization can be done based on the requirements.
Pricing and Purchase Options
Avail customized purchase options to meet your exact research needs. We have three licenses to opt for: Single User License, Multi-User License (Up to 5 Users), Corporate Use License (Unlimited User and Printable PDF).
TABLE OF CONTENTS
1. EXECUTIVE SUMMARY
1.1. MARKET SNAPSHOT
1.2. KEY FINDINGS & INSIGHTS
1.3. ANALYST RECOMMENDATIONS
1.4. FUTURE OUTLOOK
2. RESEARCH METHODOLOGY
2.1. MARKET DEFINITION & SCOPE
2.2. RESEARCH OBJECTIVES: PRIMARY & SECONDARY DATA SOURCES
2.3. DATA COLLECTION SOURCES
2.3.1. COVERAGE OF 100+ PRIMARY RESEARCH/CONSULTATION CALLS WITH INDUSTRY STAKEHOLDERS
FIGURE 17 NORTH AMERICA PERSONALIZED NUTRITION AND WELLNESS CURRENT AND FUTURE TYPE ANALYSIS, 2025–2034, (USD MILLION)
FIGURE 18 NORTH AMERICA PERSONALIZED NUTRITION AND WELLNESS CURRENT AND FUTURE END USER ANALYSIS, 2025–2034, (USD MILLION)
FIGURE 19 MARKET SHARE BY COUNTRY
FIGURE 20 LATIN AMERICA PERSONALIZED NUTRITION AND WELLNESS CURRENT AND FUTURE TYPE ANALYSIS, 2025–2034, (USD MILLION)
FIGURE 21 LATIN AMERICA PERSONALIZED NUTRITION AND WELLNESS CURRENT AND FUTURE END USER ANALYSIS, 2025–2034, (USD MILLION)
FIGURE 22 MARKET SHARE BY COUNTRY
FIGURE 23 EASTERN EUROPE PERSONALIZED NUTRITION AND WELLNESS CURRENT AND FUTURE TYPE ANALYSIS, 2025–2034, (USD MILLION)
FIGURE 24 EASTERN EUROPE PERSONALIZED NUTRITION AND WELLNESS CURRENT AND FUTURE END USER ANALYSIS, 2025–2034, (USD MILLION)
FIGURE 25 MARKET SHARE BY COUNTRY
FIGURE 26 WESTERN EUROPE PERSONALIZED NUTRITION AND WELLNESS CURRENT AND FUTURE TYPE ANALYSIS, 2025–2034, (USD MILLION)
FIGURE 27 WESTERN EUROPE PERSONALIZED NUTRITION AND WELLNESS CURRENT AND FUTURE END USER ANALYSIS, 2025–2034, (USD MILLION)
FIGURE 28 MARKET SHARE BY COUNTRY
FIGURE 29 EAST ASIA AND PACIFIC PERSONALIZED NUTRITION AND WELLNESS CURRENT AND FUTURE TYPE ANALYSIS, 2025–2034, (USD MILLION)
FIGURE 30 EAST ASIA AND PACIFIC PERSONALIZED NUTRITION AND WELLNESS CURRENT AND FUTURE END USER ANALYSIS, 2025–2034, (USD MILLION)
FIGURE 31 MARKET SHARE BY COUNTRY
FIGURE 32 SEA AND SOUTH ASIA PERSONALIZED NUTRITION AND WELLNESS CURRENT AND FUTURE TYPE ANALYSIS, 2025–2034, (USD MILLION)
FIGURE 33 SEA AND SOUTH ASIA PERSONALIZED NUTRITION AND WELLNESS CURRENT AND FUTURE END USER ANALYSIS, 2025–2034, (USD MILLION)
FIGURE 34 MARKET SHARE BY COUNTRY
FIGURE 35 MIDDLE EAST AND AFRICA PERSONALIZED NUTRITION AND WELLNESS CURRENT AND FUTURE TYPE ANALYSIS, 2025–2034, (USD MILLION)
FIGURE 36 MIDDLE EAST AND AFRICA PERSONALIZED NUTRITION AND WELLNESS CURRENT AND FUTURE END USER ANALYSIS, 2025–2034, (USD MILLION)
FIGURE 37 NORTH AMERICA PERSONALIZED NUTRITION AND WELLNESS CURRENT AND FUTURE MARKET VOLUME SHARE REGIONAL ANALYSIS, 2025–2034, (USD MILLION)
FIGURE 38 U.S. PERSONALIZED NUTRITION AND WELLNESS CURRENT AND FUTURE TYPE ANALYSIS, 2025–2034, (USD MILLION)
FIGURE 39 U.S. PERSONALIZED NUTRITION AND WELLNESS CURRENT AND FUTURE END USER ANALYSIS, 2025–2034, (USD MILLION)
FIGURE 40 CANADA PERSONALIZED NUTRITION AND WELLNESS CURRENT AND FUTURE TYPE ANALYSIS, 2025–2034, (USD MILLION)
FIGURE 41 CANADA PERSONALIZED NUTRITION AND WELLNESS CURRENT AND FUTURE END USER ANALYSIS, 2025–2034, (USD MILLION)
FIGURE 42 LATIN AMERICA PERSONALIZED NUTRITION AND WELLNESS CURRENT AND FUTURE MARKET VOLUME SHARE REGIONAL ANALYSIS, 2025–2034, (USD MILLION)
FIGURE 43 MEXICO PERSONALIZED NUTRITION AND WELLNESS CURRENT AND FUTURE TYPE ANALYSIS, 2025–2034, (USD MILLION)
FIGURE 44 MEXICO PERSONALIZED NUTRITION AND WELLNESS CURRENT AND FUTURE END USER ANALYSIS, 2025–2034, (USD MILLION)
FIGURE 45 BRAZIL PERSONALIZED NUTRITION AND WELLNESS CURRENT AND FUTURE TYPE ANALYSIS, 2025–2034, (USD MILLION)
FIGURE 46 BRAZIL PERSONALIZED NUTRITION AND WELLNESS CURRENT AND FUTURE END USER ANALYSIS, 2025–2034, (USD MILLION)
FIGURE 47 ARGENTINA PERSONALIZED NUTRITION AND WELLNESS CURRENT AND FUTURE TYPE ANALYSIS, 2025–2034, (USD MILLION)
FIGURE 48 ARGENTINA PERSONALIZED NUTRITION AND WELLNESS CURRENT AND FUTURE END USER ANALYSIS, 2025–2034, (USD MILLION)
FIGURE 49 COLUMBIA PERSONALIZED NUTRITION AND WELLNESS CURRENT AND FUTURE TYPE ANALYSIS, 2025–2034, (USD MILLION)
FIGURE 50 COLUMBIA PERSONALIZED NUTRITION AND WELLNESS CURRENT AND FUTURE END USER ANALYSIS, 2025–2034, (USD MILLION)
FIGURE 51 REST OF LATIN AMERICA PERSONALIZED NUTRITION AND WELLNESS CURRENT AND FUTURE TYPE ANALYSIS, 2025–2034, (USD MILLION)
FIGURE 52 REST OF LATIN AMERICA PERSONALIZED NUTRITION AND WELLNESS CURRENT AND FUTURE END USER ANALYSIS, 2025–2034, (USD MILLION)
FIGURE 53 EASTERN EUROPE PERSONALIZED NUTRITION AND WELLNESS CURRENT AND FUTURE MARKET VOLUME SHARE REGIONAL ANALYSIS, 2025–2034, (USD MILLION)
FIGURE 54 POLAND PERSONALIZED NUTRITION AND WELLNESS CURRENT AND FUTURE TYPE ANALYSIS, 2025–2034, (USD MILLION)
FIGURE 55 POLAND PERSONALIZED NUTRITION AND WELLNESS CURRENT AND FUTURE END USER ANALYSIS, 2025–2034, (USD MILLION)
FIGURE 56 RUSSIA PERSONALIZED NUTRITION AND WELLNESS CURRENT AND FUTURE TYPE ANALYSIS, 2025–2034, (USD MILLION)
FIGURE 57 RUSSIA PERSONALIZED NUTRITION AND WELLNESS CURRENT AND FUTURE END USER ANALYSIS, 2025–2034, (USD MILLION)
FIGURE 58 CZECH REPUBLIC PERSONALIZED NUTRITION AND WELLNESS CURRENT AND FUTURE TYPE ANALYSIS, 2025–2034, (USD MILLION)
FIGURE 59 CZECH REPUBLIC PERSONALIZED NUTRITION AND WELLNESS CURRENT AND FUTURE END USER ANALYSIS, 2025–2034, (USD MILLION)
FIGURE 60 ROMANIA PERSONALIZED NUTRITION AND WELLNESS CURRENT AND FUTURE TYPE ANALYSIS, 2025–2034, (USD MILLION)
FIGURE 61 ROMANIA PERSONALIZED NUTRITION AND WELLNESS CURRENT AND FUTURE END USER ANALYSIS, 2025–2034, (USD MILLION)
FIGURE 62 REST OF EASTERN EUROPE PERSONALIZED NUTRITION AND WELLNESS CURRENT AND FUTURE TYPE ANALYSIS, 2025–2034, (USD MILLION)
FIGURE 63 REST OF EASTERN EUROPE PERSONALIZED NUTRITION AND WELLNESS CURRENT AND FUTURE END USER ANALYSIS, 2025–2034, (USD MILLION)
FIGURE 64 WESTERN EUROPE PERSONALIZED NUTRITION AND WELLNESS CURRENT AND FUTURE MARKET VOLUME SHARE REGIONAL ANALYSIS, 2025–2034, (USD MILLION)
FIGURE 65 GERMANY PERSONALIZED NUTRITION AND WELLNESS CURRENT AND FUTURE TYPE ANALYSIS, 2025–2034, (USD MILLION)
FIGURE 66 GERMANY PERSONALIZED NUTRITION AND WELLNESS CURRENT AND FUTURE END USER ANALYSIS, 2025–2034, (USD MILLION)
FIGURE 67 FRANCE PERSONALIZED NUTRITION AND WELLNESS CURRENT AND FUTURE TYPE ANALYSIS, 2025–2034, (USD MILLION)
FIGURE 68 FRANCE PERSONALIZED NUTRITION AND WELLNESS CURRENT AND FUTURE END USER ANALYSIS, 2025–2034, (USD MILLION)
FIGURE 69 UK PERSONALIZED NUTRITION AND WELLNESS CURRENT AND FUTURE TYPE ANALYSIS, 2025–2034, (USD MILLION)
FIGURE 70 UK PERSONALIZED NUTRITION AND WELLNESS CURRENT AND FUTURE END USER ANALYSIS, 2025–2034, (USD MILLION)
FIGURE 71 SPAIN PERSONALIZED NUTRITION AND WELLNESS CURRENT AND FUTURE TYPE ANALYSIS, 2025–2034, (USD MILLION)
FIGURE 72 SPAIN PERSONALIZED NUTRITION AND WELLNESS CURRENT AND FUTURE END USER ANALYSIS, 2025–2034, (USD MILLION)
FIGURE 73 ITALY PERSONALIZED NUTRITION AND WELLNESS CURRENT AND FUTURE TYPE ANALYSIS, 2025–2034, (USD MILLION)
FIGURE 74 ITALY PERSONALIZED NUTRITION AND WELLNESS CURRENT AND FUTURE END USER ANALYSIS, 2025–2034, (USD MILLION)
FIGURE 75 REST OF WESTERN EUROPE PERSONALIZED NUTRITION AND WELLNESS CURRENT AND FUTURE TYPE ANALYSIS, 2025–2034, (USD MILLION)
FIGURE 76 REST OF WESTERN EUROPE PERSONALIZED NUTRITION AND WELLNESS CURRENT AND FUTURE END USER ANALYSIS, 2025–2034, (USD MILLION)
FIGURE 77 EAST ASIA AND PACIFIC PERSONALIZED NUTRITION AND WELLNESS CURRENT AND FUTURE MARKET VOLUME SHARE REGIONAL ANALYSIS, 2025–2034, (USD MILLION)
FIGURE 78 CHINA PERSONALIZED NUTRITION AND WELLNESS CURRENT AND FUTURE TYPE ANALYSIS, 2025–2034, (USD MILLION)
FIGURE 79 CHINA PERSONALIZED NUTRITION AND WELLNESS CURRENT AND FUTURE END USER ANALYSIS, 2025–2034, (USD MILLION)
FIGURE 80 JAPAN PERSONALIZED NUTRITION AND WELLNESS CURRENT AND FUTURE TYPE ANALYSIS, 2025–2034, (USD MILLION)
FIGURE 81 JAPAN PERSONALIZED NUTRITION AND WELLNESS CURRENT AND FUTURE END USER ANALYSIS, 2025–2034, (USD MILLION)
FIGURE 82 AUSTRALIA PERSONALIZED NUTRITION AND WELLNESS CURRENT AND FUTURE TYPE ANALYSIS, 2025–2034, (USD MILLION)
FIGURE 83 AUSTRALIA PERSONALIZED NUTRITION AND WELLNESS CURRENT AND FUTURE END USER ANALYSIS, 2025–2034, (USD MILLION)
FIGURE 84 CAMBODIA PERSONALIZED NUTRITION AND WELLNESS CURRENT AND FUTURE TYPE ANALYSIS, 2025–2034, (USD MILLION)
FIGURE 85 CAMBODIA PERSONALIZED NUTRITION AND WELLNESS CURRENT AND FUTURE END USER ANALYSIS, 2025–2034, (USD MILLION)
FIGURE 86 FIJI PERSONALIZED NUTRITION AND WELLNESS CURRENT AND FUTURE TYPE ANALYSIS, 2025–2034, (USD MILLION)
FIGURE 87 FIJI PERSONALIZED NUTRITION AND WELLNESS CURRENT AND FUTURE END USER ANALYSIS, 2025–2034, (USD MILLION)
FIGURE 88 INDONESIA PERSONALIZED NUTRITION AND WELLNESS CURRENT AND FUTURE TYPE ANALYSIS, 2025–2034, (USD MILLION)
FIGURE 89 INDONESIA PERSONALIZED NUTRITION AND WELLNESS CURRENT AND FUTURE END USER ANALYSIS, 2025–2034, (USD MILLION)
FIGURE 90 SOUTH KOREA PERSONALIZED NUTRITION AND WELLNESS CURRENT AND FUTURE TYPE ANALYSIS, 2025–2034, (USD MILLION)
FIGURE 91 SOUTH KOREA PERSONALIZED NUTRITION AND WELLNESS CURRENT AND FUTURE END USER ANALYSIS, 2025–2034, (USD MILLION)
FIGURE 92 REST OF EAST ASIA AND PACIFIC PERSONALIZED NUTRITION AND WELLNESS CURRENT AND FUTURE TYPE ANALYSIS, 2025–2034, (USD MILLION)
FIGURE 93 REST OF EAST ASIA AND PACIFIC PERSONALIZED NUTRITION AND WELLNESS CURRENT AND FUTURE END USER ANALYSIS, 2025–2034, (USD MILLION)
FIGURE 94 SEA AND SOUTH ASIA PERSONALIZED NUTRITION AND WELLNESS CURRENT AND FUTURE MARKET VOLUME SHARE REGIONAL ANALYSIS, 2025–2034, (USD MILLION)
FIGURE 95 BANGLADESH PERSONALIZED NUTRITION AND WELLNESS CURRENT AND FUTURE TYPE ANALYSIS, 2025–2034, (USD MILLION)
FIGURE 96 BANGLADESH PERSONALIZED NUTRITION AND WELLNESS CURRENT AND FUTURE END USER ANALYSIS, 2025–2034, (USD MILLION)
FIGURE 97 NEW ZEALAND PERSONALIZED NUTRITION AND WELLNESS CURRENT AND FUTURE TYPE ANALYSIS, 2025–2034, (USD MILLION)
FIGURE 98 NEW ZEALAND PERSONALIZED NUTRITION AND WELLNESS CURRENT AND FUTURE END USER ANALYSIS, 2025–2034, (USD MILLION)
FIGURE 99 INDIA PERSONALIZED NUTRITION AND WELLNESS CURRENT AND FUTURE TYPE ANALYSIS, 2025–2034, (USD MILLION)
FIGURE 100 INDIA PERSONALIZED NUTRITION AND WELLNESS CURRENT AND FUTURE END USER ANALYSIS, 2025–2034, (USD MILLION)
FIGURE 101 SINGAPORE PERSONALIZED NUTRITION AND WELLNESS CURRENT AND FUTURE TYPE ANALYSIS, 2025–2034, (USD MILLION)
FIGURE 102 SINGAPORE PERSONALIZED NUTRITION AND WELLNESS CURRENT AND FUTURE END USER ANALYSIS, 2025–2034, (USD MILLION)
FIGURE 103 THAILAND PERSONALIZED NUTRITION AND WELLNESS CURRENT AND FUTURE TYPE ANALYSIS, 2025–2034, (USD MILLION)
FIGURE 104 THAILAND PERSONALIZED NUTRITION AND WELLNESS CURRENT AND FUTURE END USER ANALYSIS, 2025–2034, (USD MILLION)
FIGURE 105 TAIWAN PERSONALIZED NUTRITION AND WELLNESS CURRENT AND FUTURE TYPE ANALYSIS, 2025–2034, (USD MILLION)
FIGURE 106 TAIWAN PERSONALIZED NUTRITION AND WELLNESS CURRENT AND FUTURE END USER ANALYSIS, 2025–2034, (USD MILLION)
FIGURE 107 MALAYSIA PERSONALIZED NUTRITION AND WELLNESS CURRENT AND FUTURE TYPE ANALYSIS, 2025–2034, (USD MILLION)
FIGURE 108 MALAYSIA PERSONALIZED NUTRITION AND WELLNESS CURRENT AND FUTURE END USER ANALYSIS, 2025–2034, (USD MILLION)
FIGURE 109 REST OF SEA AND SOUTH ASIA PERSONALIZED NUTRITION AND WELLNESS CURRENT AND FUTURE TYPE ANALYSIS, 2025–2034, (USD MILLION)
FIGURE 110 REST OF SEA AND SOUTH ASIA PERSONALIZED NUTRITION AND WELLNESS CURRENT AND FUTURE END USER ANALYSIS, 2025–2034, (USD MILLION)
FIGURE 111 MIDDLE EAST AND AFRICA PERSONALIZED NUTRITION AND WELLNESS CURRENT AND FUTURE MARKET VOLUME SHARE REGIONAL ANALYSIS, 2025–2034, (USD MILLION)
FIGURE 112 GCC COUNTRIES PERSONALIZED NUTRITION AND WELLNESS CURRENT AND FUTURE TYPE ANALYSIS, 2025–2034, (USD MILLION)
FIGURE 113 GCC COUNTRIES PERSONALIZED NUTRITION AND WELLNESS CURRENT AND FUTURE END USER ANALYSIS, 2025–2034, (USD MILLION)
FIGURE 114 SAUDI ARABIA PERSONALIZED NUTRITION AND WELLNESS CURRENT AND FUTURE TYPE ANALYSIS, 2025–2034, (USD MILLION)
FIGURE 115 SAUDI ARABIA PERSONALIZED NUTRITION AND WELLNESS CURRENT AND FUTURE END USER ANALYSIS, 2025–2034, (USD MILLION)
FIGURE 116 UAE PERSONALIZED NUTRITION AND WELLNESS CURRENT AND FUTURE TYPE ANALYSIS, 2025–2034, (USD MILLION)
FIGURE 117 UAE PERSONALIZED NUTRITION AND WELLNESS CURRENT AND FUTURE END USER ANALYSIS, 2025–2034, (USD MILLION)
FIGURE 118 BAHRAIN PERSONALIZED NUTRITION AND WELLNESS CURRENT AND FUTURE TYPE ANALYSIS, 2025–2034, (USD MILLION)
FIGURE 119 BAHRAIN PERSONALIZED NUTRITION AND WELLNESS CURRENT AND FUTURE END USER ANALYSIS, 2025–2034, (USD MILLION)
FIGURE 120 KUWAIT PERSONALIZED NUTRITION AND WELLNESS CURRENT AND FUTURE TYPE ANALYSIS, 2025–2034, (USD MILLION)
FIGURE 121 KUWAIT PERSONALIZED NUTRITION AND WELLNESS CURRENT AND FUTURE END USER ANALYSIS, 2025–2034, (USD MILLION)
FIGURE 122 OMAN PERSONALIZED NUTRITION AND WELLNESS CURRENT AND FUTURE TYPE ANALYSIS, 2025–2034, (USD MILLION)
FIGURE 123 OMAN PERSONALIZED NUTRITION AND WELLNESS CURRENT AND FUTURE END USER ANALYSIS, 2025–2034, (USD MILLION)
FIGURE 124 QATAR PERSONALIZED NUTRITION AND WELLNESS CURRENT AND FUTURE TYPE ANALYSIS, 2025–2034, (USD MILLION)
FIGURE 125 QATAR PERSONALIZED NUTRITION AND WELLNESS CURRENT AND FUTURE END USER ANALYSIS, 2025–2034, (USD MILLION)
FIGURE 126 EGYPT PERSONALIZED NUTRITION AND WELLNESS CURRENT AND FUTURE TYPE ANALYSIS, 2025–2034, (USD MILLION)
FIGURE 127 EGYPT PERSONALIZED NUTRITION AND WELLNESS CURRENT AND FUTURE END USER ANALYSIS, 2025–2034, (USD MILLION)
FIGURE 128 NIGERIA PERSONALIZED NUTRITION AND WELLNESS CURRENT AND FUTURE TYPE ANALYSIS, 2025–2034, (USD MILLION)
FIGURE 129 NIGERIA PERSONALIZED NUTRITION AND WELLNESS CURRENT AND FUTURE END USER ANALYSIS, 2025–2034, (USD MILLION)
FIGURE 130 SOUTH AFRICA PERSONALIZED NUTRITION AND WELLNESS CURRENT AND FUTURE TYPE ANALYSIS, 2025–2034, (USD MILLION)
FIGURE 131 SOUTH AFRICA PERSONALIZED NUTRITION AND WELLNESS CURRENT AND FUTURE END USER ANALYSIS, 2025–2034, (USD MILLION)
FIGURE 132 ISRAEL PERSONALIZED NUTRITION AND WELLNESS CURRENT AND FUTURE TYPE ANALYSIS, 2025–2034, (USD MILLION)
FIGURE 133 ISRAEL PERSONALIZED NUTRITION AND WELLNESS CURRENT AND FUTURE END USER ANALYSIS, 2025–2034, (USD MILLION)
FIGURE 134 REST OF MEA PERSONALIZED NUTRITION AND WELLNESS CURRENT AND FUTURE TYPE ANALYSIS, 2025–2034, (USD MILLION)
FIGURE 135 REST OF MEA PERSONALIZED NUTRITION AND WELLNESS CURRENT AND FUTURE END USER ANALYSIS, 2025–2034, (USD MILLION)
FIGURE 136 U. S. MARKET SHARE ANALYSIS BY TYPE (2024)
FIGURE 137 U. S. MARKET SHARE ANALYSIS BY END USER (2024)
FIGURE 138 CANADA MARKET SHARE ANALYSIS BY TYPE (2024)
FIGURE 139 CANADA MARKET SHARE ANALYSIS BY END USER (2024)
FIGURE 140 MEXICO MARKET SHARE ANALYSIS BY TYPE (2024)
FIGURE 141 MEXICO MARKET SHARE ANALYSIS BY END USER (2024)
FIGURE 142 CHINA MARKET SHARE ANALYSIS BY TYPE (2024)
FIGURE 143 CHINA MARKET SHARE ANALYSIS BY END USER (2024)
FIGURE 144 JAPAN MARKET SHARE ANALYSIS BY TYPE (2024)
FIGURE 145 JAPAN MARKET SHARE ANALYSIS BY END USER (2024)
FIGURE 146 INDIA MARKET SHARE ANALYSIS BY TYPE (2024)
FIGURE 147 INDIA MARKET SHARE ANALYSIS BY END USER (2024)
FIGURE 148 SOUTH KOREA MARKET SHARE ANALYSIS BY TYPE (2024)
FIGURE 149 SOUTH KOREA MARKET SHARE ANALYSIS BY END USER (2024)
FIGURE 150 SAUDI ARABIA MARKET SHARE ANALYSIS BY TYPE (2024)
FIGURE 151 SAUDI ARABIA MARKET SHARE ANALYSIS BY END USER (2024)
FIGURE 152 UAE MARKET SHARE ANALYSIS BY TYPE (2024)
FIGURE 153 UAE MARKET SHARE ANALYSIS BY END USER (2024)
FIGURE 154 EGYPT MARKET SHARE ANALYSIS BY TYPE (2024)
FIGURE 155 EGYPT MARKET SHARE ANALYSIS BY END USER (2024)
FIGURE 156 NIGERIA MARKET SHARE ANALYSIS BY TYPE (2024)
FIGURE 157 NIGERIA MARKET SHARE ANALYSIS BY END USER (2024)
FIGURE 158 SOUTH AFRICA MARKET SHARE ANALYSIS BY TYPE (2024)
FIGURE 159 SOUTH AFRICA MARKET SHARE ANALYSIS BY END USER (2024)
FIGURE 160 GERMANY MARKET SHARE ANALYSIS BY TYPE (2024)
FIGURE 161 GERMANY MARKET SHARE ANALYSIS BY END USER (2024)
FIGURE 162 FRANCE MARKET SHARE ANALYSIS BY TYPE (2024)
FIGURE 163 FRANCE MARKET SHARE ANALYSIS BY END USER (2024)
FIGURE 164 UK MARKET SHARE ANALYSIS BY TYPE (2024)
FIGURE 165 UK MARKET SHARE ANALYSIS BY END USER (2024)
FIGURE 166 SPAIN MARKET SHARE ANALYSIS BY TYPE (2024)
FIGURE 167 SPAIN MARKET SHARE ANALYSIS BY END USER (2024)
FIGURE 168 ITALY MARKET SHARE ANALYSIS BY TYPE (2024)
FIGURE 169 ITALY MARKET SHARE ANALYSIS BY END USER (2024)
FIGURE 170 BRAZIL MARKET SHARE ANALYSIS BY TYPE (2024)
FIGURE 171 BRAZIL MARKET SHARE ANALYSIS BY END USER (2024)
FIGURE 172 ARGENTINA MARKET SHARE ANALYSIS BY TYPE (2024)
FIGURE 173 ARGENTINA MARKET SHARE ANALYSIS BY END USER (2024)
FIGURE 174 COLUMBIA MARKET SHARE ANALYSIS BY TYPE (2024)
FIGURE 175 COLUMBIA MARKET SHARE ANALYSIS BY END USER (2024)
FIGURE 176 GLOBAL PERSONALIZED NUTRITION AND WELLNESS CURRENT AND FUTURE MARKET KEY COUNTRY LEVEL ANALYSIS, 2024–2034, (USD MILLION)
FIGURE 177 FINANCIAL OVERVIEW:
Key Players Analysis:
Nutrigenomix Inc.: Nutrigenomix specializes in personalized nutrition by leveraging genetic testing. Their services include DNA testing to provide insights on nutrition and fitness, allowing tailored dietary recommendations. Headquartered in Toronto, Canada, their strategy focuses on research and partnerships with healthcare professionals to promote personalized dietary solutions globally, enhancing the efficacy of nutrition interventions.
Herbalife Nutrition Ltd.: Herbalife is a global nutrition company offering meal replacement shakes, protein snacks, and dietary supplements. Founded in Los Angeles, California, their business model relies on a direct-selling approach, empowering independent distributors. Herbalife emphasizes personalized nutrition by providing tailored product recommendations and support, targeting health-conscious consumers worldwide.
Amway Corp.: Amway, based in Ada, Michigan, offers a wide range of health, beauty, and home products, including personalized nutrition solutions like Nutrilite. Their business strategy focuses on direct selling and empowering individuals to start their own businesses. Amway provides personalized recommendations through its online platform, addressing the specific needs of consumers.
BistroMD: BistroMD provides gourmet meal delivery services focused on weight management and health improvement. Their meals are developed by registered dietitians and chefs, ensuring nutritional balance. Based in Fort Myers, Florida, BistroMD's strategy includes personalized meal plans tailored to individual dietary preferences and health goals, catering to various dietary restrictions.
Nutritional Growth Solutions Ltd.: Nutritional Growth Solutions focuses on personalized nutrition for children, offering products like protein bars and shakes specifically formulated to support healthy growth. The company is headquartered in Australia and emphasizes partnerships with healthcare professionals to ensure that their products are backed by scientific research. Their strategy includes expanding market reach through targeted marketing.
Persona Nutrition: Persona Nutrition, based in San Francisco, offers personalized vitamin packs tailored to individual health needs and preferences. They utilize an online questionnaire to assess dietary habits and health goals, delivering customized vitamin solutions. Their strategy focuses on convenience and personalization, aiming to enhance consumer engagement through a subscription-based model.
GenoPalate: GenoPalate specializes in personalized nutrition based on DNA analysis. By providing consumers with genetic insights into their dietary needs, GenoPalate offers tailored meal plans and food recommendations. Located in Madison, Wisconsin, their business strategy emphasizes education and empowerment, helping individuals make informed dietary choices based on their genetic predispositions.
Zoe: Zoe is a health technology company that focuses on personalized nutrition through gut microbiome analysis and blood sugar responses. They offer an app that helps users understand their unique metabolic responses to food. Based in London, UK, their strategy revolves around data-driven insights, allowing consumers to make informed dietary choices based on personal data.
Vitl: Vitl provides personalized vitamin subscriptions based on individual health assessments and DNA testing. Their services include tailored supplement packs delivered directly to consumers. Headquartered in the UK, Vitl's strategy includes using technology and personalization to simplify the supplement experience, focusing on quality ingredients and customer satisfaction.
Thryve: Thryve offers personalized probiotic solutions based on gut microbiome analysis. Their services include home testing kits to analyze gut health, providing tailored probiotic recommendations. Based in Los Angeles, California, Thryve's strategy emphasizes health education and empowerment, promoting gut health as essential to overall wellness through personalized solutions.
Market Key Players
Nutrigenomix Inc.
Herbalife Nutrition Ltd.
Amway Corp.
BistroMD
Nutritional Growth Solutions Ltd.
Persona Nutrition
GenoPalate
Zoe
Vitl
Thryve
Everlywell
Nourished
Care/of
Hum Nutrition
Smile Direct Club, Inc.
WellPath
Maven Clinic
Weight Watchers (WW)
Ritual
MyFitnessPal
Driver:
Rising Health Consciousness
Growing awareness about the importance of nutrition and its direct impact on health has been a significant driver of the Personalized Nutrition and Wellness Market. Consumers are increasingly seeking tailored dietary solutions to address specific health concerns, such as obesity, diabetes, and heart disease. This shift towards health consciousness is supported by the widespread availability of health information through digital platforms and social media, empowering individuals to make informed dietary choices. Additionally, the COVID-19 pandemic has further heightened awareness regarding personal health and wellness, leading to a surge in demand for personalized nutrition products. As consumers prioritize their well-being, the market is expected to witness robust growth fueled by this trend toward health-centric living.
Technological Advancements
Innovations in technology are driving the Personalized Nutrition and Wellness Market by facilitating the development of tailored nutrition solutions. The advent of genetic testing, biomarker analysis, and artificial intelligence has enabled consumers to gain insights into their unique nutritional needs. Mobile applications and wearable devices also play a crucial role in collecting real-time health data, allowing for more personalized dietary recommendations. Companies are leveraging these technological advancements to create customized meal plans, supplements, and other health products tailored to individual preferences and health conditions. As technology continues to evolve, it is expected to enhance the accuracy and effectiveness of personalized nutrition solutions, thereby attracting more consumers to the market.
Growing Demand for Preventive Healthcare
The increasing focus on preventive healthcare is a critical driver of the Personalized Nutrition and Wellness Market. Consumers are becoming more proactive about their health, seeking ways to prevent diseases rather than simply treating them after they occur. Personalized nutrition plays a vital role in this approach, as it allows individuals to tailor their diets to address specific health risks and enhance their overall well-being. Healthcare professionals are also recognizing the value of personalized nutrition in clinical settings, leading to greater endorsement and integration of these solutions into routine healthcare practices. This growing emphasis on prevention is expected to boost demand for personalized nutrition products, contributing to the market's growth.
Restraints:
Limited Awareness and Education
Despite the growing interest in personalized nutrition, limited awareness and education among consumers can hinder market growth. Many individuals may not fully understand the benefits of personalized nutrition or how to effectively utilize these products and services. This lack of knowledge can lead to skepticism or reluctance to invest in personalized solutions. Moreover, consumers may face challenges in distinguishing between legitimate personalized nutrition offerings and those that are misleading or lack scientific backing. To overcome this restraint, companies must focus on consumer education and awareness campaigns to inform potential customers about the advantages and importance of personalized nutrition. Without proper understanding, the potential for market expansion may be limited.
High Cost of Personalized Solutions
The cost associated with personalized nutrition products and services can be a significant restraint for many consumers. Customized meal plans, genetic testing, and tailored supplements often come with a higher price tag compared to standard nutrition products. This pricing barrier can restrict access to personalized solutions for low- to middle-income consumers, limiting the overall market size. Furthermore, some consumers may perceive these products as a luxury rather than a necessity, leading to reduced adoption rates. To address this restraint, companies could explore strategies to make personalized nutrition solutions more affordable, such as offering tiered pricing models or subscription services that provide cost-effective access to tailored health solutions.
Opportunities:
Expansion into Emerging Markets
Emerging markets present a significant opportunity for growth in the Personalized Nutrition and Wellness Market. As disposable incomes rise and urbanization increases in regions like Asia-Pacific and Latin America, consumers are becoming more health-conscious and willing to invest in personalized health solutions. The increasing prevalence of lifestyle diseases in these regions also drives demand for tailored nutrition products. Companies can capitalize on this opportunity by developing targeted marketing strategies that cater to local preferences and health needs. By establishing a presence in emerging markets, businesses can tap into a growing consumer base and significantly enhance their market share.
Integration with Digital Health Platforms
The integration of personalized nutrition with digital health platforms is another promising opportunity in the market. As telehealth and digital health solutions become increasingly popular, there is potential for personalized nutrition providers to collaborate with these platforms to offer comprehensive health management services. By combining personalized dietary recommendations with remote health monitoring and teleconsultations, companies can provide consumers with a holistic approach to their health and wellness. This integration not only enhances the value proposition for consumers but also helps companies leverage technology to expand their reach and improve customer engagement, driving further growth in the market.
Trends:
Rise of Personalized Nutrition Apps
One significant trend in the Personalized Nutrition and Wellness Market is the rise of mobile applications dedicated to personalized nutrition. These apps enable users to track their dietary habits, monitor health metrics, and receive tailored meal recommendations based on their specific needs and goals. The convenience and accessibility of these digital tools are appealing to tech-savvy consumers who seek customized solutions to improve their health. Furthermore, advancements in artificial intelligence and machine learning are enhancing the accuracy of these apps, providing users with more relevant insights and recommendations. As the demand for personalized health solutions continues to grow, the proliferation of nutrition apps is expected to shape the future of the market significantly.
Recent Development:
In August 2023: Qina consultancy released a report highlighting significant trends in personalized nutrition, emphasizing the entry of major tech companies like Google and Apple into the market. These firms are forming partnerships with healthcare providers to offer personalized health recommendations based on user data. Google Health is particularly focused on empowering consumers with health information through technology solutions that enhance care delivery and health insights.
In October 2023: Google announced a collaboration with several health and fitness app developers, including MyFitnessPal and Oura, to launch the Google Health Connect App. This new platform enables users to integrate and manage their health data across multiple applications, enhancing personalized health management while prioritizing user privacy.