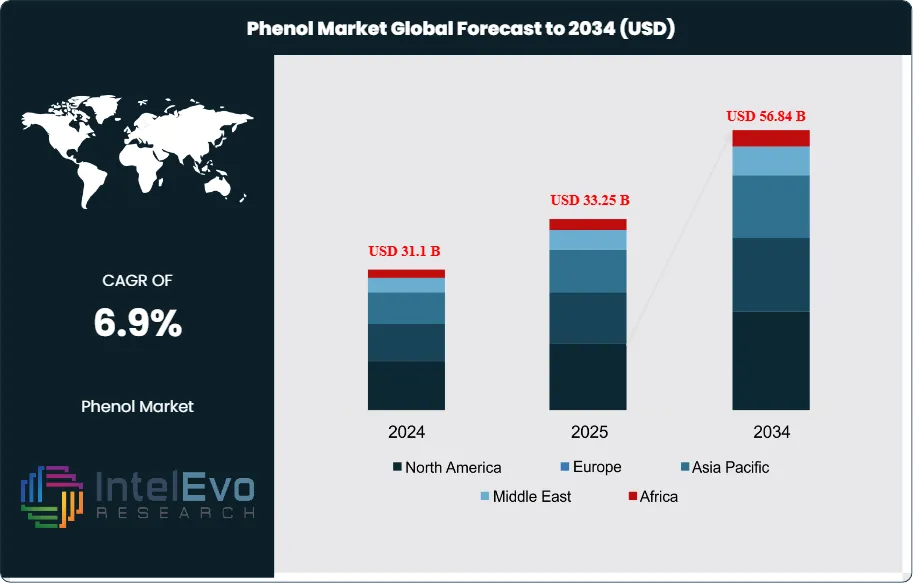
The Phenol Market was valued at approximately USD 31.1 Billion in 2024 and is projected to reach nearly USD 56.84 Billion by 2034, growing at an estimated CAGR of around 6.9% from 2025 to 2034. Rising demand from the automotive, construction, and electronics sectors is accelerating phenol consumption worldwide. Increased production of BPA, epoxy resins, and polycarbonate materials continues to strengthen market growth. With rapid industrial expansion across Asia-Pacific, the phenol industry is set for a high-demand decade, driven by manufacturing modernization and downstream chemical innovations.
Market development is closely linked to downstream demand for bisphenol-A (BPA) and phenolic resins—together typically absorbing ~75–80% of phenol consumption—feeding polycarbonate, epoxy, laminates, and high-performance adhesives used across automotive, electronics, and construction. After pandemic-era and energy-price volatility compressed trade values in 2022 (global phenols trade fell 11.5% year over year to USD 7.57 billion), ordering patterns normalized through 2024–2025 as inventories reset and capital spending resumed in autos and infrastructure. Operating rates in integrated cumene-phenol complexes are expected to firm toward the low-80% range by mid-decade, supported by project restarts and selective debottlenecking.
Growth into 2025 is underpinned by three demand vectors: the recovery of transportation and building materials, the electronics cycle (polycarbonate lenses, housings, and films), and epoxy use in renewables and protective coatings. On the supply side, cost competitiveness favors producers integrated to benzene and propylene, especially where PDH and refinery upgrades stabilize propylene availability. Key risks include regulatory scrutiny of BPA in food-contact applications (tightening migration limits raise qualification costs), volatile aromatics spreads tied to crude and naphtha swings, and carbon-intensity expectations that elevate energy and compliance outlays. Trade data highlight shifting regional roles: Chinese Taipei has acted as a leading net exporter (about USD 0.5 billion), while China remains the principal net importer (~USD 1.0 billion), with India balancing rising domestic capacity against steady import needs.
Technology and process enhancements continue to shape competitiveness. The cumene route remains dominant, but catalyst upgrades (advanced zeolites), heat-integration, and digital plant optimization are reducing unit energy by low-single-digit percentages and improving acetone co-product valorization. Early pilots in bio-based phenol and chemical recycling of phenol-rich waste streams signal a longer-term pathway to Scope 1–3 reductions and premium, low-carbon grades, particularly attractive to electronics and automotive OEMs with procurement targets. Regionally, Asia Pacific accounts for an estimated 50–55% of demand and remains the investment hotspot as China, India, and Southeast Asia expand polycarbonate and epoxy capacity. North America benefits from reliable benzene/propylene chains on the U.S. Gulf Coast, while Europe’s specialty resins and sustainability standards command higher-value niches despite tighter regulations. The Middle East is emerging with integrated aromatics platforms, and India’s resilient trade profile—exports around USD 0.3 billion against moderated imports—points to a gradual shift toward self-sufficiency.
Key Takeaways
Market Growth: The global Phenol market was USD 31.1 Billion in 2024 and is projected to reach USD 56.84 Billion by 2034 (6.9% CAGR), propelled by downstream demand in bisphenol-A (BPA) for polycarbonates/epoxies and phenolic resins used across automotive, construction, and electronics.
Segment Dominance – Production Route: Cumene process leads with ~45.3% share, favored for its mature technology, acetone co-product economics, and integration with benzene/propylene chains; producers with backward integration (e.g., INEOS Phenol, Kumho P&B, Mitsui) benefit from margin stability and feedstock flexibility.
Segment Dominance – Application: Bisphenol-A (BPA)remains the largest application at ~41.3% of phenol consumption, underpinned by polycarbonate and epoxy demand in vehicle light-weighting, electronics housings, and protective coatings; cyclicality tracks capex in construction and electrical/electronics.
Driver: Rebound in end-use manufacturing—auto builds, infrastructure coatings, and electronics—coupled with capacity debottlenecking and yield gains (1–3% efficiency improvements via catalyst/heat-integration upgrades) is lifting plant operating rates and sustaining multi-year offtake contracts.
Restraint: Regulatory scrutiny of BPA in food-contact and consumer applications, alongside volatile aromatics spreads (benzene/propylene), is compressing margins; compliance, product re-qualification, and ESG reporting can add an estimated 50–150 bps to unit costs for exporters into the EU/US.
Opportunity: Asia Pacific capacity additions and downstream integration present the highest incremental upside; BPA/epoxy growth and cost-advantaged cumene units position the region to outpace the global market, with select APAC projects expected to deliver mid-single-digit ROI improvements on energy-intensity cuts.
Trend: Producers are pivoting to low-carbon and circular phenol—including bio-routes, waste-stream recovery, and digital optimization—aiming to reduce Scope 1–2 emissions and capture premium pricing in specialty resins; indirect sales models (54.3% share) are being augmented with data-driven contracting and hedging.
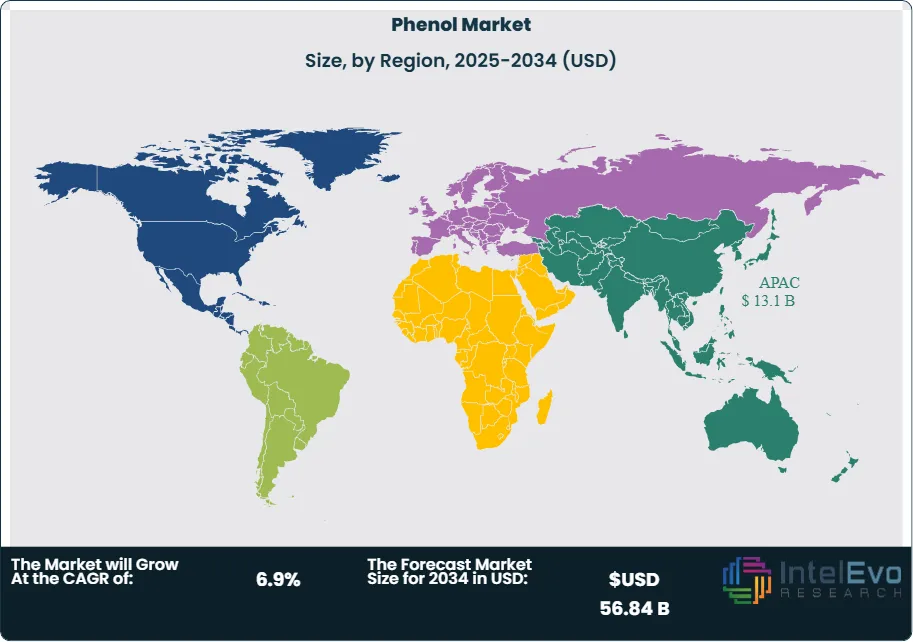
Regional Analysis:Asia Pacific holds the largest share at ~46.2% (≈USD 13.1 billion of 2024 demand), supported by integrated aromatics and growing resin capacity; North America and Europe remain sizable, higher-value markets with specialty niches but tighter regulations, while the Middle East builds export-oriented phenol/acetone platforms to leverage feedstock advantages.
Manufacturing Process Analysis
As of 2025, the cumene process remains the industry workhorse, accounting for roughly 45–50% of global phenol output. Its dominance stems from mature technology, favorable co-product acetone economics, and tight integration with benzene/propylene value chains—especially in complexes linked to PDH and refinery upgrades. Ongoing catalyst and heat-integration enhancements are delivering 1–3% energy-intensity reductions and modest yield gains, while digital twins and APC (advanced process control) shorten turnaround cycles and stabilize operating rates in the low-80% range.
Legacy chlorobenzene routes—the Dow and Raschig–Hooker processes—retain niche shares where ultra-high-purity grades or site-specific feedstock synergies justify higher capex/opex and waste-handling requirements. These assets increasingly target specialty derivatives and “secure supply” contracts. Over 2025–2030, incremental capacity is expected to skew to APAC and the Middle East via new cumene lines, with selective debottlenecking of chlorobenzene plants to serve premium segments and diversify risk under tighter sustainability rules.
Application Analysis
Bisphenol-A (BPA) remains the largest outlet, representing about 41.3% of phenol consumption, anchored in polycarbonate and epoxy systems for automotive light-weighting, electronics housings/films, glazing, wind blades, and protective coatings. Despite regulatory scrutiny in food-contact uses, industrial and infrastructure demand keeps BPA volumes on a mid-single-digit growth path, supported by BPA-NI epoxy adoption in sensitive applications.
Phenolic resins are the second growth pillar, benefiting from building-efficiency codes (insulation, laminates) and safety-critical uses (brake pads, foundry binders), with suppliers pushing low free-formaldehyde and low-carbon grades. Caprolactam (via phenol → cyclohexanone routes) serves nylon-6 fibers and engineering plastics in textiles and auto components, with cyclical but resilient demand tied to apparel and tire cord. “Others” (pharma, agro, specialty solvents) provide margin diversity and niche premium pricing.
End-Use Analysis
The chemical sector leads end-use, consuming about 36% of phenol as an intermediate for BPA, phenolic resins, adipic/cyclohexanone chains, and specialty derivatives. Scale integration, multi-year offtakes, and index-linked contracts underpin utilization and margin durability.
Construction and automotive together form the next demand block, relying on phenolic resins for adhesives, insulation, and friction materials, and on BPA-derived polycarbonate/epoxies for light-weighting and corrosion protection; EV platforms add pull for flame-retardant PC and high-temperature composites. Electronics/communication consume phenolic laminates and high-purity PC/epoxy systems for PCBs and enclosures, while metallurgy uses specialty binders. “Other” end-uses (medical devices, lab reagents) expand steadily with specification-driven procurement.
Distribution Sales Analysis
Indirect sales channels hold the larger share (about 54.3%), reflecting the reach of distributors and traders in fragmented geographies, value-added services (custom packaging, finance, compliance), and rising e-procurement adoption. Distributors increasingly deploy data-driven inventory and dynamic pricing, improving service levels for SMEs and regional converters.
Direct sales remain the preference for majors and integrated buyers seeking volume reliability, logistics control, and feedstock-indexed pricing. 2025–2028 should see a hybridization of models—suppliers deepening VMI/portal links with top accounts while expanding distributor partnerships in high-growth APAC and MEA to shorten cash cycles and reduce working-capital drag.
Regional Analysis
Asia Pacific is the demand and supply anchor with about 46.2% share (≈USD 13.1 billion baseline), supported by downstream polycarbonate, epoxy, and nylon-6 expansions in China, India, and Southeast Asia. Cost-advantaged aromatics, new cumene units, and cluster infrastructure position APAC to grow faster than the global average through 2030.
North America benefits from feedstock reliability on the U.S. Gulf Coast and healthy specialty resins demand; Europe emphasizes higher-value applications under stringent carbon and product regulations, prompting selective capacity rationalization but stronger pricing power in niche grades. The Middle East & Africa is scaling export-oriented phenol/acetone platforms integrated with refinery/petrochemical hubs, while Latin America advances gradually on construction and auto supply chains. Net-net, investment hot spots align with integrated aromatics platforms and downstream resin capacity adds, with sustainability-aligned grades commanding premium lift in developed markets.
By Manufacturing Process (Cumene Process, Dow Process, Ranching–Hooker Process), By Application (Bisphenol A, Phenolic Resins, Caprolactam, Others), By End-use (Chemical, Construction, Automotive, Electronic Communication, Metallurgy, Other), By Distribution Sales (Direct Sales, Indirect Sales)
Research Methodology
Primary Research- 100 Interviews of Stakeholders
Secondary Research
Desk Research
Regional scope
North America (United States, Canada, Mexico)
Latin America (Brazil, Argentina, Columbia)
East Asia And Pacific (China, Japan, South Korea, Australia, Cambodia, Fiji, Indonesia)
Sea And South Asia (India, Singapore, Thailand, Taiwan, Malaysia)
Eastern Europe (Poland, Russia, Czech Republic, Romania)
Western Europe (Germany, U.K., France, Spain, Itlay)
Middle East & Africa (GCC Countries, Egypt, Nigeria, South Africa, Israel)
Competitive Landscape
Merck KGaA, AdvanSix, LG Chem, Cepsa, INEOS, SHENGQUAN GROUP, Sasol LTD, Prasol Chemicals Pvt. Ltd., Honeywell International Inc., TPCC, Solvay, China National Bluestar (Group) Co., Ltd., Bayer AG, Altivia, KUMHO P&B CHEMICALS, INC., Aditya Birla Group, PTT Phenol Company Limited, Shell plc, Formosa Plastics Corporation, Domo Investment Group NV., Mitsui Chemicals, Inc.
Customization Scope
Customization for segments, region/country-level will be provided. Moreover, additional customization can be done based on the requirements.
Pricing and Purchase Options
Avail customized purchase options to meet your exact research needs. We have three licenses to opt for: Single User License, Multi-User License (Up to 5 Users), Corporate Use License (Unlimited User and Printable PDF).
TABLE OF CONTENTS
1. EXECUTIVE SUMMARY
1.1. MARKET SNAPSHOT
1.2. KEY FINDINGS & INSIGHTS
1.3. ANALYST RECOMMENDATIONS
1.4. FUTURE OUTLOOK
2. RESEARCH METHODOLOGY
2.1. MARKET DEFINITION & SCOPE
2.2. RESEARCH OBJECTIVES: PRIMARY & SECONDARY DATA SOURCES
2.3. DATA COLLECTION SOURCES
2.3.1. COVERAGE OF 100+ PRIMARY RESEARCH/CONSULTATION CALLS WITH INDUSTRY STAKEHOLDERS
FIGURE 17 NORTH AMERICA PHENOL CURRENT AND FUTURE TYPE ANALYSIS, 2025–2034, (USD MILLION)
FIGURE 18 NORTH AMERICA PHENOL CURRENT AND FUTURE END USER ANALYSIS, 2025–2034, (USD MILLION)
FIGURE 19 MARKET SHARE BY COUNTRY
FIGURE 20 LATIN AMERICA PHENOL CURRENT AND FUTURE TYPE ANALYSIS, 2025–2034, (USD MILLION)
FIGURE 21 LATIN AMERICA PHENOL CURRENT AND FUTURE END USER ANALYSIS, 2025–2034, (USD MILLION)
FIGURE 22 MARKET SHARE BY COUNTRY
FIGURE 23 EASTERN EUROPE PHENOL CURRENT AND FUTURE TYPE ANALYSIS, 2025–2034, (USD MILLION)
FIGURE 24 EASTERN EUROPE PHENOL CURRENT AND FUTURE END USER ANALYSIS, 2025–2034, (USD MILLION)
FIGURE 25 MARKET SHARE BY COUNTRY
FIGURE 26 WESTERN EUROPE PHENOL CURRENT AND FUTURE TYPE ANALYSIS, 2025–2034, (USD MILLION)
FIGURE 27 WESTERN EUROPE PHENOL CURRENT AND FUTURE END USER ANALYSIS, 2025–2034, (USD MILLION)
FIGURE 28 MARKET SHARE BY COUNTRY
FIGURE 29 EAST ASIA AND PACIFIC PHENOL CURRENT AND FUTURE TYPE ANALYSIS, 2025–2034, (USD MILLION)
FIGURE 30 EAST ASIA AND PACIFIC PHENOL CURRENT AND FUTURE END USER ANALYSIS, 2025–2034, (USD MILLION)
FIGURE 31 MARKET SHARE BY COUNTRY
FIGURE 32 SEA AND SOUTH ASIA PHENOL CURRENT AND FUTURE TYPE ANALYSIS, 2025–2034, (USD MILLION)
FIGURE 33 SEA AND SOUTH ASIA PHENOL CURRENT AND FUTURE END USER ANALYSIS, 2025–2034, (USD MILLION)
FIGURE 34 MARKET SHARE BY COUNTRY
FIGURE 35 MIDDLE EAST AND AFRICA PHENOL CURRENT AND FUTURE TYPE ANALYSIS, 2025–2034, (USD MILLION)
FIGURE 36 MIDDLE EAST AND AFRICA PHENOL CURRENT AND FUTURE END USER ANALYSIS, 2025–2034, (USD MILLION)
FIGURE 37 NORTH AMERICA PHENOL CURRENT AND FUTURE MARKET VOLUME SHARE REGIONAL ANALYSIS, 2025–2034, (USD MILLION)
FIGURE 38 U.S. PHENOL CURRENT AND FUTURE TYPE ANALYSIS, 2025–2034, (USD MILLION)
FIGURE 39 U.S. PHENOL CURRENT AND FUTURE END USER ANALYSIS, 2025–2034, (USD MILLION)
FIGURE 40 CANADA PHENOL CURRENT AND FUTURE TYPE ANALYSIS, 2025–2034, (USD MILLION)
FIGURE 41 CANADA PHENOL CURRENT AND FUTURE END USER ANALYSIS, 2025–2034, (USD MILLION)
FIGURE 42 LATIN AMERICA PHENOL CURRENT AND FUTURE MARKET VOLUME SHARE REGIONAL ANALYSIS, 2025–2034, (USD MILLION)
FIGURE 43 MEXICO PHENOL CURRENT AND FUTURE TYPE ANALYSIS, 2025–2034, (USD MILLION)
FIGURE 44 MEXICO PHENOL CURRENT AND FUTURE END USER ANALYSIS, 2025–2034, (USD MILLION)
FIGURE 45 BRAZIL PHENOL CURRENT AND FUTURE TYPE ANALYSIS, 2025–2034, (USD MILLION)
FIGURE 46 BRAZIL PHENOL CURRENT AND FUTURE END USER ANALYSIS, 2025–2034, (USD MILLION)
FIGURE 47 ARGENTINA PHENOL CURRENT AND FUTURE TYPE ANALYSIS, 2025–2034, (USD MILLION)
FIGURE 48 ARGENTINA PHENOL CURRENT AND FUTURE END USER ANALYSIS, 2025–2034, (USD MILLION)
FIGURE 49 COLUMBIA PHENOL CURRENT AND FUTURE TYPE ANALYSIS, 2025–2034, (USD MILLION)
FIGURE 50 COLUMBIA PHENOL CURRENT AND FUTURE END USER ANALYSIS, 2025–2034, (USD MILLION)
FIGURE 51 REST OF LATIN AMERICA PHENOL CURRENT AND FUTURE TYPE ANALYSIS, 2025–2034, (USD MILLION)
FIGURE 52 REST OF LATIN AMERICA PHENOL CURRENT AND FUTURE END USER ANALYSIS, 2025–2034, (USD MILLION)
FIGURE 53 EASTERN EUROPE PHENOL CURRENT AND FUTURE MARKET VOLUME SHARE REGIONAL ANALYSIS, 2025–2034, (USD MILLION)
FIGURE 54 POLAND PHENOL CURRENT AND FUTURE TYPE ANALYSIS, 2025–2034, (USD MILLION)
FIGURE 55 POLAND PHENOL CURRENT AND FUTURE END USER ANALYSIS, 2025–2034, (USD MILLION)
FIGURE 56 RUSSIA PHENOL CURRENT AND FUTURE TYPE ANALYSIS, 2025–2034, (USD MILLION)
FIGURE 57 RUSSIA PHENOL CURRENT AND FUTURE END USER ANALYSIS, 2025–2034, (USD MILLION)
FIGURE 58 CZECH REPUBLIC PHENOL CURRENT AND FUTURE TYPE ANALYSIS, 2025–2034, (USD MILLION)
FIGURE 59 CZECH REPUBLIC PHENOL CURRENT AND FUTURE END USER ANALYSIS, 2025–2034, (USD MILLION)
FIGURE 60 ROMANIA PHENOL CURRENT AND FUTURE TYPE ANALYSIS, 2025–2034, (USD MILLION)
FIGURE 61 ROMANIA PHENOL CURRENT AND FUTURE END USER ANALYSIS, 2025–2034, (USD MILLION)
FIGURE 62 REST OF EASTERN EUROPE PHENOL CURRENT AND FUTURE TYPE ANALYSIS, 2025–2034, (USD MILLION)
FIGURE 63 REST OF EASTERN EUROPE PHENOL CURRENT AND FUTURE END USER ANALYSIS, 2025–2034, (USD MILLION)
FIGURE 64 WESTERN EUROPE PHENOL CURRENT AND FUTURE MARKET VOLUME SHARE REGIONAL ANALYSIS, 2025–2034, (USD MILLION)
FIGURE 65 GERMANY PHENOL CURRENT AND FUTURE TYPE ANALYSIS, 2025–2034, (USD MILLION)
FIGURE 66 GERMANY PHENOL CURRENT AND FUTURE END USER ANALYSIS, 2025–2034, (USD MILLION)
FIGURE 67 FRANCE PHENOL CURRENT AND FUTURE TYPE ANALYSIS, 2025–2034, (USD MILLION)
FIGURE 68 FRANCE PHENOL CURRENT AND FUTURE END USER ANALYSIS, 2025–2034, (USD MILLION)
FIGURE 69 UK PHENOL CURRENT AND FUTURE TYPE ANALYSIS, 2025–2034, (USD MILLION)
FIGURE 70 UK PHENOL CURRENT AND FUTURE END USER ANALYSIS, 2025–2034, (USD MILLION)
FIGURE 71 SPAIN PHENOL CURRENT AND FUTURE TYPE ANALYSIS, 2025–2034, (USD MILLION)
FIGURE 72 SPAIN PHENOL CURRENT AND FUTURE END USER ANALYSIS, 2025–2034, (USD MILLION)
FIGURE 73 ITALY PHENOL CURRENT AND FUTURE TYPE ANALYSIS, 2025–2034, (USD MILLION)
FIGURE 74 ITALY PHENOL CURRENT AND FUTURE END USER ANALYSIS, 2025–2034, (USD MILLION)
FIGURE 75 REST OF WESTERN EUROPE PHENOL CURRENT AND FUTURE TYPE ANALYSIS, 2025–2034, (USD MILLION)
FIGURE 76 REST OF WESTERN EUROPE PHENOL CURRENT AND FUTURE END USER ANALYSIS, 2025–2034, (USD MILLION)
FIGURE 77 EAST ASIA AND PACIFIC PHENOL CURRENT AND FUTURE MARKET VOLUME SHARE REGIONAL ANALYSIS, 2025–2034, (USD MILLION)
FIGURE 78 CHINA PHENOL CURRENT AND FUTURE TYPE ANALYSIS, 2025–2034, (USD MILLION)
FIGURE 79 CHINA PHENOL CURRENT AND FUTURE END USER ANALYSIS, 2025–2034, (USD MILLION)
FIGURE 80 JAPAN PHENOL CURRENT AND FUTURE TYPE ANALYSIS, 2025–2034, (USD MILLION)
FIGURE 81 JAPAN PHENOL CURRENT AND FUTURE END USER ANALYSIS, 2025–2034, (USD MILLION)
FIGURE 82 AUSTRALIA PHENOL CURRENT AND FUTURE TYPE ANALYSIS, 2025–2034, (USD MILLION)
FIGURE 83 AUSTRALIA PHENOL CURRENT AND FUTURE END USER ANALYSIS, 2025–2034, (USD MILLION)
FIGURE 84 CAMBODIA PHENOL CURRENT AND FUTURE TYPE ANALYSIS, 2025–2034, (USD MILLION)
FIGURE 85 CAMBODIA PHENOL CURRENT AND FUTURE END USER ANALYSIS, 2025–2034, (USD MILLION)
FIGURE 86 FIJI PHENOL CURRENT AND FUTURE TYPE ANALYSIS, 2025–2034, (USD MILLION)
FIGURE 87 FIJI PHENOL CURRENT AND FUTURE END USER ANALYSIS, 2025–2034, (USD MILLION)
FIGURE 88 INDONESIA PHENOL CURRENT AND FUTURE TYPE ANALYSIS, 2025–2034, (USD MILLION)
FIGURE 89 INDONESIA PHENOL CURRENT AND FUTURE END USER ANALYSIS, 2025–2034, (USD MILLION)
FIGURE 90 SOUTH KOREA PHENOL CURRENT AND FUTURE TYPE ANALYSIS, 2025–2034, (USD MILLION)
FIGURE 91 SOUTH KOREA PHENOL CURRENT AND FUTURE END USER ANALYSIS, 2025–2034, (USD MILLION)
FIGURE 92 REST OF EAST ASIA AND PACIFIC PHENOL CURRENT AND FUTURE TYPE ANALYSIS, 2025–2034, (USD MILLION)
FIGURE 93 REST OF EAST ASIA AND PACIFIC PHENOL CURRENT AND FUTURE END USER ANALYSIS, 2025–2034, (USD MILLION)
FIGURE 94 SEA AND SOUTH ASIA PHENOL CURRENT AND FUTURE MARKET VOLUME SHARE REGIONAL ANALYSIS, 2025–2034, (USD MILLION)
FIGURE 95 BANGLADESH PHENOL CURRENT AND FUTURE TYPE ANALYSIS, 2025–2034, (USD MILLION)
FIGURE 96 BANGLADESH PHENOL CURRENT AND FUTURE END USER ANALYSIS, 2025–2034, (USD MILLION)
FIGURE 97 NEW ZEALAND PHENOL CURRENT AND FUTURE TYPE ANALYSIS, 2025–2034, (USD MILLION)
FIGURE 98 NEW ZEALAND PHENOL CURRENT AND FUTURE END USER ANALYSIS, 2025–2034, (USD MILLION)
FIGURE 99 INDIA PHENOL CURRENT AND FUTURE TYPE ANALYSIS, 2025–2034, (USD MILLION)
FIGURE 100 INDIA PHENOL CURRENT AND FUTURE END USER ANALYSIS, 2025–2034, (USD MILLION)
FIGURE 101 SINGAPORE PHENOL CURRENT AND FUTURE TYPE ANALYSIS, 2025–2034, (USD MILLION)
FIGURE 102 SINGAPORE PHENOL CURRENT AND FUTURE END USER ANALYSIS, 2025–2034, (USD MILLION)
FIGURE 103 THAILAND PHENOL CURRENT AND FUTURE TYPE ANALYSIS, 2025–2034, (USD MILLION)
FIGURE 104 THAILAND PHENOL CURRENT AND FUTURE END USER ANALYSIS, 2025–2034, (USD MILLION)
FIGURE 105 TAIWAN PHENOL CURRENT AND FUTURE TYPE ANALYSIS, 2025–2034, (USD MILLION)
FIGURE 106 TAIWAN PHENOL CURRENT AND FUTURE END USER ANALYSIS, 2025–2034, (USD MILLION)
FIGURE 107 MALAYSIA PHENOL CURRENT AND FUTURE TYPE ANALYSIS, 2025–2034, (USD MILLION)
FIGURE 108 MALAYSIA PHENOL CURRENT AND FUTURE END USER ANALYSIS, 2025–2034, (USD MILLION)
FIGURE 109 REST OF SEA AND SOUTH ASIA PHENOL CURRENT AND FUTURE TYPE ANALYSIS, 2025–2034, (USD MILLION)
FIGURE 110 REST OF SEA AND SOUTH ASIA PHENOL CURRENT AND FUTURE END USER ANALYSIS, 2025–2034, (USD MILLION)
FIGURE 111 MIDDLE EAST AND AFRICA PHENOL CURRENT AND FUTURE MARKET VOLUME SHARE REGIONAL ANALYSIS, 2025–2034, (USD MILLION)
FIGURE 112 GCC COUNTRIES PHENOL CURRENT AND FUTURE TYPE ANALYSIS, 2025–2034, (USD MILLION)
FIGURE 113 GCC COUNTRIES PHENOL CURRENT AND FUTURE END USER ANALYSIS, 2025–2034, (USD MILLION)
FIGURE 114 SAUDI ARABIA PHENOL CURRENT AND FUTURE TYPE ANALYSIS, 2025–2034, (USD MILLION)
FIGURE 115 SAUDI ARABIA PHENOL CURRENT AND FUTURE END USER ANALYSIS, 2025–2034, (USD MILLION)
FIGURE 116 UAE PHENOL CURRENT AND FUTURE TYPE ANALYSIS, 2025–2034, (USD MILLION)
FIGURE 117 UAE PHENOL CURRENT AND FUTURE END USER ANALYSIS, 2025–2034, (USD MILLION)
FIGURE 118 BAHRAIN PHENOL CURRENT AND FUTURE TYPE ANALYSIS, 2025–2034, (USD MILLION)
FIGURE 119 BAHRAIN PHENOL CURRENT AND FUTURE END USER ANALYSIS, 2025–2034, (USD MILLION)
FIGURE 120 KUWAIT PHENOL CURRENT AND FUTURE TYPE ANALYSIS, 2025–2034, (USD MILLION)
FIGURE 121 KUWAIT PHENOL CURRENT AND FUTURE END USER ANALYSIS, 2025–2034, (USD MILLION)
FIGURE 122 OMAN PHENOL CURRENT AND FUTURE TYPE ANALYSIS, 2025–2034, (USD MILLION)
FIGURE 123 OMAN PHENOL CURRENT AND FUTURE END USER ANALYSIS, 2025–2034, (USD MILLION)
FIGURE 124 QATAR PHENOL CURRENT AND FUTURE TYPE ANALYSIS, 2025–2034, (USD MILLION)
FIGURE 125 QATAR PHENOL CURRENT AND FUTURE END USER ANALYSIS, 2025–2034, (USD MILLION)
FIGURE 126 EGYPT PHENOL CURRENT AND FUTURE TYPE ANALYSIS, 2025–2034, (USD MILLION)
FIGURE 127 EGYPT PHENOL CURRENT AND FUTURE END USER ANALYSIS, 2025–2034, (USD MILLION)
FIGURE 128 NIGERIA PHENOL CURRENT AND FUTURE TYPE ANALYSIS, 2025–2034, (USD MILLION)
FIGURE 129 NIGERIA PHENOL CURRENT AND FUTURE END USER ANALYSIS, 2025–2034, (USD MILLION)
FIGURE 130 SOUTH AFRICA PHENOL CURRENT AND FUTURE TYPE ANALYSIS, 2025–2034, (USD MILLION)
FIGURE 131 SOUTH AFRICA PHENOL CURRENT AND FUTURE END USER ANALYSIS, 2025–2034, (USD MILLION)
FIGURE 132 ISRAEL PHENOL CURRENT AND FUTURE TYPE ANALYSIS, 2025–2034, (USD MILLION)
FIGURE 133 ISRAEL PHENOL CURRENT AND FUTURE END USER ANALYSIS, 2025–2034, (USD MILLION)
FIGURE 134 REST OF MEA PHENOL CURRENT AND FUTURE TYPE ANALYSIS, 2025–2034, (USD MILLION)
FIGURE 135 REST OF MEA PHENOL CURRENT AND FUTURE END USER ANALYSIS, 2025–2034, (USD MILLION)
FIGURE 136 U. S. MARKET SHARE ANALYSIS BY TYPE (2024)
FIGURE 137 U. S. MARKET SHARE ANALYSIS BY END USER (2024)
FIGURE 138 CANADA MARKET SHARE ANALYSIS BY TYPE (2024)
FIGURE 139 CANADA MARKET SHARE ANALYSIS BY END USER (2024)
FIGURE 140 MEXICO MARKET SHARE ANALYSIS BY TYPE (2024)
FIGURE 141 MEXICO MARKET SHARE ANALYSIS BY END USER (2024)
FIGURE 142 CHINA MARKET SHARE ANALYSIS BY TYPE (2024)
FIGURE 143 CHINA MARKET SHARE ANALYSIS BY END USER (2024)
FIGURE 144 JAPAN MARKET SHARE ANALYSIS BY TYPE (2024)
FIGURE 145 JAPAN MARKET SHARE ANALYSIS BY END USER (2024)
FIGURE 146 INDIA MARKET SHARE ANALYSIS BY TYPE (2024)
FIGURE 147 INDIA MARKET SHARE ANALYSIS BY END USER (2024)
FIGURE 148 SOUTH KOREA MARKET SHARE ANALYSIS BY TYPE (2024)
FIGURE 149 SOUTH KOREA MARKET SHARE ANALYSIS BY END USER (2024)
FIGURE 150 SAUDI ARABIA MARKET SHARE ANALYSIS BY TYPE (2024)
FIGURE 151 SAUDI ARABIA MARKET SHARE ANALYSIS BY END USER (2024)
FIGURE 152 UAE MARKET SHARE ANALYSIS BY TYPE (2024)
FIGURE 153 UAE MARKET SHARE ANALYSIS BY END USER (2024)
FIGURE 154 EGYPT MARKET SHARE ANALYSIS BY TYPE (2024)
FIGURE 155 EGYPT MARKET SHARE ANALYSIS BY END USER (2024)
FIGURE 156 NIGERIA MARKET SHARE ANALYSIS BY TYPE (2024)
FIGURE 157 NIGERIA MARKET SHARE ANALYSIS BY END USER (2024)
FIGURE 158 SOUTH AFRICA MARKET SHARE ANALYSIS BY TYPE (2024)
FIGURE 159 SOUTH AFRICA MARKET SHARE ANALYSIS BY END USER (2024)
FIGURE 160 GERMANY MARKET SHARE ANALYSIS BY TYPE (2024)
FIGURE 161 GERMANY MARKET SHARE ANALYSIS BY END USER (2024)
FIGURE 162 FRANCE MARKET SHARE ANALYSIS BY TYPE (2024)
FIGURE 163 FRANCE MARKET SHARE ANALYSIS BY END USER (2024)
FIGURE 164 UK MARKET SHARE ANALYSIS BY TYPE (2024)
FIGURE 165 UK MARKET SHARE ANALYSIS BY END USER (2024)
FIGURE 166 SPAIN MARKET SHARE ANALYSIS BY TYPE (2024)
FIGURE 167 SPAIN MARKET SHARE ANALYSIS BY END USER (2024)
FIGURE 168 ITALY MARKET SHARE ANALYSIS BY TYPE (2024)
FIGURE 169 ITALY MARKET SHARE ANALYSIS BY END USER (2024)
FIGURE 170 BRAZIL MARKET SHARE ANALYSIS BY TYPE (2024)
FIGURE 171 BRAZIL MARKET SHARE ANALYSIS BY END USER (2024)
FIGURE 172 ARGENTINA MARKET SHARE ANALYSIS BY TYPE (2024)
FIGURE 173 ARGENTINA MARKET SHARE ANALYSIS BY END USER (2024)
FIGURE 174 COLUMBIA MARKET SHARE ANALYSIS BY TYPE (2024)
FIGURE 175 COLUMBIA MARKET SHARE ANALYSIS BY END USER (2024)
FIGURE 176 GLOBAL PHENOL CURRENT AND FUTURE MARKET KEY COUNTRY LEVEL ANALYSIS, 2024–2034, (USD MILLION)
FIGURE 177 FINANCIAL OVERVIEW:
Key Player Analysis
Aditya Birla Group:Challenger / Integrator. Through Aditya Birla Chemicals, the Group is a scale player in advanced materials—particularly epoxy systems and curing agents that draw on phenol-derived BPA—positioning ABG as an influential downstream consumer within the phenol value chain. In line with India’s import substitution and infrastructure push, the company has signaled capacity additions in phenolic and epoxy resins (e.g., a 2024 India expansion program adding ~15 ktpa of phenolic resin capacity, capex ~INR 500 crore), broadening regional availability and reducing lead times for automotive, electronics, and construction customers. Differentiation rests on multi-site Asian manufacturing, application engineering for high-performance laminates/coatings, and a sustainability narrative around lower-VOC and low-free-formaldehyde grades that meet tightening building and electronics standards.
SAS Institute Inc:Innovator / Digital enabler. SAS provides the AI and advanced analytics stack (notably Viya) that chemical producers use to optimize phenol/acetone complexes—covering predictive maintenance, yield/energy optimization, and anomaly detection across continuous units. In 2025, adoption of asset-performance analytics continues to scale as operators target 2–5% energy-intensity reductions and fewer unplanned outages via real-time monitoring, model-driven maintenance, and APC integration. SAS’s edge is breadth—from sensor fusion and time-series modeling to decisioning and governance—enabling enterprise deployments that compress turnaround risk and stabilize margins in feedstock-volatile environments.
ALTIVIA:Leader / Category specialist (US). ALTIVIA Petrochemicals operates as an integrated producer of phenol, acetone, and alpha-methylstyrene, supplying North American resin and polycarbonate/epoxy chains from its U.S. footprint (e.g., Haverhill, Ohio). The portfolio alignment with BPA/epoxy derivatives, supported by SDS and petrochemical product lines, positions ALTIVIA as a reliable domestic source amid cyclical imports. Strategic focus areas include reliability upgrades, product-quality assurance for downstream BPA, and logistics responsiveness to U.S. Gulf and Midwest demand, helping customers mitigate volatility in benzene/propylene spreads. (
Bayer AG:Niche / Downstream influence (post materials divestiture). Following the carve-out and listing of Covestro (2015), Bayer’s direct exposure to polycarbonate/BPA has been materially reduced; the company’s current relevance to phenol is primarily indirect—through healthcare supply chains that utilize phenolic intermediates, disinfectants, and specialty resins for packaging and devices supplied by third parties. For investors, Bayer’s stance underscores a strategic pivot toward pharmaceuticals and crop science while highlighting how downstream, specification-driven customers shape demand for higher-purity, compliant phenolic derivatives even without owning upstream assets.
Market Key Players
Merck KGaA
AdvanSix
LG Chem
Cepsa
INEOS
SHENGQUAN GROUP
Sasol LTD
Prasol Chemicals Pvt. Ltd.
Honeywell International Inc.
TPCC
Solvay
China National Bluestar (Group) Co., Ltd.
Bayer AG
Altivia
KUMHO P&B CHEMICALS, INC.
Aditya Birla Group
PTT Phenol Company Limited
Shell plc
Formosa Plastics Corporation
Domo Investment Group NV.
Mitsui Chemicals, Inc.
Driver:
Expanding Demand for Bisphenol-A and Downstream Industries
As of 2025, the global phenol market is closely tied to the rising consumption of bisphenol-A (BPA), which accounts for over 40% of total phenol demand. BPA remains indispensable in the production of polycarbonate plastics and epoxy resins, which are integral to automotive lightweighting, electronic housings, renewable energy components, and high-performance construction materials. With polycarbonate consumption forecasted to expand at 6–7% CAGR through 2030, phenol demand is set to rise in tandem.
In parallel, the automotive, electronics, and construction sectors are strengthening their reliance on phenolic resins for insulation, adhesives, and heat-resistant composites. This cross-industry integration positions phenol as a cornerstone material in industrial supply chains. For market participants, this strong pull-through demand secures long-term revenue visibility and justifies capacity expansions in high-growth regions such as Asia Pacific and the Middle East.
Restraint:
Feedstock Volatility and Environmental Scrutiny
The key challenge in 2025 remains raw material price volatility, particularly benzene, which represents over 50% of phenol’s production cost structure. Shifts in crude oil pricing, supply chain disruptions, and regional imbalances in propylene availability continue to pressure operating margins. Producers face significant cost pass-through risks, with benzene price swings of 15–20% annually directly affecting phenol pricing stability.
Equally significant are environmental and health regulations. Phenol’s classification as a hazardous chemical has led to tighter restrictions across North America and Europe, particularly for exposure in consumer-facing applications. Regulatory momentum toward low-toxicity and bio-based substitutes is accelerating, forcing traditional producers to either invest in greener processes or risk losing share in high-value markets. This dual pressure on cost and compliance presents a substantial barrier to margin expansion.
Opportunity:
Growth in Bio-Based Phenol and Specialty Applications
The push toward sustainable chemistry is creating a breakthrough opportunity in bio-based phenol production. Pilot-scale plants leveraging lignin and renewable aromatics are expected to achieve commercial viability between 2026 and 2028, with potential to capture 5–8% of global phenol demand by 2030. Producers who align with this transition can secure premium pricing in industries such as pharmaceuticals, agriculture, and personal care, where sustainability credentials drive procurement decisions.
Additionally, R&D investment in new phenol applications is accelerating. Opportunities span advanced composites for electric vehicle platforms, specialty coatings for wind turbine blades, and novel uses in battery separators and electronic substrates. These emerging demand pockets could represent USD 3–4 billion in incremental revenue potential by the end of the decade, diversifying the market away from cyclical derivatives.
Trend:
Technological Innovation and Circular Economy Practices
A defining trend in 2025 is the advancement of catalytic recycling and recovery technologies for phenol and its derivatives. Breakthroughs in catalytic hydrogenolysis, solvent extraction, and depolymerization of polycarbonates are enabling recovery yields of up to 80–85%, reducing reliance on virgin feedstocks and cutting production costs by 5–10%. These innovations align with global carbon-neutrality targets and enhance supply security amid raw material volatility.
Another disruptive trend is the increasing adoption of phenol derivatives in healthcare and pharmaceuticals. Expanding applications of phenol-based intermediates in pain management, antibacterial agents, and drug delivery systems are reshaping demand dynamics. With global healthcare spending forecasted to exceed USD 12 trillion by 2030, phenol’s role in pharma-grade derivatives presents a strategically important growth pathway, supporting long-term market resilience.
Recent Developments
Dec 2024 – PTT Global Chemical (PTT Phenol): Announced a scheduled shutdown of its No. 1 phenol–acetone unit at Map Ta Phut for maintenance and reliability upgrades ahead of the 2025 demand season. Strategic impact: The planned outage supports asset integrity and supply reliability in Southeast Asia while aligning inventories with subdued year-end demand. (
Feb 2025 – AdvanSix: Reported full-year 2024 results and noted a slower ramp to full operating rates following a planned Q4 turnaround, with volumes down ~16% in the quarter; management highlighted ongoing commercial and cost actions entering 2025. Strategic impact: Reinforces a focus on operational discipline and turnaround execution to stabilize phenol/acetone margins through cyclical volatility.
Apr 2025 – Deepak Chem Tech (Deepak Nitrite Group): Approved a greenfield integrated complex at Dahej, India—300 ktpa phenol, 185 ktpa acetone, and 100 ktpa IPA—with capex of about INR 3,500 crore (~USD 407 million); the project is designed to feed downstream BPA/PC via licensed technology. Strategic impact: Establishes a new self-sufficient phenol–acetone platform in India, reducing imports and creating an integrated route into higher-value resins.
Apr 2025 – Orlen: Confirmed it will decommission its Płock phenol/acetone unit by end-2025 (c. 55 ktpa phenol, 34 ktpa acetone) citing technical and environmental cost hurdles. Strategic impact: Tightens legacy European supply, likely lifting utilization at more efficient EU sites and shifting incremental volumes to imports.
Jun 2025 – INEOS Phenol: Announced intention to permanently close its Gladbeck (Germany) operations amid high energy and carbon costs; the company indicated Antwerp as a future focus with restart timing targeted around 2027. Strategic impact: Accelerates European capacity rationalization and reorients INEOS toward lower-cost, scale assets, with implications for regional pricing and trade flows.
Sep 2025 – Hindustan Organic Chemicals Ltd (HOCL): Scheduled a 10-day maintenance shutdown of its Kochi phenol unit (Sept 10–19) to conduct statutory checks and process optimization. Strategic impact: While modest in scale, the outage underscores ongoing reliability work across Indian assets as domestic players prepare for rising downstream resin demand.