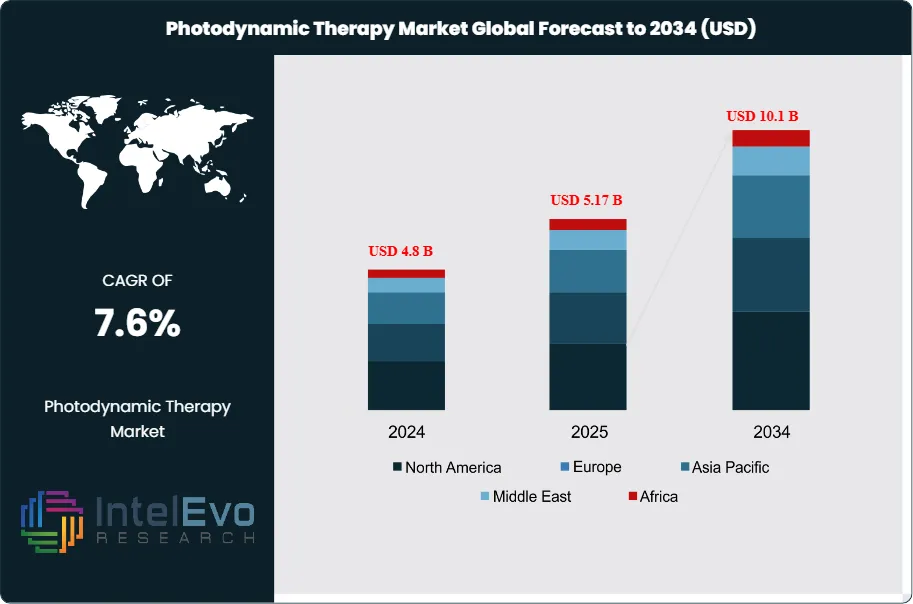
The Photodynamic Therapy Market was valued at around USD 4.8 billion in 2024 and is expected to reach nearly USD 10.1 billion by 2034. This growth is driven by the rising rates of skin cancers, the increasing demand for less invasive cancer treatments, and fast advancements in laser delivery systems. Based on this growth trend, the market size for 2025 is estimated at about USD 5.17 billion. Starting in 2026, the market is projected to grow at an annual rate of about 7.6% from 2026 to 2034, ultimately reaching around USD 10.1 billion by 2034. This growth shows a significant shift towards targeted therapies that aim to destroy cancer cells accurately while protecting nearby healthy tissue. The demand for these therapies is also boosted by supportive regulatory approvals and the inclusion of next-generation photosensitizers in standard clinical practices.
The rising number of chronic skin conditions and cancer cases creates a strong demand. In 2024, the United States is expected to report over 2 million new cancer cases, and global numbers are likely to rise significantly by 2035 due to aging populations and environmental factors. This increase puts pressure on traditional surgical resources and highlights the need for outpatient-friendly alternatives like PDT. At the same time, the growing number of cases of actinic keratosis—affecting millions worldwide—keeps photodynamic therapy central to dermatological policies and reimbursement discussions.
On the supply side, vendors are expanding their offerings from basic light lamps to integrated "drug-device" combinations that pair third-generation photosensitizers with AI-driven light dosing systems. Intelligent systems capable of real-time monitoring are becoming more popular, aided by advancements in nanotechnology and portable LED arrays. Nanoparticle-based photosensitizers, which enhance tumor selectivity and lower patient sensitivity to light, are changing how doctors treat deep-seated tumors. Photosensitizer drugs are expected to make up about 75% of market revenues by 2034, while hardware such as lasers and LED systems remains an important growth segment at nearly 20%, with professional and managed services making up the remainder.
Regulation and clinical standardization are key to the market. Stricter safety protocols, mandatory validation for the effectiveness of light sources, and increased reimbursement for non-cancer treatments, such as severe acne and psoriasis, help maintain steady funding flows. Hospitals and specialized cancer centers account for more than 60% of spending, along with increasing adoption in private dermatology and cosmetic clinics. North America currently accounts for about 36% of global revenues, followed by Europe at around 29%. Asia Pacific is the fastest-growing region, thanks to rapidly improving healthcare systems and a large patient base in emerging markets like China and India.
Key Takeaways
Market Growth: The Photodynamic Therapy Market records 4.8 billion USD, 2024 in revenues. It is projected to reach 10.1 billion USD, 2034, representing a CAGR of 7.6%, 2024-2034.
Segment Dominance: Photosensitizer Drugs lead the product segment with a 75.4%, 2024 revenue share. This dominance underscores their critical role as the primary agent in triggering therapeutic biochemical reactions.
Segment Dominance: Hospitals command a 48.5%, 2024 share of the end-user segment. This leadership position highlights the necessity of specialized medical staff and advanced infrastructure for delivering complex PDT procedures.
Driver: Oncology (Cancer Treatment) acts as the primary demand catalyst, holding a 42.9%, 2024 application share. This concentration signals the high clinical value placed on PDT for treating skin, lung, and esophageal malignancies.
Restraint: High treatment costs and prolonged photosensitivity continue to limit widespread adoption. As a result, estimated: 15.0% of potential patients in low-income regions face accessibility barriers, 2024.
Opportunity: Vendors can expand by addressing underpenetrated outpatient segments and home-based "Daylight-PDT" kits. These represent estimated: 1.2 billion USD, 2034 in additional addressable spending, 2024-2034.
Trend: Nanotechnology and AI-guided dosimetry increasingly shape PDT deployments. Estimated: 45.0% of new PDT devices, 2028 are expected to feature smart light-delivery sensors, 2024-2034.
Regional Analysis: North America leads the regional landscape with a 36.1%, 2024 market share and 1.7 billion USD, 2024 in revenues. The Asia-Pacific region is projected to contribute estimated: 38.0% of incremental global market expansion, 2024-2034.
By Product Type
Photosensitizer drugs play a significant role in the 2025 market, making up 75.4 percent of global revenues. Their size reflects the importance of chemical agents such as Aminolevulinic Acid (ALA) and Porphyrin derivatives in the PDT process. Adoption is rising as second and third-generation drugs provide better tissue-specific targeting and fewer side effects. This segment is expected to grow steadily through 2030 as pharmaceutical R&D introduces new formulations that need shorter incubation periods.
Photodynamic therapy devices are gaining strong traction, especially in the laser and LED categories. Diode lasers allow for precise light delivery for internal oncology. LED panels have become the standard for wide-area dermatological treatments. The demand for portable and handheld devices is increasing, as clinics look to offer flexible outpatient services. Together, these hardware categories receive significant investment as healthcare providers upgrade their light delivery systems to meet new drug protocols.
By Application
Oncology accounts for 42.9 percent of total demand in 2025. The need for tissue-preserving treatments for skin, esophageal, and head-and-neck cancers drives continuous investment in PDT platforms. National cancer initiatives that prioritize minimally invasive surgery further support this segment. As clinical trials confirm PDT's effectiveness in treating drug-resistant tumors, its role in comprehensive cancer care is expected to strengthen.
Dermatology and acne treatment make up the next major group of applications. Photodynamic therapy is being used more frequently for actinic keratosis, moderate-to-severe acne, and psoriasis, offering a lasting alternative to long-term topical or systemic medications. Demand is increasing as the "wellness" trend encourages patients to seek light-based therapies that provide both therapeutic and aesthetic benefits. This segment is anticipated to grow quickly as younger populations look for advanced acne solutions.
By End-User
Hospitals account for 48.5 percent of total demand in 2025. Their specialized infrastructure and access to multi-disciplinary oncology teams make them the main setting for complex PDT procedures involving internal organs. Ongoing investments in "Smart Hospitals" are integrating PDT systems with electronic health records to improve patient tracking.
Cosmetics and dermatology clinics are the fastest-growing end-user group. These settings prefer PDT due to its outpatient efficiency and high patient turnover rates. As the cost of LED-based systems decreases, more private practices are adding PDT to their services for skin rejuvenation and precancerous lesion removal. This shift toward decentralized care is a key factor driving market volume.
By Region
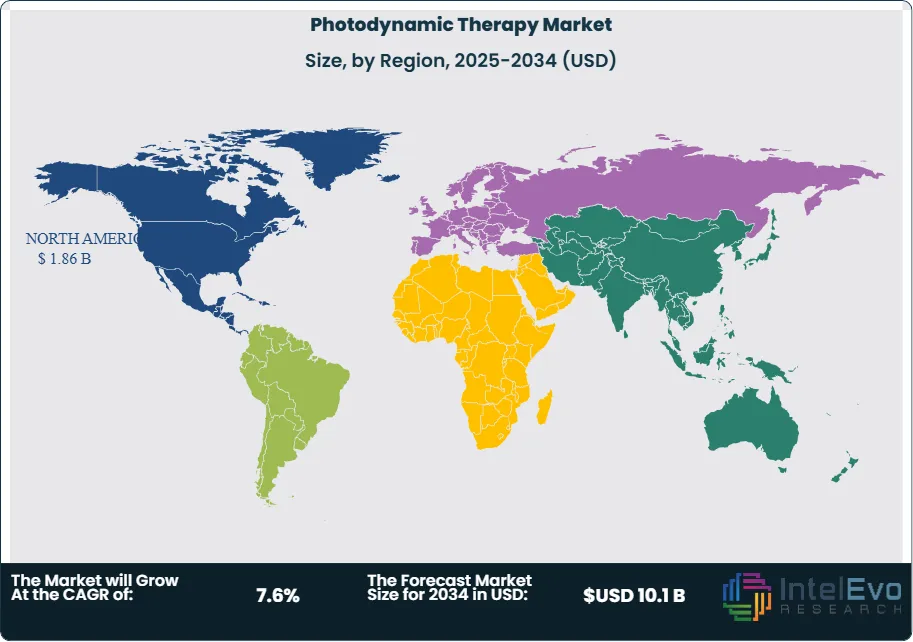
North America holds 36.1 percent of the market in 2025, valued at 1.86 billion USD. The region benefits from an established reimbursement system and a high concentration of leading biopharmaceutical companies. Programs that focus on skin cancer screening and early intervention support North America's leadership.
Asia Pacific is experiencing the fastest growth due to increased healthcare spending and a significant rise in cancer diagnoses. Countries like China and Japan are heavily investing in local medical device manufacturing, reducing the cost of PDT hardware. Emerging hotspots in Southeast Asia present opportunities for vendors to establish a presence through public-private partnerships and medical tourism initiatives.
Customization for segments, region/country-level will be provided. Moreover, additional customization can be done based on the requirements.
Pricing and Purchase Options
Avail customized purchase options to meet your exact research needs. We have three licenses to opt for: Single User License, Multi-User License (Up to 5 Users), Corporate Use License (Unlimited User and Printable PDF).
TABLE OF CONTENTS
1. EXECUTIVE SUMMARY
1.1. MARKET SNAPSHOT
1.2. KEY FINDINGS & INSIGHTS
1.3. ANALYST RECOMMENDATIONS
1.4. FUTURE OUTLOOK
2. RESEARCH METHODOLOGY
2.1. MARKET DEFINITION & SCOPE
2.2. RESEARCH OBJECTIVES: PRIMARY & SECONDARY DATA SOURCES
2.3. DATA COLLECTION SOURCES
2.3.1. COVERAGE OF 100+ PRIMARY RESEARCH/CONSULTATION CALLS WITH INDUSTRY STAKEHOLDERS
FIGURE 17 NORTH AMERICA PHOTODYNAMIC THERAPYCURRENT AND FUTURE TYPE ANALYSIS, 2025–2034, (USD MILLION)
FIGURE 18 NORTH AMERICA PHOTODYNAMIC THERAPYCURRENT AND FUTURE END USER ANALYSIS, 2025–2034, (USD MILLION)
FIGURE 19 MARKET SHARE BY COUNTRY
FIGURE 20 LATIN AMERICA PHOTODYNAMIC THERAPYCURRENT AND FUTURE TYPE ANALYSIS, 2025–2034, (USD MILLION)
FIGURE 21 LATIN AMERICA PHOTODYNAMIC THERAPYCURRENT AND FUTURE END USER ANALYSIS, 2025–2034, (USD MILLION)
FIGURE 22 MARKET SHARE BY COUNTRY
FIGURE 23 EASTERN EUROPE PHOTODYNAMIC THERAPYCURRENT AND FUTURE TYPE ANALYSIS, 2025–2034, (USD MILLION)
FIGURE 24 EASTERN EUROPE PHOTODYNAMIC THERAPYCURRENT AND FUTURE END USER ANALYSIS, 2025–2034, (USD MILLION)
FIGURE 25 MARKET SHARE BY COUNTRY
FIGURE 26 WESTERN EUROPE PHOTODYNAMIC THERAPYCURRENT AND FUTURE TYPE ANALYSIS, 2025–2034, (USD MILLION)
FIGURE 27 WESTERN EUROPE PHOTODYNAMIC THERAPYCURRENT AND FUTURE END USER ANALYSIS, 2025–2034, (USD MILLION)
FIGURE 28 MARKET SHARE BY COUNTRY
FIGURE 29 EAST ASIA AND PACIFIC PHOTODYNAMIC THERAPYCURRENT AND FUTURE TYPE ANALYSIS, 2025–2034, (USD MILLION)
FIGURE 30 EAST ASIA AND PACIFIC PHOTODYNAMIC THERAPYCURRENT AND FUTURE END USER ANALYSIS, 2025–2034, (USD MILLION)
FIGURE 31 MARKET SHARE BY COUNTRY
FIGURE 32 SEA AND SOUTH ASIA PHOTODYNAMIC THERAPYCURRENT AND FUTURE TYPE ANALYSIS, 2025–2034, (USD MILLION)
FIGURE 33 SEA AND SOUTH ASIA PHOTODYNAMIC THERAPYCURRENT AND FUTURE END USER ANALYSIS, 2025–2034, (USD MILLION)
FIGURE 34 MARKET SHARE BY COUNTRY
FIGURE 35 MIDDLE EAST AND AFRICA PHOTODYNAMIC THERAPYCURRENT AND FUTURE TYPE ANALYSIS, 2025–2034, (USD MILLION)
FIGURE 36 MIDDLE EAST AND AFRICA PHOTODYNAMIC THERAPYCURRENT AND FUTURE END USER ANALYSIS, 2025–2034, (USD MILLION)
FIGURE 37 NORTH AMERICA PHOTODYNAMIC THERAPYCURRENT AND FUTURE MARKET VOLUME SHARE REGIONAL ANALYSIS, 2025–2034, (USD MILLION)
FIGURE 38 U.S. PHOTODYNAMIC THERAPYCURRENT AND FUTURE TYPE ANALYSIS, 2025–2034, (USD MILLION)
FIGURE 39 U.S. PHOTODYNAMIC THERAPYCURRENT AND FUTURE END USER ANALYSIS, 2025–2034, (USD MILLION)
FIGURE 40 CANADA PHOTODYNAMIC THERAPYCURRENT AND FUTURE TYPE ANALYSIS, 2025–2034, (USD MILLION)
FIGURE 41 CANADA PHOTODYNAMIC THERAPYCURRENT AND FUTURE END USER ANALYSIS, 2025–2034, (USD MILLION)
FIGURE 42 LATIN AMERICA PHOTODYNAMIC THERAPYCURRENT AND FUTURE MARKET VOLUME SHARE REGIONAL ANALYSIS, 2025–2034, (USD MILLION)
FIGURE 43 MEXICO PHOTODYNAMIC THERAPYCURRENT AND FUTURE TYPE ANALYSIS, 2025–2034, (USD MILLION)
FIGURE 44 MEXICO PHOTODYNAMIC THERAPYCURRENT AND FUTURE END USER ANALYSIS, 2025–2034, (USD MILLION)
FIGURE 45 BRAZIL PHOTODYNAMIC THERAPYCURRENT AND FUTURE TYPE ANALYSIS, 2025–2034, (USD MILLION)
FIGURE 46 BRAZIL PHOTODYNAMIC THERAPYCURRENT AND FUTURE END USER ANALYSIS, 2025–2034, (USD MILLION)
FIGURE 47 ARGENTINA PHOTODYNAMIC THERAPYCURRENT AND FUTURE TYPE ANALYSIS, 2025–2034, (USD MILLION)
FIGURE 48 ARGENTINA PHOTODYNAMIC THERAPYCURRENT AND FUTURE END USER ANALYSIS, 2025–2034, (USD MILLION)
FIGURE 49 COLUMBIA PHOTODYNAMIC THERAPYCURRENT AND FUTURE TYPE ANALYSIS, 2025–2034, (USD MILLION)
FIGURE 50 COLUMBIA PHOTODYNAMIC THERAPYCURRENT AND FUTURE END USER ANALYSIS, 2025–2034, (USD MILLION)
FIGURE 51 REST OF LATIN AMERICA PHOTODYNAMIC THERAPYCURRENT AND FUTURE TYPE ANALYSIS, 2025–2034, (USD MILLION)
FIGURE 52 REST OF LATIN AMERICA PHOTODYNAMIC THERAPYCURRENT AND FUTURE END USER ANALYSIS, 2025–2034, (USD MILLION)
FIGURE 53 EASTERN EUROPE PHOTODYNAMIC THERAPYCURRENT AND FUTURE MARKET VOLUME SHARE REGIONAL ANALYSIS, 2025–2034, (USD MILLION)
FIGURE 54 POLAND PHOTODYNAMIC THERAPYCURRENT AND FUTURE TYPE ANALYSIS, 2025–2034, (USD MILLION)
FIGURE 55 POLAND PHOTODYNAMIC THERAPYCURRENT AND FUTURE END USER ANALYSIS, 2025–2034, (USD MILLION)
FIGURE 56 RUSSIA PHOTODYNAMIC THERAPYCURRENT AND FUTURE TYPE ANALYSIS, 2025–2034, (USD MILLION)
FIGURE 57 RUSSIA PHOTODYNAMIC THERAPYCURRENT AND FUTURE END USER ANALYSIS, 2025–2034, (USD MILLION)
FIGURE 58 CZECH REPUBLIC PHOTODYNAMIC THERAPYCURRENT AND FUTURE TYPE ANALYSIS, 2025–2034, (USD MILLION)
FIGURE 59 CZECH REPUBLIC PHOTODYNAMIC THERAPYCURRENT AND FUTURE END USER ANALYSIS, 2025–2034, (USD MILLION)
FIGURE 60 ROMANIA PHOTODYNAMIC THERAPYCURRENT AND FUTURE TYPE ANALYSIS, 2025–2034, (USD MILLION)
FIGURE 61 ROMANIA PHOTODYNAMIC THERAPYCURRENT AND FUTURE END USER ANALYSIS, 2025–2034, (USD MILLION)
FIGURE 62 REST OF EASTERN EUROPE PHOTODYNAMIC THERAPYCURRENT AND FUTURE TYPE ANALYSIS, 2025–2034, (USD MILLION)
FIGURE 63 REST OF EASTERN EUROPE PHOTODYNAMIC THERAPYCURRENT AND FUTURE END USER ANALYSIS, 2025–2034, (USD MILLION)
FIGURE 64 WESTERN EUROPE PHOTODYNAMIC THERAPYCURRENT AND FUTURE MARKET VOLUME SHARE REGIONAL ANALYSIS, 2025–2034, (USD MILLION)
FIGURE 65 GERMANY PHOTODYNAMIC THERAPYCURRENT AND FUTURE TYPE ANALYSIS, 2025–2034, (USD MILLION)
FIGURE 66 GERMANY PHOTODYNAMIC THERAPYCURRENT AND FUTURE END USER ANALYSIS, 2025–2034, (USD MILLION)
FIGURE 67 FRANCE PHOTODYNAMIC THERAPYCURRENT AND FUTURE TYPE ANALYSIS, 2025–2034, (USD MILLION)
FIGURE 68 FRANCE PHOTODYNAMIC THERAPYCURRENT AND FUTURE END USER ANALYSIS, 2025–2034, (USD MILLION)
FIGURE 69 UK PHOTODYNAMIC THERAPYCURRENT AND FUTURE TYPE ANALYSIS, 2025–2034, (USD MILLION)
FIGURE 70 UK PHOTODYNAMIC THERAPYCURRENT AND FUTURE END USER ANALYSIS, 2025–2034, (USD MILLION)
FIGURE 71 SPAIN PHOTODYNAMIC THERAPYCURRENT AND FUTURE TYPE ANALYSIS, 2025–2034, (USD MILLION)
FIGURE 72 SPAIN PHOTODYNAMIC THERAPYCURRENT AND FUTURE END USER ANALYSIS, 2025–2034, (USD MILLION)
FIGURE 73 ITALY PHOTODYNAMIC THERAPYCURRENT AND FUTURE TYPE ANALYSIS, 2025–2034, (USD MILLION)
FIGURE 74 ITALY PHOTODYNAMIC THERAPYCURRENT AND FUTURE END USER ANALYSIS, 2025–2034, (USD MILLION)
FIGURE 75 REST OF WESTERN EUROPE PHOTODYNAMIC THERAPYCURRENT AND FUTURE TYPE ANALYSIS, 2025–2034, (USD MILLION)
FIGURE 76 REST OF WESTERN EUROPE PHOTODYNAMIC THERAPYCURRENT AND FUTURE END USER ANALYSIS, 2025–2034, (USD MILLION)
FIGURE 77 EAST ASIA AND PACIFIC PHOTODYNAMIC THERAPYCURRENT AND FUTURE MARKET VOLUME SHARE REGIONAL ANALYSIS, 2025–2034, (USD MILLION)
FIGURE 78 CHINA PHOTODYNAMIC THERAPYCURRENT AND FUTURE TYPE ANALYSIS, 2025–2034, (USD MILLION)
FIGURE 79 CHINA PHOTODYNAMIC THERAPYCURRENT AND FUTURE END USER ANALYSIS, 2025–2034, (USD MILLION)
FIGURE 80 JAPAN PHOTODYNAMIC THERAPYCURRENT AND FUTURE TYPE ANALYSIS, 2025–2034, (USD MILLION)
FIGURE 81 JAPAN PHOTODYNAMIC THERAPYCURRENT AND FUTURE END USER ANALYSIS, 2025–2034, (USD MILLION)
FIGURE 82 AUSTRALIA PHOTODYNAMIC THERAPYCURRENT AND FUTURE TYPE ANALYSIS, 2025–2034, (USD MILLION)
FIGURE 83 AUSTRALIA PHOTODYNAMIC THERAPYCURRENT AND FUTURE END USER ANALYSIS, 2025–2034, (USD MILLION)
FIGURE 84 CAMBODIA PHOTODYNAMIC THERAPYCURRENT AND FUTURE TYPE ANALYSIS, 2025–2034, (USD MILLION)
FIGURE 85 CAMBODIA PHOTODYNAMIC THERAPYCURRENT AND FUTURE END USER ANALYSIS, 2025–2034, (USD MILLION)
FIGURE 86 FIJI PHOTODYNAMIC THERAPYCURRENT AND FUTURE TYPE ANALYSIS, 2025–2034, (USD MILLION)
FIGURE 87 FIJI PHOTODYNAMIC THERAPYCURRENT AND FUTURE END USER ANALYSIS, 2025–2034, (USD MILLION)
FIGURE 88 INDONESIA PHOTODYNAMIC THERAPYCURRENT AND FUTURE TYPE ANALYSIS, 2025–2034, (USD MILLION)
FIGURE 89 INDONESIA PHOTODYNAMIC THERAPYCURRENT AND FUTURE END USER ANALYSIS, 2025–2034, (USD MILLION)
FIGURE 90 SOUTH KOREA PHOTODYNAMIC THERAPYCURRENT AND FUTURE TYPE ANALYSIS, 2025–2034, (USD MILLION)
FIGURE 91 SOUTH KOREA PHOTODYNAMIC THERAPYCURRENT AND FUTURE END USER ANALYSIS, 2025–2034, (USD MILLION)
FIGURE 92 REST OF EAST ASIA AND PACIFIC PHOTODYNAMIC THERAPYCURRENT AND FUTURE TYPE ANALYSIS, 2025–2034, (USD MILLION)
FIGURE 93 REST OF EAST ASIA AND PACIFIC PHOTODYNAMIC THERAPYCURRENT AND FUTURE END USER ANALYSIS, 2025–2034, (USD MILLION)
FIGURE 94 SEA AND SOUTH ASIA PHOTODYNAMIC THERAPYCURRENT AND FUTURE MARKET VOLUME SHARE REGIONAL ANALYSIS, 2025–2034, (USD MILLION)
FIGURE 95 BANGLADESH PHOTODYNAMIC THERAPYCURRENT AND FUTURE TYPE ANALYSIS, 2025–2034, (USD MILLION)
FIGURE 96 BANGLADESH PHOTODYNAMIC THERAPYCURRENT AND FUTURE END USER ANALYSIS, 2025–2034, (USD MILLION)
FIGURE 97 NEW ZEALAND PHOTODYNAMIC THERAPYCURRENT AND FUTURE TYPE ANALYSIS, 2025–2034, (USD MILLION)
FIGURE 98 NEW ZEALAND PHOTODYNAMIC THERAPYCURRENT AND FUTURE END USER ANALYSIS, 2025–2034, (USD MILLION)
FIGURE 99 INDIA PHOTODYNAMIC THERAPYCURRENT AND FUTURE TYPE ANALYSIS, 2025–2034, (USD MILLION)
FIGURE 100 INDIA PHOTODYNAMIC THERAPYCURRENT AND FUTURE END USER ANALYSIS, 2025–2034, (USD MILLION)
FIGURE 101 SINGAPORE PHOTODYNAMIC THERAPYCURRENT AND FUTURE TYPE ANALYSIS, 2025–2034, (USD MILLION)
FIGURE 102 SINGAPORE PHOTODYNAMIC THERAPYCURRENT AND FUTURE END USER ANALYSIS, 2025–2034, (USD MILLION)
FIGURE 103 THAILAND PHOTODYNAMIC THERAPYCURRENT AND FUTURE TYPE ANALYSIS, 2025–2034, (USD MILLION)
FIGURE 104 THAILAND PHOTODYNAMIC THERAPYCURRENT AND FUTURE END USER ANALYSIS, 2025–2034, (USD MILLION)
FIGURE 105 TAIWAN PHOTODYNAMIC THERAPYCURRENT AND FUTURE TYPE ANALYSIS, 2025–2034, (USD MILLION)
FIGURE 106 TAIWAN PHOTODYNAMIC THERAPYCURRENT AND FUTURE END USER ANALYSIS, 2025–2034, (USD MILLION)
FIGURE 107 MALAYSIA PHOTODYNAMIC THERAPYCURRENT AND FUTURE TYPE ANALYSIS, 2025–2034, (USD MILLION)
FIGURE 108 MALAYSIA PHOTODYNAMIC THERAPYCURRENT AND FUTURE END USER ANALYSIS, 2025–2034, (USD MILLION)
FIGURE 109 REST OF SEA AND SOUTH ASIA PHOTODYNAMIC THERAPYCURRENT AND FUTURE TYPE ANALYSIS, 2025–2034, (USD MILLION)
FIGURE 110 REST OF SEA AND SOUTH ASIA PHOTODYNAMIC THERAPYCURRENT AND FUTURE END USER ANALYSIS, 2025–2034, (USD MILLION)
FIGURE 111 MIDDLE EAST AND AFRICA PHOTODYNAMIC THERAPYCURRENT AND FUTURE MARKET VOLUME SHARE REGIONAL ANALYSIS, 2025–2034, (USD MILLION)
FIGURE 112 GCC COUNTRIES PHOTODYNAMIC THERAPYCURRENT AND FUTURE TYPE ANALYSIS, 2025–2034, (USD MILLION)
FIGURE 113 GCC COUNTRIES PHOTODYNAMIC THERAPYCURRENT AND FUTURE END USER ANALYSIS, 2025–2034, (USD MILLION)
FIGURE 114 SAUDI ARABIA PHOTODYNAMIC THERAPYCURRENT AND FUTURE TYPE ANALYSIS, 2025–2034, (USD MILLION)
FIGURE 115 SAUDI ARABIA PHOTODYNAMIC THERAPYCURRENT AND FUTURE END USER ANALYSIS, 2025–2034, (USD MILLION)
FIGURE 116 UAE PHOTODYNAMIC THERAPYCURRENT AND FUTURE TYPE ANALYSIS, 2025–2034, (USD MILLION)
FIGURE 117 UAE PHOTODYNAMIC THERAPYCURRENT AND FUTURE END USER ANALYSIS, 2025–2034, (USD MILLION)
FIGURE 118 BAHRAIN PHOTODYNAMIC THERAPYCURRENT AND FUTURE TYPE ANALYSIS, 2025–2034, (USD MILLION)
FIGURE 119 BAHRAIN PHOTODYNAMIC THERAPYCURRENT AND FUTURE END USER ANALYSIS, 2025–2034, (USD MILLION)
FIGURE 120 KUWAIT PHOTODYNAMIC THERAPYCURRENT AND FUTURE TYPE ANALYSIS, 2025–2034, (USD MILLION)
FIGURE 121 KUWAIT PHOTODYNAMIC THERAPYCURRENT AND FUTURE END USER ANALYSIS, 2025–2034, (USD MILLION)
FIGURE 122 OMAN PHOTODYNAMIC THERAPYCURRENT AND FUTURE TYPE ANALYSIS, 2025–2034, (USD MILLION)
FIGURE 123 OMAN PHOTODYNAMIC THERAPYCURRENT AND FUTURE END USER ANALYSIS, 2025–2034, (USD MILLION)
FIGURE 124 QATAR PHOTODYNAMIC THERAPYCURRENT AND FUTURE TYPE ANALYSIS, 2025–2034, (USD MILLION)
FIGURE 125 QATAR PHOTODYNAMIC THERAPYCURRENT AND FUTURE END USER ANALYSIS, 2025–2034, (USD MILLION)
FIGURE 126 EGYPT PHOTODYNAMIC THERAPYCURRENT AND FUTURE TYPE ANALYSIS, 2025–2034, (USD MILLION)
FIGURE 127 EGYPT PHOTODYNAMIC THERAPYCURRENT AND FUTURE END USER ANALYSIS, 2025–2034, (USD MILLION)
FIGURE 128 NIGERIA PHOTODYNAMIC THERAPYCURRENT AND FUTURE TYPE ANALYSIS, 2025–2034, (USD MILLION)
FIGURE 129 NIGERIA PHOTODYNAMIC THERAPYCURRENT AND FUTURE END USER ANALYSIS, 2025–2034, (USD MILLION)
FIGURE 130 SOUTH AFRICA PHOTODYNAMIC THERAPYCURRENT AND FUTURE TYPE ANALYSIS, 2025–2034, (USD MILLION)
FIGURE 131 SOUTH AFRICA PHOTODYNAMIC THERAPYCURRENT AND FUTURE END USER ANALYSIS, 2025–2034, (USD MILLION)
FIGURE 132 ISRAEL PHOTODYNAMIC THERAPYCURRENT AND FUTURE TYPE ANALYSIS, 2025–2034, (USD MILLION)
FIGURE 133 ISRAEL PHOTODYNAMIC THERAPYCURRENT AND FUTURE END USER ANALYSIS, 2025–2034, (USD MILLION)
FIGURE 134 REST OF MEA PHOTODYNAMIC THERAPYCURRENT AND FUTURE TYPE ANALYSIS, 2025–2034, (USD MILLION)
FIGURE 135 REST OF MEA PHOTODYNAMIC THERAPYCURRENT AND FUTURE END USER ANALYSIS, 2025–2034, (USD MILLION)
FIGURE 136 U. S. MARKET SHARE ANALYSIS BY TYPE (2024)
FIGURE 137 U. S. MARKET SHARE ANALYSIS BY END USER (2024)
FIGURE 138 CANADA MARKET SHARE ANALYSIS BY TYPE (2024)
FIGURE 139 CANADA MARKET SHARE ANALYSIS BY END USER (2024)
FIGURE 140 MEXICO MARKET SHARE ANALYSIS BY TYPE (2024)
FIGURE 141 MEXICO MARKET SHARE ANALYSIS BY END USER (2024)
FIGURE 142 CHINA MARKET SHARE ANALYSIS BY TYPE (2024)
FIGURE 143 CHINA MARKET SHARE ANALYSIS BY END USER (2024)
FIGURE 144 JAPAN MARKET SHARE ANALYSIS BY TYPE (2024)
FIGURE 145 JAPAN MARKET SHARE ANALYSIS BY END USER (2024)
FIGURE 146 INDIA MARKET SHARE ANALYSIS BY TYPE (2024)
FIGURE 147 INDIA MARKET SHARE ANALYSIS BY END USER (2024)
FIGURE 148 SOUTH KOREA MARKET SHARE ANALYSIS BY TYPE (2024)
FIGURE 149 SOUTH KOREA MARKET SHARE ANALYSIS BY END USER (2024)
FIGURE 150 SAUDI ARABIA MARKET SHARE ANALYSIS BY TYPE (2024)
FIGURE 151 SAUDI ARABIA MARKET SHARE ANALYSIS BY END USER (2024)
FIGURE 152 UAE MARKET SHARE ANALYSIS BY TYPE (2024)
FIGURE 153 UAE MARKET SHARE ANALYSIS BY END USER (2024)
FIGURE 154 EGYPT MARKET SHARE ANALYSIS BY TYPE (2024)
FIGURE 155 EGYPT MARKET SHARE ANALYSIS BY END USER (2024)
FIGURE 156 NIGERIA MARKET SHARE ANALYSIS BY TYPE (2024)
FIGURE 157 NIGERIA MARKET SHARE ANALYSIS BY END USER (2024)
FIGURE 158 SOUTH AFRICA MARKET SHARE ANALYSIS BY TYPE (2024)
FIGURE 159 SOUTH AFRICA MARKET SHARE ANALYSIS BY END USER (2024)
FIGURE 160 GERMANY MARKET SHARE ANALYSIS BY TYPE (2024)
FIGURE 161 GERMANY MARKET SHARE ANALYSIS BY END USER (2024)
FIGURE 162 FRANCE MARKET SHARE ANALYSIS BY TYPE (2024)
FIGURE 163 FRANCE MARKET SHARE ANALYSIS BY END USER (2024)
FIGURE 164 UK MARKET SHARE ANALYSIS BY TYPE (2024)
FIGURE 165 UK MARKET SHARE ANALYSIS BY END USER (2024)
FIGURE 166 SPAIN MARKET SHARE ANALYSIS BY TYPE (2024)
FIGURE 167 SPAIN MARKET SHARE ANALYSIS BY END USER (2024)
FIGURE 168 ITALY MARKET SHARE ANALYSIS BY TYPE (2024)
FIGURE 169 ITALY MARKET SHARE ANALYSIS BY END USER (2024)
FIGURE 170 BRAZIL MARKET SHARE ANALYSIS BY TYPE (2024)
FIGURE 171 BRAZIL MARKET SHARE ANALYSIS BY END USER (2024)
FIGURE 172 ARGENTINA MARKET SHARE ANALYSIS BY TYPE (2024)
FIGURE 173 ARGENTINA MARKET SHARE ANALYSIS BY END USER (2024)
FIGURE 174 COLUMBIA MARKET SHARE ANALYSIS BY TYPE (2024)
FIGURE 175 COLUMBIA MARKET SHARE ANALYSIS BY END USER (2024)
FIGURE 176 GLOBAL PHOTODYNAMIC THERAPYCURRENT AND FUTURE MARKET KEY COUNTRY LEVEL ANALYSIS, 2024–2034, (USD MILLION)
FIGURE 177 FINANCIAL OVERVIEW:
Key Player Analysis
Galderma S.A.: Galderma positions itself as a global leader in dermatological PDT, primarily through its flagship photosensitizer and light-delivery combinations. The company focuses on the high-volume skin health market, leveraging its extensive distribution network in over 90 countries. Its strategic emphasis on "Total Skin Health" integrates PDT into a broader ecosystem of prescription and aesthetic products. Galderma continues to invest in clinical education to broaden the adoption of its Metvix/Aktilite systems, maintaining a dominant share in Western Europe and North America.
Biofrontera AG: Biofrontera is a key innovator in the treatment of sun-induced skin damage and non-melanoma skin cancer. The company differentiates itself through its "Ameluz" drug and "BF-RhodoLED" lamp series, which are specifically optimized for high-efficacy treatment of actinic keratosis. Biofrontera’s growth strategy involves aggressive expansion in the U.S. market and the pursuit of new indications, such as basal cell carcinoma. Its commitment to specialized PDT research makes it a primary partner for dermatology clinics seeking high-performance, standardized protocols.
Sun Pharmaceutical Industries Ltd.: Sun Pharma operates as a major player in the PDT space by providing affordable, high-quality photosensitizer formulations globally. As a specialty pharmaceutical giant, it leverages its massive manufacturing scale to drive down treatment costs, particularly in emerging markets. The company's focus on dermatology and oncology generics allows it to capture significant market share in regions with price-sensitive healthcare systems. Sun Pharma’s robust R&D pipeline is increasingly focused on novel delivery mechanisms to improve drug stability and patient compliance.
Market Key Players
Galderma S.A.
Biofrontera AG
Sun Pharmaceutical Industries Ltd.
Bausch Health Companies Inc.
Novartis AG
Lumibird (Quantel Medical)
Photocure ASA
Biolitec AG
Theralase Technologies Inc.
Modulight Corporation
Driver: Expanding Clinical Utility and Minimally Invasive Demand
Precision Targeting in Oncology and Dermatology
By 2026, the global photodynamic therapy market will grow mainly due to the rising cases of non-melanoma skin cancers and the increasing preference for targeted, minimally invasive procedures. Unlike traditional chemotherapy or invasive surgery, PDT provides a high level of precision. It selectively destroys cancer cells using light-activated photosensitizers while protecting nearby healthy tissue. This advantage is especially important in dermatology, where patients and doctors seek excellent cosmetic results alongside effective treatment for conditions like actinic keratosis and basal cell carcinoma on the face and neck.
Infrastructure Growth and Regulatory Support
The market also benefits from a strong pipeline of regulatory approvals and more government backing for non-catheter-based oncology treatments. In developed areas, better insurance coverage and the inclusion of PDT in standard clinical guidelines have made it easier for hospitals and private clinics to adopt this therapy. Moreover, the creation of next-generation photosensitizers with quicker incubation times and better depth of penetration is broadening PDT's application to internal cancers like esophageal and lung cancers, enhancing its role in modern cancer care.
Restraint: Economic Barriers and Clinical Standardization
High Capital Costs and Accessibility Gaps
A major challenge for the PDT market in 2026 is the steep cost of specialized laser equipment and high-quality photosensitizer drugs. The initial investment for top-end diode lasers and the ongoing costs for advanced pharmaceutical agents can exceed the budgets of smaller healthcare facilities, especially in developing countries. This economic barrier leads to a fragmented market, where access to the latest PDT innovations is often limited to well-funded urban hospitals, leaving rural and low-income populations with fewer treatment options.
Challenges in Protocol Standardization and Compliance
The market also struggles with inconsistent treatment protocols across different regions and conditions. Differences in light wavelengths, drug dosing, and incubation times can create varying clinical results, which complicates regulatory unification and reimbursement. Additionally, patients must avoid direct sunlight for extended periods after treatment, sometimes up to 48 hours, which poses a significant compliance issue. These challenges, along with a shortage of trained specialists, can slow the shift of PDT from a secondary treatment to a primary therapy.
Opportunity: Technological Synergies and Non-Oncology Verticals
Integration of Nanotechnology and AI-Guided Dosimetry
The next phase of market growth is linked to the integration of nanotechnology, particularly the use of nanoparticle carriers to boost drug solubility and tumor selectivity. By using "third-generation" photosensitizers, manufacturers can cut down side effects and shorten the post-treatment light-sensitivity period, leading to wider patient acceptance. At the same time, AI-based real-time dosimetry systems enable clinicians to accurately measure light distribution during procedures, ensuring correct therapeutic doses and reducing the risk of tissue damage.
Expansion into Dentistry, Ophthalmology, and Antimicrobial Uses
Beyond oncology, there is a significant opportunity to expand PDT into non-cancer areas such as dentistry and antimicrobial treatments. PDT is being studied for treating periodontitis and drug-resistant bacterial infections, offering a strong alternative to traditional antibiotics. Additionally, the rising use of PDT for age-related macular degeneration (AMD) in ophthalmology is emerging as a valuable area. Companies that can provide specialized, compact devices for these applications could capture substantial market share and tap into a combined multi-billion dollar revenue opportunity by 2034.
Trend: Decentralization and Digitalization of Therapy
The Shift Toward Outpatient and Home-Based Care
A key trend in 2026 is the move of PDT from high-acuity hospital settings to outpatient dermatology clinics and even home use. The launch of portable, wearable LED devices and "Daylight-PDT" protocols, which use natural sunlight to activate photosensitizers, has made the therapy more accessible and convenient for patients. This trend aligns with growing consumer demand for office-hour treatments that require minimal recovery time, prompting manufacturers to focus on lightweight, handheld equipment and user-friendly topical formulations.
Data-Driven Ecosystems and Smart Monitoring
The market is also experiencing a shift toward "smart" therapy ecosystems, where PDT devices connect with mobile health apps and cloud-based monitoring platforms. These digital tools improve patient tracking, automate treatment scheduling, and facilitate post-procedure follow-ups, ensuring better adherence to safety protocols. As the industry shifts toward personalized medicine, using predictive analytics to identify the best drug-light combination for a patient's genetic profile is becoming the norm, influencing research and development and long-term partnerships globally.
Recent Developments
March 2025 – Biofrontera AG: Received expanded regulatory approval for its RhodoLED XL lamp in Europe, allowing for the treatment of larger skin areas in a single session, significantly improving clinic throughput.
January 2025 – Galderma: Announced the results of a long-term study showing that its PDT protocols reduced the recurrence of actinic keratosis by 25% compared to traditional cryotherapy, supporting a shift in standard-of-care guidelines.
October 2024 – Modulight Corp: Launched a cloud-connected laser platform that enables real-time treatment monitoring and data sharing between oncologists, marking a significant step toward AI-integrated photodynamic therapy.
July 2024 – Rakuten Medical: Secured a strategic partnership to expand the availability of its "Alluminox" platform (Photoimmunotherapy) in several Asian markets, targeting refractory head and neck cancers.
May 2024 – Sun Pharma: Introduced a new liposomal formulation of a common photosensitizer designed to reduce post-treatment sun sensitivity from 48 hours to just 12 hours, addressing a major patient compliance restraint.