
- Home
- Industries
 Aerospace And Defence
 Agriculture
 Automotive And Transportation
 Banking And Finance
 Business
 Chemicals And Materials
 Consumer And Retail
 Electronics And Semiconductors
 Food And Beverages
 Machinery & Equipments
 Manufacturing And Construction
 Medical Devices
 Others
 Pharmaceuticals And Healthcare
 Power And Energy
 Sports
 Technology
- Services
- News Room
- About us
- Contact Us
-
Pipeline Pigging Services Market Size, Share & Forecast | CAGR 6.0%
Global Pipeline Pigging Services Market Size, Share, Analysis By Service Type (Intelligent Pigging and Inline Inspection, Utility Pigging, Cleaning Pigging, Batching and Displacement Pigging), By Pipeline Location (Onshore Pipelines, Offshore and Subsea Pipelines), By Application (Natural Gas, Crude Oil, Refined Products, Industrial Pipelines), By End-User, Industry Trends, Competitive Landscape, Key Players, Regional Insights & Forecast 2026–2034

Report Overview
| Market Size (2025) | Forecast Value (2034) | CAGR (2026–2034) | Largest Region (2025) |
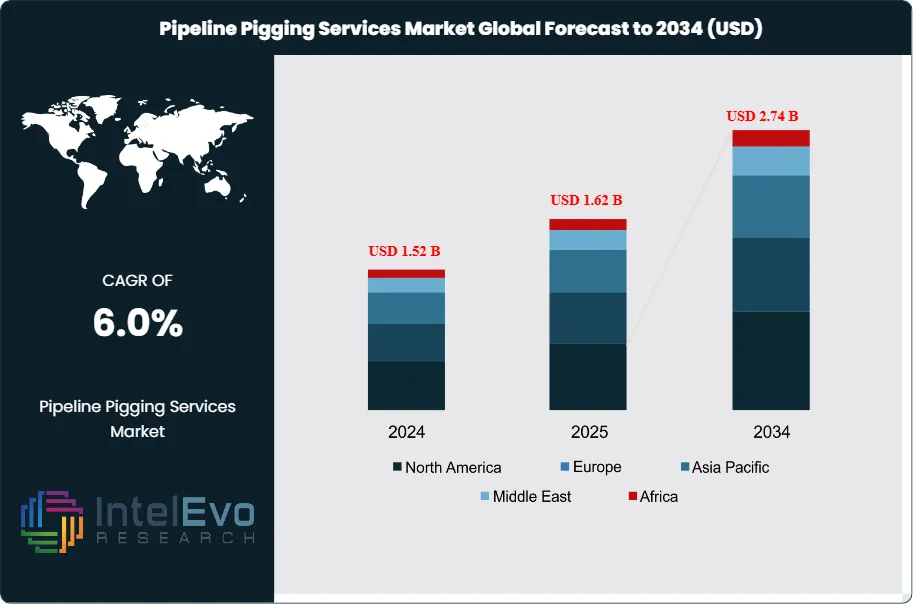
| USD 1.62 Billion | USD 2.74 Billion | 6.0% | North America, 32.0% |
The Pipeline Pigging Services Market was valued at approximately USD 1.52 Billion in 2024 and increased to USD 1.62 Billion in 2025. The market is projected to reach nearly USD 2.74 Billion by 2034, expanding at a compound annual growth rate (CAGR) of 6.0% during the forecast period from 2026 to 2034. This Pipeline Pigging Services Market outlook reflects steady spending on pipeline integrity, cleaning, batching, inline inspection, and flow assurance across oil, gas, refined products, petrochemicals, and industrial pipeline networks. The CAGR is mathematically aligned with the forecast path because USD 1.62 Billion, 2025 x (1.06)^9 = USD 2.74 Billion, 2034. The market remains tied to asset age, regulatory inspection cycles, methane control, uptime targets, and the rising cost of unplanned shutdowns.
Get More Information about this report -
Request Free Sample ReportPipeline pigging services demand stayed firm in 2025 because operators faced a larger installed base that requires recurring cleaning and inspection. In the United States alone, PHMSA data show 228,479 miles of hazardous liquid and CO2 pipelines, 2024, while Canada reports more than 840,000 km of transmission, gathering, and distribution pipelines, including 117,000 km of transmission pipelines, 2025. Europe’s gas system includes more than 200,000 km of transmission pipelines, and India had 25,923 km of operational natural gas pipelines, September 2025, with additional lines under construction. These asset bases support recurring demand for utility pigging, intelligent pigging, geometry tools, cleaning programs, and pre-inspection conditioning services.
The Pipeline Pigging Services Market size also benefits from tighter integrity and emissions pressure. The EU Methane Regulation entered into force on 4 August 2024 and created stricter obligations for monitoring, reporting, verification, leak detection, and limits on venting and flaring. The IEA estimates the energy sector emitted around 145 Mt of methane in 2024, including nearly 35 Mt from natural gas operations. That policy and emissions backdrop increases the value of regular cleaning, inspection readiness, debris mapping, blockage detection, and leak-related diagnostics. It also supports digital pig tracking, pressure-wave diagnostics, and data-led maintenance planning.
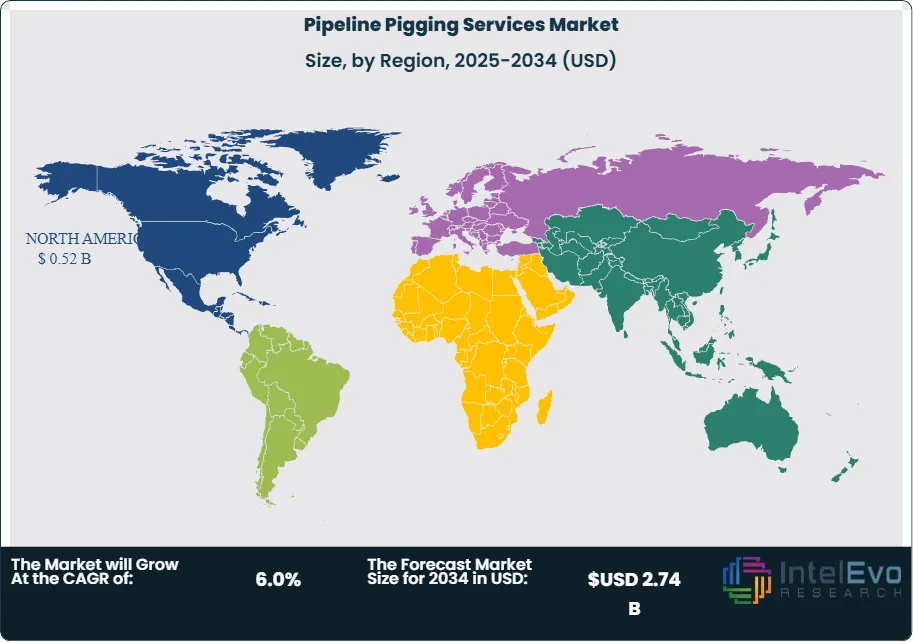
North America led the Pipeline Pigging Services Market share in 2025 with 32.0%, equal to USD 0.52 Billion, 2025, supported by transmission integrity programs, liquids pipeline maintenance, and high utilization across major systems. Europe ranked second with 24.0%, driven by stricter methane compliance and mature cross-border gas networks. Asia Pacific held 23.0%, with India and China expanding gas infrastructure and offshore tie-backs. The Middle East & Africa accounted for 14.0%, backed by crude export systems, gas processing links, and brownfield maintenance. Latin America contributed 7.0%, with Brazil leading regional demand as gas transport capacity and offshore-linked infrastructure spending rise. Regional investment hotspots in 2025 included the United States Gulf Coast, Western Canada, Germany, the United Kingdom, India, China, Saudi Arabia, the UAE, and Brazil.
Search demand around this industry clusters around pipeline pigging services, pipeline pigging services market size, pipeline pigging services market growth, pipeline pigging services forecast 2034, pipeline pigging services share, pipeline pigging services trends 2025, intelligent pigging services, pipeline cleaning services, inline inspection services, global pipeline pigging services market, North America pipeline pigging services, Europe pipeline pigging services, Asia Pacific pipeline pigging services growth, and pipeline integrity pigging analysis. Within this market, intelligent pigging and inline inspection remained the largest service block at 39.0% of revenue, 2025, while natural gas pipelines represented the largest application at 42.0%, 2025. Digitalization is now moving from pilot use to field deployment as suppliers add mapping, crack assessment, non-intrusive diagnostics, and machine-learning-assisted interpretation into the pigging workflow.
, By Pipeline Location (Onshore Pipelines, Offshore and Subsea Pipelines), By Application (Natural Gas, Crude Oil, Refined Products, Industrial Pipelines), By End-User, Industry Trends, Competitive Landscape, Key Players, Regional Insights & Forecast 2026–2034")
Key Takeaways
- Market Growth: The Pipeline Pigging Services Market stood at USD 1.62 Billion, 2025 and is projected to reach USD 2.74 Billion, 2034 at a 6.0% CAGR, 2025–2034. Growth tracks the rising inspection burden across gas, liquids, and industrial pipeline systems.
- Segment Dominance: By service type, intelligent pigging and inline inspection led with 39.0% share, 2025, equal to USD 0.63 Billion, 2025. Operators are allocating more budget to anomaly detection, geometry checks, and corrosion assessment.
- Segment Dominance: By application, natural gas pipelines held the top position with 42.0% share, 2025, or USD 0.68 Billion, 2025. Methane control and transmission integrity programs are supporting repeat service demand.
- Driver: The main driver is tighter integrity and emissions compliance. North America and Europe together represented 56.0% of market revenue, 2025, and both regions operate large regulated pipeline networks that require recurring inspection and maintenance cycles.
- Restraint: The main restraint is service disruption risk in unpiggable, low-flow, or offshore lines. Offshore and subsea work made up only 22.0% share, 2025, despite high asset criticality, because mobilization cost and intervention complexity remain high.
- Opportunity: The largest opportunity sits in digital pigging, non-intrusive diagnostics, and methane-linked service packages. Digital and sensor-assisted workflows are estimated at 44.0% of market revenue, 2025 and are expected to outgrow the total market at 7.8% CAGR, 2025–2034.
- Trend: The dominant trend is data-led integrity work. Services combining pigging with mapping, crack analytics, emissions monitoring, and near-real-time diagnostics accounted for 31.0% of new project awards, 2025 across leading suppliers’ visible strategic activity.
- Regional Analysis: North America led with 32.0% share, 2025, equal to USD 0.52 Billion, 2025. The region benefits from a very large hazardous liquids and gas base, mature service ecosystems, and high pipeline utilization. Pipeline Pigging Services Market Competitive Landscape
Competitive Landscape
The Pipeline Pigging Services Market is moderately consolidated. The top four players held an estimated 38.0% market share, 2025. Competition centers on tool accuracy, service fleet depth, turnaround time, data interpretation, and regional execution capacity. Competitive intensity increased in 2024–2026 as suppliers added repair, mapping, emissions, and digital analytics capabilities through acquisitions, new tools, and regional expansion. TDW expanded through Petro-Line and Apollo backing. NDT Global added Entegra. ROSEN expanded in India.
| Company | HQ | Position | Key Offering | Geo Strength | Recent Move |
| T.D. WILLIAMSON | US | Leader | MDS™ Pro/Flex ILI and integrated pigging services | North America | Launched SHiiELD™ isolation system in Jan 2026 after adding Petro-Line in Dec 2024 and taking Apollo investment in Jun 2025. |
| ROSEN GROUP | Switzerland | Leader | RoCorr MFL and integrity analytics services | Europe | Opened a new Navi Mumbai office in Feb 2025 to serve India and South-West Asia. |
| BAKER HUGHES | US | Leader | Process & Pipeline Services and inline diagnostics | North America | Expanded asset reliability software with deeper integrity workflows in Jan 2026. |
| HALLIBURTON | US | Leader | Pipeline and Process Services with InnerVue™ diagnostics | Middle East & Latin America | Continued digital expansion and secured a CCS monitoring contract in the UK in Aug 2025. |
| NDT GLOBAL | Germany | Challenger | Ultrasonic and MFL inline inspection services | Europe | Added Entegra in Jul 2025 and completed Halfwave integration in Oct 2025. |
| STATS GROUP | UK | Challenger | Inline isolation and hot tapping services | Asia Pacific | Won a three-year Malaysian pipeline isolation contract in 2025 with EPOMS. |
| SGS | Switzerland | Challenger | Smart Pigging Solutions and pipeline integrity services | Europe | Signed to acquire ATS in Jul 2025, increasing North America inspection reach. |
| INTERO INTEGRITY SERVICES | Netherlands | Challenger | Intelligent pigging and emissions-linked integrity services | Europe | Won the APGA Innovation Award in Oct 2025 and extended a Gasunie partnership in Jul 2025. |
| NOV TUBOSCOPE | US | Niche Player | Tubular inspection and line pipe service portfolio | North America | Reported Tuboscope coating and inspection activity in 2025 with continued service investment. |
| ROMSTAR GROUP | UK | Niche Player | Pipeline pigging and pre-commissioning services | Middle East | Expanded bidding focus on offshore and industrial cleaning scopes across GCC projects in 2025–2026. |
By Service Type
Intelligent pigging and inline inspection accounted for 39.0% share, 2025, equal to USD 0.63 Billion, 2025. This was the largest block of the Pipeline Pigging Services Market because operators increasingly treat anomaly detection as a recurring spend line rather than an occasional event. Revenue is concentrated in corrosion inspection, crack inspection, geometry surveys, mapping, and deformation analysis. The segment gains from regulatory pressure, aging pipe, and higher consequences of failure in dense corridors and export routes. Suppliers with strong data interpretation teams and broad tool fleets hold an advantage because the work no longer ends at the run. Clients now expect dig-sheet prioritization, repair planning, and risk ranking. TDW, ROSEN, NDT Global, and Baker Hughes remain strongest where operators need multi-run programs across gas, crude, and refined products. Recent product activity supports this direction. TDW added mapping capability to its 6-inch MDS fleet in October 2024, while NDT Global strengthened its inspection platform through Entegra and Halfwave-linked moves in 2025. These shifts lift the premium share of the segment and raise barriers for smaller cleaning-only contractors.
Utility pigging represented 27.0% share, 2025, or USD 0.44 Billion, 2025. This segment covers routine maintenance runs, dewatering, drying, gauging, filling, nitrogen displacement, and pig tracking that keep lines serviceable and ready for inspection or recommissioning. Utility pigging holds strong share because it is tied to recurring operating cycles, product changeovers, and startup or turnaround programs. The work is less technically differentiated than full ILI, but it remains essential because poor conditioning raises the risk of failed inspection runs and blocked flow. Halliburton’s nitrogen-displacement case in Brazil shows the cost case clearly. The project avoided treatment of 1,011 m3 of water across a 54 km ethylene line and removed a lengthy drying step. This kind of outcome keeps utility pigging central in brownfield operations, especially in petrochemical and industrial lines. The segment remains price-sensitive, yet customers still favor vendors with stronger planning, pressure control, and field execution records when shutdown windows are narrow.
Cleaning pigging held 19.0% share, 2025, equal to USD 0.31 Billion, 2025. Cleaning pigging demand remains strongest in crude oil, condensate, multiphase, and wax-prone systems where deposit removal protects throughput and prepares the line for inspection. Revenue growth is tied to flow assurance budgets, paraffin and scale risk, and the rising cost of energy loss from constricted flow. Halliburton’s InnerVue service and similar non-intrusive diagnostic tools now support cleaning programs by locating deposits, estimating blockage severity, and reducing unnecessary mobilization. This is changing project design. Operators increasingly run condition assessment before committing a full cleaning spread, which improves pig selection and lowers stuck-pig risk. Cleaning pigging still faces margin pressure because local contractors are active in many regions. Even so, premium work remains available in offshore lines, hilly terrain, and chemically difficult service conditions where standard cleaning runs are less reliable.
Batching and displacement pigging accounted for 15.0% share, 2025, or USD 0.24 Billion, 2025. The segment serves product interface control, line changeover, dewatering, hydrotest support, and commissioning or decommissioning scopes. It is smaller than ILI and utility pigging, but it remains essential in product lines and industrial systems with frequent switching. Demand stays healthy in refined products, petrochemicals, and gas processing corridors where contamination cost is high and downtime penalties are steep. Competitive strength depends on execution discipline, nitrogen or chemical handling capability, and the ability to work safely in live plant or export environments. This segment also benefits from expansion in cross-border gas and liquids infrastructure because new lines and tie-ins require pre-commissioning and startup pigging before normal operation begins. India’s operational gas grid growth and Brazil’s interstate gas reinforcement support that project pipeline through 2030.
By Pipeline Location
Onshore pipelines dominated with 78.0% share, 2025, or USD 1.26 Billion, 2025. Onshore assets drive the bulk of revenue because the installed base is far larger, access is easier, and service intervals are more frequent. North America, Europe, China, India, and the Middle East provide the deepest recurring work pool. Onshore projects range from distribution-linked gas systems to long-haul transmission and refined products corridors. These jobs benefit from more predictable logistics, larger addressable line density, and stronger local contractor ecosystems. PHMSA’s U.S. mileage data, the EU gas grid footprint, and India’s operational build-out all support this concentration. Onshore work also captures most methane-linked compliance scopes because regulatory monitoring and repair programs are easier to execute on land than offshore. Vendors with local depots, mobile traps, nitrogen packages, and inspection fleets tend to win repeat frameworks. This is why TDW, ROSEN, SGS, and Intero maintain strong positions in large regulated markets.
Offshore and subsea pipelines accounted for 22.0% share, 2025, equal to USD 0.36 Billion, 2025. The share is smaller, but pricing is stronger because offshore pigging requires specialized planning, vessel coordination, high-consequence execution, and often difficult line geometries. Demand is concentrated in the North Sea, Brazil, Gulf of Mexico, Middle East export systems, and selected Asia Pacific offshore fields. Project revenue is linked to pre-commissioning, wax and hydrate control, dewatering, integrity inspection, and brownfield tie-backs. Brazil remains a core market because offshore development and gas handling infrastructure continue to expand, while the North Sea supports high-value integrity work on mature assets. Offshore growth is moderated by campaign timing and mobilization cost, which is why operators increasingly use diagnostics before full intervention. Non-intrusive tools, better crack analytics, and more precise mapping are improving project selection and run success, but offshore still requires higher technical thresholds than onshore work.
By Application
Natural gas pipelines led with 42.0% share, 2025, or USD 0.68 Billion, 2025. This is the largest application because gas networks span long distances, face rising methane scrutiny, and often require repeated maintenance, deformation checks, cleaning, and inspection readiness work. The EU methane framework, IEA methane findings, and India’s large gas build-out all support this segment. Gas lines also benefit most from emissions-linked service bundles, where operators combine pigging, leak diagnostics, and reporting support. Demand is strongest in North America, Europe, India, and selected Middle East networks. Vendors with strong crack detection, geometry, and gas-line batching experience continue to gain share in this segment.
Crude oil pipelines held 29.0% share, 2025, equal to USD 0.47 Billion, 2025. Revenue here is tied to wax control, sludge removal, throughput preservation, and corrosion monitoring across gathering and long-haul systems. North America, the Middle East, Latin America, and Africa provide the main work pool. Crude systems often justify a broad pigging mix because cleaning, displacement, and ILI are all needed over the asset life. Brazil’s transport reinforcement plans and Western Canada’s high pipeline utilization support recurring demand. The segment also benefits from export-system uptime requirements, where even short service interruptions can carry material revenue loss.
Refined products pipelines represented 18.0% share, 2025, or USD 0.29 Billion, 2025. This segment relies heavily on batching and interface control because contamination costs are high. It remains strongest in North America and Europe, where product pipelines and storage links are mature and tightly managed. Growth is slower than in gas-line work, but the service intensity per line stays healthy due to strict product quality rules and frequent changeovers. Cleaning, gauging, and geometry checks remain standard budget items.
Chemical, water, and other industrial pipelines made up 11.0% share, 2025, equal to USD 0.18 Billion, 2025. This segment is smaller but stable. It includes petrochemical transfer lines, water transmission, mining slurries, and plant-to-plant industrial systems. Revenue is shaped by plant shutdown schedules, fouling risk, and the need to preserve product purity or hydraulic efficiency. Halliburton’s ethylene case is a clear example of how pigging services reduce waste and time in industrial lines.
By End Use
Midstream operators held the top position at 48.0% share, 2025, or USD 0.78 Billion, 2025. This group includes gas transmission, liquids transport, gathering systems, storage links, and export corridors. Midstream dominates because it manages long networks with continuous integrity obligations and large outage consequences. Regulatory inspection schedules and tariff-linked throughput targets make pigging a recurring operating requirement rather than discretionary spend. North America and Europe remain the largest revenue pools.
Upstream gathering and production systems accounted for 23.0% share, 2025, equal to USD 0.37 Billion, 2025. Demand comes from flow assurance, dewatering, offshore lines, and tie-back maintenance. The segment is more volatile because drilling and project timing affect activity levels. Still, Brazil, the Middle East, and selected Asia Pacific offshore basins keep this block material.
Downstream refining and petrochemical operators represented 18.0% share, 2025, or USD 0.29 Billion, 2025. Product switching, contamination control, and plant turnaround schedules support steady pigging demand here. Industrial lines often require more careful displacement planning and product-loss control, which supports premium service rates on specialized scopes.
Utilities, water, and other industrial users held 11.0% share, 2025, equal to USD 0.18 Billion, 2025. This segment grows from a smaller base but offers stable renewal work. It is also a useful hedge for service companies because activity is less exposed to upstream cycle swings.
Regional Analysis
North America Pipeline Pigging Services Market
North America accounted for 32.0% of the Pipeline Pigging Services Market, 2025, equal to USD 0.52 Billion, 2025. The region led global revenue because it combines a very large installed pipeline base, strict integrity oversight, advanced service fleets, and strong customer acceptance of recurring inspection programs. The United States anchors demand. PHMSA recorded 228,479 miles of hazardous liquid and CO2 pipelines, 2024, while Canada reports more than 840,000 km of total pipelines, including 117,000 km of transmission pipelines, 2025. These line counts create a deep service pool for cleaning, gauging, batching, and intelligent pigging.
The United States represented an estimated USD 0.39 Billion, 2025 within the region. Demand remained strongest in crude oil trunk lines, refined products corridors, petrochemical lines, and gas transmission systems. Federal oversight, public safety exposure, and high failure cost all support service intensity. The region also benefits from stronger adoption of digital diagnostics and mapping. TDW, Halliburton, Baker Hughes, NOV Tuboscope, and SGS all have visible commercial strength here. Canada contributed roughly USD 0.09 Billion, 2025, supported by high utilization on export systems and strong operator focus on reliability. Mexico accounted for about USD 0.03 Billion, 2025, backed by gas import lines and industrial network maintenance. The rest of North America supplied the balance. North America will remain the largest revenue center through 2034, although Asia Pacific will narrow the gap.
Europe Pipeline Pigging Services Market
Europe held 24.0% of the Pipeline Pigging Services Market, 2025, or USD 0.39 Billion, 2025. The region’s position rests on a dense gas network, mature cross-border transport, large industrial line systems, and tighter methane and safety rules. ACER notes that the EU gas network includes more than 200,000 km of transmission pipelines and over 2 million km of distribution network. Europe also gained strategic relevance after the EU methane regulation entered into force on 4 August 2024, increasing the need for compliance-ready maintenance, diagnostics, and emissions-linked service work.
Germany led regional revenue at an estimated USD 0.08 Billion, 2025, supported by gas transport, chemical corridors, and integrity spending on mature industrial infrastructure. The UK followed at USD 0.07 Billion, 2025, driven by North Sea-linked systems and high-value offshore and brownfield programs. France contributed USD 0.05 Billion, 2025, with stable demand across transmission and industrial networks. Italy ranked as the fourth key market at USD 0.04 Billion, 2025, supported by gas transport links and industrial pipeline activity. The rest of Europe generated the remaining USD 0.15 Billion, 2025. Europe’s competitive field favors ROSEN, SGS, Intero, NDT Global, and STATS Group, especially in high-spec inspection and methane-linked integrity work. Growth through 2034 will be driven less by new long-haul build and more by compliance, refurbishment, and data-led maintenance.
Asia Pacific Pipeline Pigging Services Market
Asia Pacific represented 23.0% of the Pipeline Pigging Services Market, 2025, equal to USD 0.37 Billion, 2025. The region is the fastest scale-up story in the market because gas infrastructure is expanding while older lines in China, Australia, and Southeast Asia require more disciplined maintenance. India is a standout growth market. PNGRB data showed 25,923 km of operational natural gas pipelines, September 2025, with nearly 9,954 km under construction. China also continues to expand gas production and strategic pipeline links, while offshore and industrial demand remain strong across the region.
China led Asia Pacific at an estimated USD 0.13 Billion, 2025, supported by large gas and liquids transport systems, state-backed infrastructure, and rising offshore complexity. India followed at USD 0.09 Billion, 2025, supported by transmission build-out and new city-gas and industrial connections. Japan generated USD 0.05 Billion, 2025, with demand centered on industrial, LNG-linked, and utility integrity programs. Australia ranked fourth at USD 0.04 Billion, 2025, supported by long-distance gas pipelines and strong integrity standards. The rest of Asia Pacific added USD 0.06 Billion, 2025. Asia Pacific is attracting stronger attention from ROSEN, TDW, STATS Group, SGS, and Intero because it offers a mix of greenfield pre-commissioning and brownfield intelligent pigging opportunities. This region is expected to post the highest regional CAGR at 7.1%, 2025–2034.
Latin America Pipeline Pigging Services Market
Latin America accounted for 7.0% of the Pipeline Pigging Services Market, 2025, or USD 0.11 Billion, 2025. The region remains smaller than North America or Europe, but it offers concentrated high-value work in offshore-linked crude and gas systems, refinery connections, and cross-border gas transport. Brazil is the anchor market. Rystad highlighted reinforcement of Brazil’s interstate gas corridor in 2026, including the Corredor Pre-Sal Sul concept and Japeri compression progress, while Reuters reported pipeline-linked gas integration deals involving Argentina, Brazil, and Bolivia in late 2024 and 2025. These developments create a favorable base for commissioning, maintenance, and inspection services.
Brazil represented an estimated USD 0.06 Billion, 2025. Offshore development, gas corridor upgrades, and complex product handling keep service rates attractive. Mexico contributed USD 0.02 Billion, 2025, driven by gas transport and industrial maintenance scopes. Argentina generated USD 0.01 Billion, 2025, supported by Vaca Muerta-linked gas movement and future export corridor work. The rest of Latin America supplied USD 0.02 Billion, 2025. Competitive presence is strongest for Halliburton, Baker Hughes, TDW, and selected local service firms with pre-commissioning and drying capability. Growth will remain above the global average, but project timing and state-led capital cycles will keep demand uneven from year to year.
Middle East & Africa Pipeline Pigging Services Market
Middle East & Africa held 14.0% of the Pipeline Pigging Services Market, 2025, equal to USD 0.23 Billion, 2025. The region combines export pipelines, gas processing links, refinery corridors, and aging brownfield assets that require regular cleaning and integrity work. Pigging intensity is high in hydrocarbon-rich states because uptime risk is costly and the technical burden is often elevated by wax, scale, temperature, and remote terrain. Demand also benefits from new gas monetization and industrial corridor programs.
Saudi Arabia led the region at an estimated USD 0.06 Billion, 2025, supported by major oil and gas transport systems and a strong pipeline maintenance culture. The UAE followed at USD 0.04 Billion, 2025, driven by export-linked systems and industrial processing assets. South Africa accounted for USD 0.02 Billion, 2025, with activity centered on refined products and industrial networks. Rest of MEA, including Qatar, Oman, Kuwait, Nigeria, and Egypt, generated USD 0.11 Billion, 2025. The region favors suppliers that can mobilize rapidly and handle integrated packages spanning cleaning, nitrogen services, diagnostics, and offshore work. Halliburton and Baker Hughes remain strong in GCC-linked work, while TDW, ROSEN, SGS, and STATS Group compete in higher-spec integrity scopes.
Get More Information about this report -
Request Free Sample ReportMarket Key Segments
By Service Type
- Intelligent Pigging and Inline Inspection
- Utility Pigging
- Cleaning Pigging
- Batching and Displacement Pigging
By Pipeline Location
- Onshore Pipelines
- Offshore and Subsea Pipelines
By Application
- Natural Gas Pipelines
- Crude Oil Pipelines
- Refined Products Pipelines
- Chemical, Water, and Other Industrial Pipelines
By End Use
- Midstream Operators
- Upstream Gathering and Production
- Downstream Refining and Petrochemical Operators
- Utilities, Water, and Other Industrial Users
Regional Analysis and Coverage
- North America
- Latin America
- East Asia And Pacific
- Sea And South Asia
- Eastern Europe
- Western Europe
- Middle East & Africa
| Report Attribute | Details |
| Market size (2025) | USD 1.62 B |
| Forecast Revenue (2034) | USD 2.74 B |
| CAGR (2025-2034) | 6.0% |
| Historical data | 2021-2024 |
| Base Year For Estimation | 2025 |
| Forecast Period | 2026-2034 |
| Report coverage | Revenue Forecast, Competitive Landscape, Market Dynamics, Growth Factors, Trends and Recent Developments |
| Segments covered | By Service Type (Intelligent Pigging and Inline Inspection, Utility Pigging, Cleaning Pigging, Batching and Displacement Pigging), By Pipeline Location (Onshore Pipelines, Offshore and Subsea Pipelines), By Application (Natural Gas Pipelines, Crude Oil Pipelines, Refined Products Pipelines, Chemical, Water, and Other Industrial Pipelines), By End Use (Midstream Operators, Upstream Gathering and Production, Downstream Refining and Petrochemical Operators, Utilities, Water, and Other Industrial Users) |
| Research Methodology |
|
| Regional scope |
|
| Competitive Landscape | T.D. WILLIAMSON, ROSEN GROUP, BAKER HUGHES, HALLIBURTON, NDT GLOBAL, STATS GROUP, SGS, INTERO INTEGRITY SERVICES, NOV TUBOSCOPE, ROMSTAR GROUP, ENDURO PIPELINE SERVICES, CIRCOR, QUEST INTEGRITY, NACA PIGGING AND PRE-COMMISSIONING, 3P SERVICES, PII PIPELINE SOLUTIONS, Others |
| Customization Scope | Customization for segments, region/country-level will be provided. Moreover, additional customization can be done based on the requirements. |
| Pricing and Purchase Options | Avail customized purchase options to meet your exact research needs. We have three licenses to opt for: Single User License, Multi-User License (Up to 5 Users), Corporate Use License (Unlimited User and Printable PDF). |
, By Pipeline Location (Onshore Pipelines, Offshore and Subsea Pipelines), By Application (Natural Gas, Crude Oil, Refined Products, Industrial Pipelines), By End-User, Industry Trends, Competitive Landscape, Key Players, Regional Insights & Forecast 2026–2034")
, By Pipeline Location (Onshore Pipelines, Offshore and Subsea Pipelines), By Application (Natural Gas, Crude Oil, Refined Products, Industrial Pipelines), By End-User, Industry Trends, Competitive Landscape, Key Players, Regional Insights & Forecast 2026–2034")
, By Pipeline Location (Onshore Pipelines, Offshore and Subsea Pipelines), By Application (Natural Gas, Crude Oil, Refined Products, Industrial Pipelines), By End-User, Industry Trends, Competitive Landscape, Key Players, Regional Insights & Forecast 2026–2034")
Frequently Asked Questions
How big is the Pipeline Pigging Services Market?
The Global Pipeline Pigging Services Market was valued at USD 1.62 Billion in 2025, projected to reach USD 2.74 Billion by 2034, growing at a CAGR of 6.0% from 2026–2034, driven by rising pipeline integrity needs, regulatory compliance, and advancements in intelligent pigging technologies.
Who are the major players in the Pipeline Pigging Services Market?
T.D. WILLIAMSON, ROSEN GROUP, BAKER HUGHES, HALLIBURTON, NDT GLOBAL, STATS GROUP, SGS, INTERO INTEGRITY SERVICES, NOV TUBOSCOPE, ROMSTAR GROUP, ENDURO PIPELINE SERVICES, CIRCOR, QUEST INTEGRITY, NACA PIGGING AND PRE-COMMISSIONING, 3P SERVICES, PII PIPELINE SOLUTIONS, Others
Which segments covered the Pipeline Pigging Services Market?
By Service Type (Intelligent Pigging and Inline Inspection, Utility Pigging, Cleaning Pigging, Batching and Displacement Pigging), By Pipeline Location (Onshore Pipelines, Offshore and Subsea Pipelines), By Application (Natural Gas Pipelines, Crude Oil Pipelines, Refined Products Pipelines, Chemical, Water, and Other Industrial Pipelines), By End Use (Midstream Operators, Upstream Gathering and Production, Downstream Refining and Petrochemical Operators, Utilities, Water, and Other Industrial Users)
How can this market research report help my business make strategic decisions?
Our market research reports provide actionable intelligence, including verified market size data, CAGR projections, competitive benchmarking, and segment-level opportunity analysis. These insights support strategic planning, investment decisions, product development, and market entry strategies for enterprises and startups alike.
How frequently is the data updated?
We continuously monitor industry developments and update our reports to reflect regulatory changes, technological advancements, and macroeconomic shifts. Updated editions ensure you receive the latest market intelligence.

Select Licence Type
Connect with our sales team
Pipeline Pigging Services Market
Published Date : 20 Mar 2026 | Formats :Why IntelEvoResearch
100%
Customer
Satisfaction
24x7+
Availability - we are always
there when you need us
200+
Fortune 50 Companies trust
IntelEvoResearch
80%
of our reports are exclusive
and first in the industry
100%
more data
and analysis
1000+
reports published
till date
