Plant-Based Energy Drink Market Size, Share & Growth Forecast to 2034
Global Plant-Based Energy Drink Market Size, Share & Analysis By Type (Organic, Natural, Regular), By Product Type (Non-Alcoholic, Alcoholic), By Ingredients (Taurine, Caffeine, Guarana, Vitamin B, L-Carnitine, Antioxidants), By End-User (Kids, Teenagers, Adults), By Distribution Channel (Supermarkets/Hypermarkets, E-commerce, Grocery Stores, Convenience Stores), By Consumer Demographics Industry Regions & Key Players – Clean-Label Trends & Forecast 2025–2034
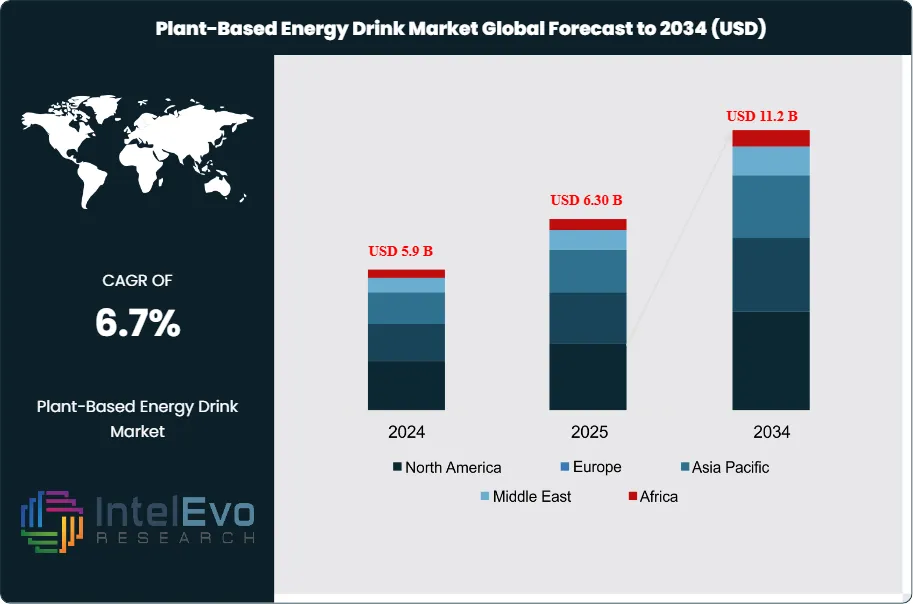
The Plant-Based Energy Drink Market size is expected to reach USD 11.2 billion by 2034, up from USD 5.9 billion in 2024, growing at a CAGR of 6.7% during the forecast period 2025–2034. This growth comes from more consumers wanting natural, clean-label, and sustainably sourced drinks. Health-conscious people are moving away from synthetic energy drinks and choosing plant-based options that contain natural caffeine, adaptogens, and antioxidants. The rising demand from millennials, athletes, and working professionals, along with more innovative flavors and useful formulas, is driving market growth. Also, packaging that focuses on sustainability and eco-friendly branding is changing how consumers buy drinks around the world. This expansion underscores the accelerating shift in consumer preferences toward healthier, natural, and sustainable alternatives to conventional energy beverages. North America currently dominates the market with a 42.6% share of the USD 2.3 billion segment, while other regions are emerging as high-potential investment hotspots.
Plant-based energy drinks, formulated from natural ingredients such as ginseng, guarana, yerba mate, and botanical extracts, are positioned as functional beverages that enhance physical energy and mental alertness without relying on synthetic additives. Their increasing adoption reflects a broader wellness-driven lifestyle trend, where consumers—particularly millennials and Gen Z—prioritize health, sustainability, and clean-label products.
Several key drivers are propelling market growth. Rising health consciousness and awareness of the adverse effects of sugar-laden, artificial energy drinks are compelling consumers to switch to plant-derived alternatives. Innovations in flavor development, ingredient blends, and convenient packaging formats are further widening the appeal of these beverages across diverse demographics. Additionally, the growing alignment of plant-based consumption with sustainability and ethical consumerism adds momentum, reinforcing long-term market attractiveness.
Despite robust growth prospects, the sector faces challenges such as premium pricing compared to conventional energy drinks, limited product penetration in developing economies, and the need for consumer education regarding functional plant-based ingredients. Addressing these hurdles through targeted marketing, cost-efficient production, and wider retail accessibility will be critical for sustained expansion.
Technological advancements are also reshaping the competitive landscape. Startups and established beverage brands are leveraging innovations in plant-based formulations, natural sweeteners, and fortification with vitamins, minerals, and adaptogens to differentiate their offerings. Recent funding rounds, including Odyssey Elixir’s USD 6.3 million Series A for mushroom-based energy drinks and Imaginary Ventures’ USD 4 million seed investment in a low-calorie caffeinated beverage brand, highlight the strong investor appetite for functional, health-aligned energy drinks.
Regionally, North America remains the largest market, supported by high consumer awareness and established distribution networks. However, Asia-Pacific and Europe are emerging as promising growth centers due to rising urbanization, expanding middle-class incomes, and increasing demand for premium functional beverages. Collectively, these dynamics position the plant-based energy drink market as a high-growth segment within the global beverage industry, offering significant opportunities for innovation and investment.
Market Growth: The Global Plant-Based Energy Drink Market is projected to reach USD 11.2 billion by 2034, rising from USD 5.9 billion in 2024 at a CAGR of 6.7% (2025–2034). Growth is fueled by rising consumer health awareness, demand for natural energy-boosting alternatives, and innovation in functional beverage formulations.
Product Type: Organic plant-based energy drinks command a 39.7% market share, reflecting a strong consumer shift toward clean-label, natural ingredients that align with wellness-oriented lifestyles.
Alcohol Content: Non-alcoholic plant-based energy drinks dominate with 79.7% of total sales, driven by mainstream consumer adoption and wider retail distribution compared to niche alcoholic variants.
Ingredient Profile: Caffeine-based formulations account for 31.2% of the market, bridging the gap between traditional energy drink users and health-conscious consumers seeking plant-derived caffeine sources such as guarana and yerba mate.
End Users: Adults represent the largest consumer group at 62.3%, as this demographic increasingly opts for healthier beverages that provide sustained energy and cognitive benefits without synthetic additives.
Distribution Channel: Supermarkets and hypermarkets capture 44.4% of market sales, benefiting from extensive product visibility, consumer accessibility, and promotional strategies that drive higher purchase frequency.
Driver: The surge in health consciousness, particularly among millennials and Gen Z, coupled with growing awareness of the side effects of synthetic energy drinks, is accelerating adoption of plant-based alternatives.
Restraint: Premium pricing compared to conventional energy drinks and limited penetration in developing economies remain key barriers to broader market expansion.
Opportunity: Emerging markets in Asia-Pacific and Latin America present strong growth potential, supported by rising disposable incomes, urbanization, and growing demand for functional beverages with natural ingredients.
Trend: Investment activity is reshaping the market, with notable funding such as Odyssey Elixir’s USD 6.3 million Series A for mushroom-based energy drinks, highlighting the trend toward functional, adaptogen-infused formulations.
Regional Analysis: North America leads with a USD 2.3 billion market value, accounting for 42.6% of global share, while Europe and Asia-Pacific are poised for rapid growth driven by expanding retail penetration and consumer demand for premium wellness beverages.
Type Analysis
As of 2025, organic plant-based energy drinks represent the largest share of the market, holding 39.7% of the category. Their dominance reflects growing consumer demand for beverages that are not only functional but also free from synthetic additives and aligned with sustainability values. Heightened awareness of the long-term health and environmental impacts of conventional energy drink formulations has accelerated the transition toward certified organic alternatives. Leading brands such as Guayaki and Runa continue to expand their organic lines, capitalizing on consumer trust in transparency and eco-friendly production methods.
The natural segment, accounting for 32.1% of the market, remains a strong performer as consumers increasingly prioritize minimally processed products with clean labels. Natural energy drinks that highlight ingredient integrity and sourcing transparency are appealing to wellness-focused buyers, particularly millennials and Gen Z.
The regular category, with 28.2% of the market, continues to serve a base of consumers loyal to conventional formulations or those driven by affordability. While its relevance persists, the long-term outlook suggests gradual share erosion as healthier alternatives gain traction and mainstream adoption.
Product Type Analysis
Non-alcoholic energy drinks dominate the market with a commanding 79.7% share in 2025. This category has become the default choice for consumers pursuing active lifestyles, hydration, and sustained energy without the risks associated with alcohol consumption. The segment benefits from its appeal across diverse age groups and its alignment with broader wellness trends. Companies like Red Bull Organics and Celsius Holdings are strengthening their portfolios in this space to cater to fitness enthusiasts, professionals, and everyday consumers.
In contrast, alcoholic plant-based energy drinks, though representing only 20.3% of the market, have carved out a niche segment. These beverages cater to social occasions where consumers seek a balance between the stimulating effects of energy ingredients and the recreational appeal of alcohol. Despite steady demand in urban nightlife settings, regulatory scrutiny and growing consumer health awareness are likely to limit large-scale expansion.
Ingredients Analysis
In 2025, caffeine remains the most widely used ingredient, featured in 31.2% of plant-based energy drink formulations. Its reputation as a proven stimulant makes it indispensable, with increasing reliance on natural caffeine sources such as yerba mate, guarana, and green tea extract to enhance product positioning.
Taurine, holding 21.8% of the market, continues to play a key role in supporting metabolic and neurological functions, making it a common inclusion in premium formulations. Guarana, with an 18.6% share, offers an alternative caffeine source valued for its gradual energy release and reduced likelihood of causing energy crashes, broadening its appeal among consumers sensitive to synthetic stimulants.
Other functional ingredients include Vitamin B complexes (12.4%) and L-Carnitine (9.5%), both critical in supporting energy metabolism, while antioxidants (6.5%) are increasingly marketed for their ability to reduce oxidative stress. Together, these ingredient profiles underscore how manufacturers are balancing traditional stimulants with health-focused additives to cater to a broader spectrum of consumer needs.
End-User Analysis
Adults are the primary consumer base, accounting for 62.3% of demand in 2025. This segment aligns most closely with the wellness and performance positioning of plant-based energy drinks, as working professionals, athletes, and health-conscious buyers integrate these beverages into daily routines for enhanced productivity and endurance.
Teenagers, representing 25.4% of the market, are drawn by flavor innovation, branding, and lifestyle alignment. This group remains highly trend-sensitive, offering opportunities for companies to experiment with bold flavors and targeted marketing campaigns. However, concerns about caffeine safety among younger consumers may temper future growth in this segment.
Children, at 12.3%, form the smallest segment, reflecting cautious parental attitudes and the limited number of kid-friendly formulations available. While some opportunities exist for caffeine-free or vitamin-enhanced plant-based beverages tailored to younger consumers, most manufacturers continue to focus their efforts on adult and teenage markets where growth is more scalable.
Distribution Channel Analysis
Supermarkets and hypermarkets remain the most influential distribution channel in 2025, holding 44.4% of sales. Their success is driven by broad product visibility, competitive pricing, and promotional activities that encourage both bulk and impulse purchases. Their established presence in urban and suburban areas makes them a cornerstone for large-scale consumer reach.
E-commerce, which now accounts for 27.8% of sales, is rapidly transforming the industry landscape. Digital platforms provide consumers with greater product variety, transparent ingredient information, and personalized recommendations, appealing strongly to tech-savvy and health-conscious buyers. Online-first brands are leveraging direct-to-consumer models to strengthen customer loyalty and optimize margins.
Grocery stores (13.6%) and convenience stores (9.2%) continue to serve as critical channels for everyday and last-minute purchases. Meanwhile, the “others” category (5.0%), including specialty health stores and direct sales, caters to niche segments seeking premium or highly specialized formulations. These alternative channels also play a role in introducing innovative products to early adopters.
Regional Analysis
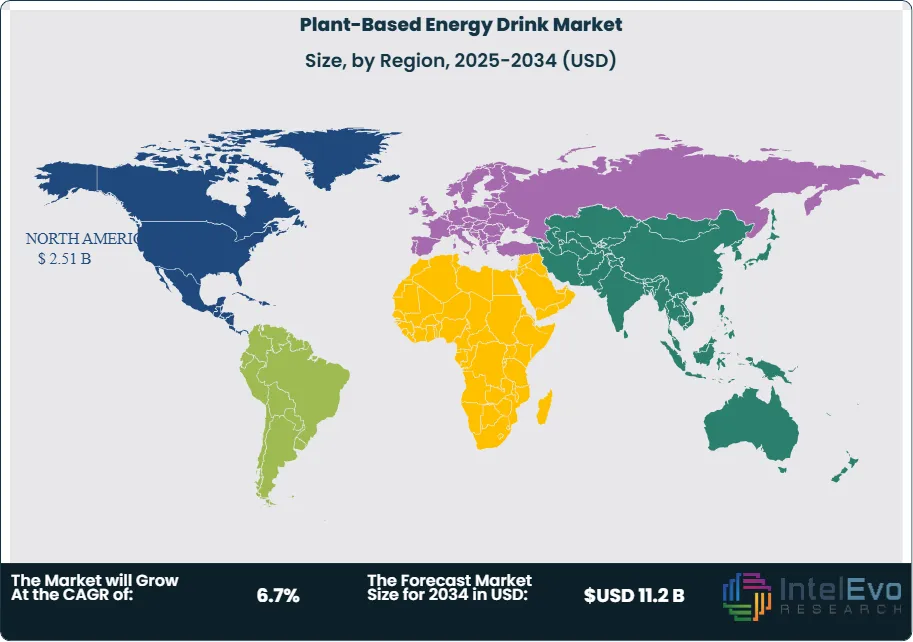
The global market is segmented into five major regions: North America, Europe, Asia-Pacific, Latin America, and the Middle East & Africa, each reflecting unique consumption dynamics.
North America continues to dominate, representing 42.6% of the market and valued at USD 2.3 billion. The region’s leadership stems from strong consumer awareness of plant-based alternatives, high purchasing power, and the presence of leading brands. The U.S. remains a hub for innovation, with startups and established players experimenting with functional, adaptogen-infused formulations.
Europe ranks second, driven by strict food safety regulations, consumer interest in organic and sustainable products, and an expanding fitness culture. Countries like Germany, the UK, and the Nordics are particularly receptive to natural and clean-label energy drinks.
Asia-Pacific is the fastest-growing region, fueled by rising disposable incomes, rapid urbanization, and growing demand for functional beverages. China and India are emerging hotspots, where both local and international brands are leveraging diverse plant-based ingredients to cater to regional flavor preferences.
Latin America and the Middle East & Africa remain smaller markets but are experiencing gradual uptake. Urbanization, lifestyle changes, and exposure to Western consumption patterns are creating new opportunities, especially in metropolitan centers. Companies entering these regions are focusing on affordability and flavor localization to build brand presence.
By Type (Organic, Natural, Regular), By Product Type (Non-Alcoholic, Alcoholic), By Ingredients (Taurine, Caffeine, Guarana, Vitamin B, L-Carnitine, Antioxidants, Others), By End-User (Kids, Teenagers, Adults), By Distribution Channel (Supermarkets/Hypermarkets, E-commerce, Grocery Stores, Convenience Stores, Others)
Research Methodology
Primary Research- 100 Interviews of Stakeholders
Secondary Research
Desk Research
Regional scope
North America (United States, Canada, Mexico)
Latin America (Brazil, Argentina, Columbia)
East Asia And Pacific (China, Japan, South Korea, Australia, Cambodia, Fiji, Indonesia)
Sea And South Asia (India, Singapore, Thailand, Taiwan, Malaysia)
Eastern Europe (Poland, Russia, Czech Republic, Romania)
Western Europe (Germany, U.K., France, Spain, Itlay)
Middle East & Africa (GCC Countries, Egypt, Nigeria, South Africa, Israel)
Competitive Landscape
BA Sports Nutrition, LLC., Clean Cause, Garden of Life, Guayakí, Guru Energy, Muci, Nestlé, Nightwatchdrink, OCA Beverages, Ocean Beverages, PepsiCo, Proper Wild, Inc., RIOT Energy, Runa Energy Drink, Tenzing Natural Energy Ltd, Thin Energy Hydration, ToroMatcha
Customization Scope
Customization for segments, region/country-level will be provided. Moreover, additional customization can be done based on the requirements.
Pricing and Purchase Options
Avail customized purchase options to meet your exact research needs. We have three licenses to opt for: Single User License, Multi-User License (Up to 5 Users), Corporate Use License (Unlimited User and Printable PDF).
TABLE OF CONTENTS
1. EXECUTIVE SUMMARY
1.1. MARKET SNAPSHOT
1.2. KEY FINDINGS & INSIGHTS
1.3. ANALYST RECOMMENDATIONS
1.4. FUTURE OUTLOOK
2. RESEARCH METHODOLOGY
2.1. MARKET DEFINITION & SCOPE
2.2. RESEARCH OBJECTIVES: PRIMARY & SECONDARY DATA SOURCES
2.3. DATA COLLECTION SOURCES
2.3.1. COVERAGE OF 100+ PRIMARY RESEARCH/CONSULTATION CALLS WITH INDUSTRY STAKEHOLDERS
FIGURE 17 NORTH AMERICA PLANT-BASED ENERGY DRINK CURRENT AND FUTURE TYPE ANALYSIS, 2025–2034, (USD MILLION)
FIGURE 18 NORTH AMERICA PLANT-BASED ENERGY DRINK CURRENT AND FUTURE END USER ANALYSIS, 2025–2034, (USD MILLION)
FIGURE 19 MARKET SHARE BY COUNTRY
FIGURE 20 LATIN AMERICA PLANT-BASED ENERGY DRINK CURRENT AND FUTURE TYPE ANALYSIS, 2025–2034, (USD MILLION)
FIGURE 21 LATIN AMERICA PLANT-BASED ENERGY DRINK CURRENT AND FUTURE END USER ANALYSIS, 2025–2034, (USD MILLION)
FIGURE 22 MARKET SHARE BY COUNTRY
FIGURE 23 EASTERN EUROPE PLANT-BASED ENERGY DRINK CURRENT AND FUTURE TYPE ANALYSIS, 2025–2034, (USD MILLION)
FIGURE 24 EASTERN EUROPE PLANT-BASED ENERGY DRINK CURRENT AND FUTURE END USER ANALYSIS, 2025–2034, (USD MILLION)
FIGURE 25 MARKET SHARE BY COUNTRY
FIGURE 26 WESTERN EUROPE PLANT-BASED ENERGY DRINK CURRENT AND FUTURE TYPE ANALYSIS, 2025–2034, (USD MILLION)
FIGURE 27 WESTERN EUROPE PLANT-BASED ENERGY DRINK CURRENT AND FUTURE END USER ANALYSIS, 2025–2034, (USD MILLION)
FIGURE 28 MARKET SHARE BY COUNTRY
FIGURE 29 EAST ASIA AND PACIFIC PLANT-BASED ENERGY DRINK CURRENT AND FUTURE TYPE ANALYSIS, 2025–2034, (USD MILLION)
FIGURE 30 EAST ASIA AND PACIFIC PLANT-BASED ENERGY DRINK CURRENT AND FUTURE END USER ANALYSIS, 2025–2034, (USD MILLION)
FIGURE 31 MARKET SHARE BY COUNTRY
FIGURE 32 SEA AND SOUTH ASIA PLANT-BASED ENERGY DRINK CURRENT AND FUTURE TYPE ANALYSIS, 2025–2034, (USD MILLION)
FIGURE 33 SEA AND SOUTH ASIA PLANT-BASED ENERGY DRINK CURRENT AND FUTURE END USER ANALYSIS, 2025–2034, (USD MILLION)
FIGURE 34 MARKET SHARE BY COUNTRY
FIGURE 35 MIDDLE EAST AND AFRICA PLANT-BASED ENERGY DRINK CURRENT AND FUTURE TYPE ANALYSIS, 2025–2034, (USD MILLION)
FIGURE 36 MIDDLE EAST AND AFRICA PLANT-BASED ENERGY DRINK CURRENT AND FUTURE END USER ANALYSIS, 2025–2034, (USD MILLION)
FIGURE 37 NORTH AMERICA PLANT-BASED ENERGY DRINK CURRENT AND FUTURE MARKET VOLUME SHARE REGIONAL ANALYSIS, 2025–2034, (USD MILLION)
FIGURE 38 U.S. PLANT-BASED ENERGY DRINK CURRENT AND FUTURE TYPE ANALYSIS, 2025–2034, (USD MILLION)
FIGURE 39 U.S. PLANT-BASED ENERGY DRINK CURRENT AND FUTURE END USER ANALYSIS, 2025–2034, (USD MILLION)
FIGURE 40 CANADA PLANT-BASED ENERGY DRINK CURRENT AND FUTURE TYPE ANALYSIS, 2025–2034, (USD MILLION)
FIGURE 41 CANADA PLANT-BASED ENERGY DRINK CURRENT AND FUTURE END USER ANALYSIS, 2025–2034, (USD MILLION)
FIGURE 42 LATIN AMERICA PLANT-BASED ENERGY DRINK CURRENT AND FUTURE MARKET VOLUME SHARE REGIONAL ANALYSIS, 2025–2034, (USD MILLION)
FIGURE 43 MEXICO PLANT-BASED ENERGY DRINK CURRENT AND FUTURE TYPE ANALYSIS, 2025–2034, (USD MILLION)
FIGURE 44 MEXICO PLANT-BASED ENERGY DRINK CURRENT AND FUTURE END USER ANALYSIS, 2025–2034, (USD MILLION)
FIGURE 45 BRAZIL PLANT-BASED ENERGY DRINK CURRENT AND FUTURE TYPE ANALYSIS, 2025–2034, (USD MILLION)
FIGURE 46 BRAZIL PLANT-BASED ENERGY DRINK CURRENT AND FUTURE END USER ANALYSIS, 2025–2034, (USD MILLION)
FIGURE 47 ARGENTINA PLANT-BASED ENERGY DRINK CURRENT AND FUTURE TYPE ANALYSIS, 2025–2034, (USD MILLION)
FIGURE 48 ARGENTINA PLANT-BASED ENERGY DRINK CURRENT AND FUTURE END USER ANALYSIS, 2025–2034, (USD MILLION)
FIGURE 49 COLUMBIA PLANT-BASED ENERGY DRINK CURRENT AND FUTURE TYPE ANALYSIS, 2025–2034, (USD MILLION)
FIGURE 50 COLUMBIA PLANT-BASED ENERGY DRINK CURRENT AND FUTURE END USER ANALYSIS, 2025–2034, (USD MILLION)
FIGURE 51 REST OF LATIN AMERICA PLANT-BASED ENERGY DRINK CURRENT AND FUTURE TYPE ANALYSIS, 2025–2034, (USD MILLION)
FIGURE 52 REST OF LATIN AMERICA PLANT-BASED ENERGY DRINK CURRENT AND FUTURE END USER ANALYSIS, 2025–2034, (USD MILLION)
FIGURE 53 EASTERN EUROPE PLANT-BASED ENERGY DRINK CURRENT AND FUTURE MARKET VOLUME SHARE REGIONAL ANALYSIS, 2025–2034, (USD MILLION)
FIGURE 54 POLAND PLANT-BASED ENERGY DRINK CURRENT AND FUTURE TYPE ANALYSIS, 2025–2034, (USD MILLION)
FIGURE 55 POLAND PLANT-BASED ENERGY DRINK CURRENT AND FUTURE END USER ANALYSIS, 2025–2034, (USD MILLION)
FIGURE 56 RUSSIA PLANT-BASED ENERGY DRINK CURRENT AND FUTURE TYPE ANALYSIS, 2025–2034, (USD MILLION)
FIGURE 57 RUSSIA PLANT-BASED ENERGY DRINK CURRENT AND FUTURE END USER ANALYSIS, 2025–2034, (USD MILLION)
FIGURE 58 CZECH REPUBLIC PLANT-BASED ENERGY DRINK CURRENT AND FUTURE TYPE ANALYSIS, 2025–2034, (USD MILLION)
FIGURE 59 CZECH REPUBLIC PLANT-BASED ENERGY DRINK CURRENT AND FUTURE END USER ANALYSIS, 2025–2034, (USD MILLION)
FIGURE 60 ROMANIA PLANT-BASED ENERGY DRINK CURRENT AND FUTURE TYPE ANALYSIS, 2025–2034, (USD MILLION)
FIGURE 61 ROMANIA PLANT-BASED ENERGY DRINK CURRENT AND FUTURE END USER ANALYSIS, 2025–2034, (USD MILLION)
FIGURE 62 REST OF EASTERN EUROPE PLANT-BASED ENERGY DRINK CURRENT AND FUTURE TYPE ANALYSIS, 2025–2034, (USD MILLION)
FIGURE 63 REST OF EASTERN EUROPE PLANT-BASED ENERGY DRINK CURRENT AND FUTURE END USER ANALYSIS, 2025–2034, (USD MILLION)
FIGURE 64 WESTERN EUROPE PLANT-BASED ENERGY DRINK CURRENT AND FUTURE MARKET VOLUME SHARE REGIONAL ANALYSIS, 2025–2034, (USD MILLION)
FIGURE 65 GERMANY PLANT-BASED ENERGY DRINK CURRENT AND FUTURE TYPE ANALYSIS, 2025–2034, (USD MILLION)
FIGURE 66 GERMANY PLANT-BASED ENERGY DRINK CURRENT AND FUTURE END USER ANALYSIS, 2025–2034, (USD MILLION)
FIGURE 67 FRANCE PLANT-BASED ENERGY DRINK CURRENT AND FUTURE TYPE ANALYSIS, 2025–2034, (USD MILLION)
FIGURE 68 FRANCE PLANT-BASED ENERGY DRINK CURRENT AND FUTURE END USER ANALYSIS, 2025–2034, (USD MILLION)
FIGURE 69 UK PLANT-BASED ENERGY DRINK CURRENT AND FUTURE TYPE ANALYSIS, 2025–2034, (USD MILLION)
FIGURE 70 UK PLANT-BASED ENERGY DRINK CURRENT AND FUTURE END USER ANALYSIS, 2025–2034, (USD MILLION)
FIGURE 71 SPAIN PLANT-BASED ENERGY DRINK CURRENT AND FUTURE TYPE ANALYSIS, 2025–2034, (USD MILLION)
FIGURE 72 SPAIN PLANT-BASED ENERGY DRINK CURRENT AND FUTURE END USER ANALYSIS, 2025–2034, (USD MILLION)
FIGURE 73 ITALY PLANT-BASED ENERGY DRINK CURRENT AND FUTURE TYPE ANALYSIS, 2025–2034, (USD MILLION)
FIGURE 74 ITALY PLANT-BASED ENERGY DRINK CURRENT AND FUTURE END USER ANALYSIS, 2025–2034, (USD MILLION)
FIGURE 75 REST OF WESTERN EUROPE PLANT-BASED ENERGY DRINK CURRENT AND FUTURE TYPE ANALYSIS, 2025–2034, (USD MILLION)
FIGURE 76 REST OF WESTERN EUROPE PLANT-BASED ENERGY DRINK CURRENT AND FUTURE END USER ANALYSIS, 2025–2034, (USD MILLION)
FIGURE 77 EAST ASIA AND PACIFIC PLANT-BASED ENERGY DRINK CURRENT AND FUTURE MARKET VOLUME SHARE REGIONAL ANALYSIS, 2025–2034, (USD MILLION)
FIGURE 78 CHINA PLANT-BASED ENERGY DRINK CURRENT AND FUTURE TYPE ANALYSIS, 2025–2034, (USD MILLION)
FIGURE 79 CHINA PLANT-BASED ENERGY DRINK CURRENT AND FUTURE END USER ANALYSIS, 2025–2034, (USD MILLION)
FIGURE 80 JAPAN PLANT-BASED ENERGY DRINK CURRENT AND FUTURE TYPE ANALYSIS, 2025–2034, (USD MILLION)
FIGURE 81 JAPAN PLANT-BASED ENERGY DRINK CURRENT AND FUTURE END USER ANALYSIS, 2025–2034, (USD MILLION)
FIGURE 82 AUSTRALIA PLANT-BASED ENERGY DRINK CURRENT AND FUTURE TYPE ANALYSIS, 2025–2034, (USD MILLION)
FIGURE 83 AUSTRALIA PLANT-BASED ENERGY DRINK CURRENT AND FUTURE END USER ANALYSIS, 2025–2034, (USD MILLION)
FIGURE 84 CAMBODIA PLANT-BASED ENERGY DRINK CURRENT AND FUTURE TYPE ANALYSIS, 2025–2034, (USD MILLION)
FIGURE 85 CAMBODIA PLANT-BASED ENERGY DRINK CURRENT AND FUTURE END USER ANALYSIS, 2025–2034, (USD MILLION)
FIGURE 86 FIJI PLANT-BASED ENERGY DRINK CURRENT AND FUTURE TYPE ANALYSIS, 2025–2034, (USD MILLION)
FIGURE 87 FIJI PLANT-BASED ENERGY DRINK CURRENT AND FUTURE END USER ANALYSIS, 2025–2034, (USD MILLION)
FIGURE 88 INDONESIA PLANT-BASED ENERGY DRINK CURRENT AND FUTURE TYPE ANALYSIS, 2025–2034, (USD MILLION)
FIGURE 89 INDONESIA PLANT-BASED ENERGY DRINK CURRENT AND FUTURE END USER ANALYSIS, 2025–2034, (USD MILLION)
FIGURE 90 SOUTH KOREA PLANT-BASED ENERGY DRINK CURRENT AND FUTURE TYPE ANALYSIS, 2025–2034, (USD MILLION)
FIGURE 91 SOUTH KOREA PLANT-BASED ENERGY DRINK CURRENT AND FUTURE END USER ANALYSIS, 2025–2034, (USD MILLION)
FIGURE 92 REST OF EAST ASIA AND PACIFIC PLANT-BASED ENERGY DRINK CURRENT AND FUTURE TYPE ANALYSIS, 2025–2034, (USD MILLION)
FIGURE 93 REST OF EAST ASIA AND PACIFIC PLANT-BASED ENERGY DRINK CURRENT AND FUTURE END USER ANALYSIS, 2025–2034, (USD MILLION)
FIGURE 94 SEA AND SOUTH ASIA PLANT-BASED ENERGY DRINK CURRENT AND FUTURE MARKET VOLUME SHARE REGIONAL ANALYSIS, 2025–2034, (USD MILLION)
FIGURE 95 BANGLADESH PLANT-BASED ENERGY DRINK CURRENT AND FUTURE TYPE ANALYSIS, 2025–2034, (USD MILLION)
FIGURE 96 BANGLADESH PLANT-BASED ENERGY DRINK CURRENT AND FUTURE END USER ANALYSIS, 2025–2034, (USD MILLION)
FIGURE 97 NEW ZEALAND PLANT-BASED ENERGY DRINK CURRENT AND FUTURE TYPE ANALYSIS, 2025–2034, (USD MILLION)
FIGURE 98 NEW ZEALAND PLANT-BASED ENERGY DRINK CURRENT AND FUTURE END USER ANALYSIS, 2025–2034, (USD MILLION)
FIGURE 99 INDIA PLANT-BASED ENERGY DRINK CURRENT AND FUTURE TYPE ANALYSIS, 2025–2034, (USD MILLION)
FIGURE 100 INDIA PLANT-BASED ENERGY DRINK CURRENT AND FUTURE END USER ANALYSIS, 2025–2034, (USD MILLION)
FIGURE 101 SINGAPORE PLANT-BASED ENERGY DRINK CURRENT AND FUTURE TYPE ANALYSIS, 2025–2034, (USD MILLION)
FIGURE 102 SINGAPORE PLANT-BASED ENERGY DRINK CURRENT AND FUTURE END USER ANALYSIS, 2025–2034, (USD MILLION)
FIGURE 103 THAILAND PLANT-BASED ENERGY DRINK CURRENT AND FUTURE TYPE ANALYSIS, 2025–2034, (USD MILLION)
FIGURE 104 THAILAND PLANT-BASED ENERGY DRINK CURRENT AND FUTURE END USER ANALYSIS, 2025–2034, (USD MILLION)
FIGURE 105 TAIWAN PLANT-BASED ENERGY DRINK CURRENT AND FUTURE TYPE ANALYSIS, 2025–2034, (USD MILLION)
FIGURE 106 TAIWAN PLANT-BASED ENERGY DRINK CURRENT AND FUTURE END USER ANALYSIS, 2025–2034, (USD MILLION)
FIGURE 107 MALAYSIA PLANT-BASED ENERGY DRINK CURRENT AND FUTURE TYPE ANALYSIS, 2025–2034, (USD MILLION)
FIGURE 108 MALAYSIA PLANT-BASED ENERGY DRINK CURRENT AND FUTURE END USER ANALYSIS, 2025–2034, (USD MILLION)
FIGURE 109 REST OF SEA AND SOUTH ASIA PLANT-BASED ENERGY DRINK CURRENT AND FUTURE TYPE ANALYSIS, 2025–2034, (USD MILLION)
FIGURE 110 REST OF SEA AND SOUTH ASIA PLANT-BASED ENERGY DRINK CURRENT AND FUTURE END USER ANALYSIS, 2025–2034, (USD MILLION)
FIGURE 111 MIDDLE EAST AND AFRICA PLANT-BASED ENERGY DRINK CURRENT AND FUTURE MARKET VOLUME SHARE REGIONAL ANALYSIS, 2025–2034, (USD MILLION)
FIGURE 112 GCC COUNTRIES PLANT-BASED ENERGY DRINK CURRENT AND FUTURE TYPE ANALYSIS, 2025–2034, (USD MILLION)
FIGURE 113 GCC COUNTRIES PLANT-BASED ENERGY DRINK CURRENT AND FUTURE END USER ANALYSIS, 2025–2034, (USD MILLION)
FIGURE 114 SAUDI ARABIA PLANT-BASED ENERGY DRINK CURRENT AND FUTURE TYPE ANALYSIS, 2025–2034, (USD MILLION)
FIGURE 115 SAUDI ARABIA PLANT-BASED ENERGY DRINK CURRENT AND FUTURE END USER ANALYSIS, 2025–2034, (USD MILLION)
FIGURE 116 UAE PLANT-BASED ENERGY DRINK CURRENT AND FUTURE TYPE ANALYSIS, 2025–2034, (USD MILLION)
FIGURE 117 UAE PLANT-BASED ENERGY DRINK CURRENT AND FUTURE END USER ANALYSIS, 2025–2034, (USD MILLION)
FIGURE 118 BAHRAIN PLANT-BASED ENERGY DRINK CURRENT AND FUTURE TYPE ANALYSIS, 2025–2034, (USD MILLION)
FIGURE 119 BAHRAIN PLANT-BASED ENERGY DRINK CURRENT AND FUTURE END USER ANALYSIS, 2025–2034, (USD MILLION)
FIGURE 120 KUWAIT PLANT-BASED ENERGY DRINK CURRENT AND FUTURE TYPE ANALYSIS, 2025–2034, (USD MILLION)
FIGURE 121 KUWAIT PLANT-BASED ENERGY DRINK CURRENT AND FUTURE END USER ANALYSIS, 2025–2034, (USD MILLION)
FIGURE 122 OMAN PLANT-BASED ENERGY DRINK CURRENT AND FUTURE TYPE ANALYSIS, 2025–2034, (USD MILLION)
FIGURE 123 OMAN PLANT-BASED ENERGY DRINK CURRENT AND FUTURE END USER ANALYSIS, 2025–2034, (USD MILLION)
FIGURE 124 QATAR PLANT-BASED ENERGY DRINK CURRENT AND FUTURE TYPE ANALYSIS, 2025–2034, (USD MILLION)
FIGURE 125 QATAR PLANT-BASED ENERGY DRINK CURRENT AND FUTURE END USER ANALYSIS, 2025–2034, (USD MILLION)
FIGURE 126 EGYPT PLANT-BASED ENERGY DRINK CURRENT AND FUTURE TYPE ANALYSIS, 2025–2034, (USD MILLION)
FIGURE 127 EGYPT PLANT-BASED ENERGY DRINK CURRENT AND FUTURE END USER ANALYSIS, 2025–2034, (USD MILLION)
FIGURE 128 NIGERIA PLANT-BASED ENERGY DRINK CURRENT AND FUTURE TYPE ANALYSIS, 2025–2034, (USD MILLION)
FIGURE 129 NIGERIA PLANT-BASED ENERGY DRINK CURRENT AND FUTURE END USER ANALYSIS, 2025–2034, (USD MILLION)
FIGURE 130 SOUTH AFRICA PLANT-BASED ENERGY DRINK CURRENT AND FUTURE TYPE ANALYSIS, 2025–2034, (USD MILLION)
FIGURE 131 SOUTH AFRICA PLANT-BASED ENERGY DRINK CURRENT AND FUTURE END USER ANALYSIS, 2025–2034, (USD MILLION)
FIGURE 132 ISRAEL PLANT-BASED ENERGY DRINK CURRENT AND FUTURE TYPE ANALYSIS, 2025–2034, (USD MILLION)
FIGURE 133 ISRAEL PLANT-BASED ENERGY DRINK CURRENT AND FUTURE END USER ANALYSIS, 2025–2034, (USD MILLION)
FIGURE 134 REST OF MEA PLANT-BASED ENERGY DRINK CURRENT AND FUTURE TYPE ANALYSIS, 2025–2034, (USD MILLION)
FIGURE 135 REST OF MEA PLANT-BASED ENERGY DRINK CURRENT AND FUTURE END USER ANALYSIS, 2025–2034, (USD MILLION)
FIGURE 136 U. S. MARKET SHARE ANALYSIS BY TYPE (2024)
FIGURE 137 U. S. MARKET SHARE ANALYSIS BY END USER (2024)
FIGURE 138 CANADA MARKET SHARE ANALYSIS BY TYPE (2024)
FIGURE 139 CANADA MARKET SHARE ANALYSIS BY END USER (2024)
FIGURE 140 MEXICO MARKET SHARE ANALYSIS BY TYPE (2024)
FIGURE 141 MEXICO MARKET SHARE ANALYSIS BY END USER (2024)
FIGURE 142 CHINA MARKET SHARE ANALYSIS BY TYPE (2024)
FIGURE 143 CHINA MARKET SHARE ANALYSIS BY END USER (2024)
FIGURE 144 JAPAN MARKET SHARE ANALYSIS BY TYPE (2024)
FIGURE 145 JAPAN MARKET SHARE ANALYSIS BY END USER (2024)
FIGURE 146 INDIA MARKET SHARE ANALYSIS BY TYPE (2024)
FIGURE 147 INDIA MARKET SHARE ANALYSIS BY END USER (2024)
FIGURE 148 SOUTH KOREA MARKET SHARE ANALYSIS BY TYPE (2024)
FIGURE 149 SOUTH KOREA MARKET SHARE ANALYSIS BY END USER (2024)
FIGURE 150 SAUDI ARABIA MARKET SHARE ANALYSIS BY TYPE (2024)
FIGURE 151 SAUDI ARABIA MARKET SHARE ANALYSIS BY END USER (2024)
FIGURE 152 UAE MARKET SHARE ANALYSIS BY TYPE (2024)
FIGURE 153 UAE MARKET SHARE ANALYSIS BY END USER (2024)
FIGURE 154 EGYPT MARKET SHARE ANALYSIS BY TYPE (2024)
FIGURE 155 EGYPT MARKET SHARE ANALYSIS BY END USER (2024)
FIGURE 156 NIGERIA MARKET SHARE ANALYSIS BY TYPE (2024)
FIGURE 157 NIGERIA MARKET SHARE ANALYSIS BY END USER (2024)
FIGURE 158 SOUTH AFRICA MARKET SHARE ANALYSIS BY TYPE (2024)
FIGURE 159 SOUTH AFRICA MARKET SHARE ANALYSIS BY END USER (2024)
FIGURE 160 GERMANY MARKET SHARE ANALYSIS BY TYPE (2024)
FIGURE 161 GERMANY MARKET SHARE ANALYSIS BY END USER (2024)
FIGURE 162 FRANCE MARKET SHARE ANALYSIS BY TYPE (2024)
FIGURE 163 FRANCE MARKET SHARE ANALYSIS BY END USER (2024)
FIGURE 164 UK MARKET SHARE ANALYSIS BY TYPE (2024)
FIGURE 165 UK MARKET SHARE ANALYSIS BY END USER (2024)
FIGURE 166 SPAIN MARKET SHARE ANALYSIS BY TYPE (2024)
FIGURE 167 SPAIN MARKET SHARE ANALYSIS BY END USER (2024)
FIGURE 168 ITALY MARKET SHARE ANALYSIS BY TYPE (2024)
FIGURE 169 ITALY MARKET SHARE ANALYSIS BY END USER (2024)
FIGURE 170 BRAZIL MARKET SHARE ANALYSIS BY TYPE (2024)
FIGURE 171 BRAZIL MARKET SHARE ANALYSIS BY END USER (2024)
FIGURE 172 ARGENTINA MARKET SHARE ANALYSIS BY TYPE (2024)
FIGURE 173 ARGENTINA MARKET SHARE ANALYSIS BY END USER (2024)
FIGURE 174 COLUMBIA MARKET SHARE ANALYSIS BY TYPE (2024)
FIGURE 175 COLUMBIA MARKET SHARE ANALYSIS BY END USER (2024)
FIGURE 176 GLOBAL PLANT-BASED ENERGY DRINK CURRENT AND FUTURE MARKET KEY COUNTRY LEVEL ANALYSIS, 2024–2034, (USD MILLION)
FIGURE 177 FINANCIAL OVERVIEW:
Key Player Analysis
BA Sports Nutrition, LLC.: BA Sports Nutrition, best known for its BodyArmor brand, has evolved into a major force in the functional beverage segment by broadening its portfolio to include plant-based formulations. Positioned as a mainstream leader, the company leverages Coca-Cola’s global distribution network to accelerate accessibility and visibility of its plant-based energy offerings. Its strategy emphasizes performance-driven hydration combined with natural caffeine sources, appealing to athletes and health-conscious consumers alike.
In 2025, BA Sports Nutrition has strengthened its competitive edge through digital-first campaigns that highlight clean ingredients and sustainable packaging. By aligning its product innovation with rising consumer demand for transparency and wellness, the company has secured a strong foothold among both performance-oriented and lifestyle-driven buyers. Its ability to scale production while maintaining brand authenticity positions it as a market stabilizer with broad influence.
Clean Cause: Clean Cause differentiates itself as a purpose-driven disruptor, uniquely blending functional energy beverages with a strong social mission. The company donates 50% of its profits to support addiction recovery programs, which has become a powerful brand story resonating with socially conscious consumers. Its product portfolio is centered on sparkling yerba mate–based energy drinks, balancing natural caffeine delivery with reduced sugar options.
By 2025, Clean Cause has expanded beyond niche health retailers into mainstream supermarkets and digital platforms, using transparency and social impact as a competitive advantage. Its model reflects the broader trend of consumers favoring brands that integrate corporate responsibility into product offerings. Positioned as both a wellness innovator and a values-led challenger brand, Clean Cause continues to capture loyalty in a crowded marketplace.
Garden of Life: Garden of Life, traditionally recognized for its organic supplements and nutrition products, has extended its expertise into the plant-based energy drink segment. Leveraging its reputation for certified organic, non-GMO, and clean-label formulations, the company has gained traction with health-conscious consumers seeking multifunctional beverages that deliver both energy and nutritional support. Its products often integrate botanical extracts, probiotics, and vitamins, differentiating them from conventional energy drink offerings.
In 2025, Garden of Life has advanced its strategy by linking functional energy beverages to holistic wellness, positioning itself at the intersection of performance and preventative health. By capitalizing on established trust within the natural products space, the brand has effectively bridged its supplement expertise with the rapidly expanding plant-based beverage category. This cross-category credibility positions Garden of Life as a premium innovator in the market.
Guayakí: Guayakí remains one of the most prominent pioneers in the plant-based energy sector, with yerba mate at the core of its identity. As of 2025, the company continues to lead as an innovator by combining authentic South American traditions with modern consumer demands for clean-label, functional energy solutions. Its wide range of ready-to-drink yerba mate beverages appeals to both mainstream and niche markets, supported by strong sustainability narratives.
Beyond product innovation, Guayakí’s market differentiation lies in its regenerative business model, which emphasizes social equity, biodiversity preservation, and sustainable farming practices. This positions the company not only as a beverage producer but as a lifestyle brand embodying conscious consumption. Its emphasis on cultural authenticity and ecological stewardship has secured Guayakí a loyal following, making it a key driver of category awareness and expansion globally.
Market Key Players
BA Sports Nutrition, LLC.
Clean Cause
Garden of Life
Guayakí
Guru Energy
Muci
Nestlé
Nightwatchdrink
OCA Beverages
Ocean Beverages
PepsiCo
Proper Wild, Inc.
RIOT Energy
Runa Energy Drink
Tenzing Natural Energy Ltd
Thin Energy Hydration
ToroMatcha
Driver
Rising Demand for Clean-Label
As of 2025, one of the most powerful growth drivers for the plant-based energy drink market is the accelerating global shift toward health-focused and clean-label beverages. Consumers are actively replacing traditional energy drinks—often criticized for high sugar levels and artificial additives—with formulations built around natural caffeine, vitamins, and plant extracts such as yerba mate, guarana, and green tea. This transition is reinforced by rising awareness of the long-term risks of excessive sugar consumption, coupled with regulatory pressures in markets like Europe and North America that are imposing stricter labeling and sugar taxes.
Health-Focused Beverages
The surge of the vegan and flexitarian movement further amplifies demand, as plant-based products increasingly reflect not just a dietary choice but a lifestyle identity. Brands that position their beverages as both performance-enhancing and environmentally conscious are capturing strong loyalty among millennials and Gen Z consumers, a demographic that values authenticity and functionality in their purchases.
Restraint
Premium Pricing
Despite rapid adoption, the market faces a significant restraint in the form of premium pricing and accessibility challenges. Plant-based formulations often rely on certified organic ingredients, sustainable sourcing, and innovative production methods, which elevate costs by 20–30% compared to mainstream energy drinks. While affluent urban consumers are willing to pay this premium, the higher price point limits penetration in price-sensitive regions, particularly in Latin America, Southeast Asia, and parts of Africa.
Limited Accessibility
Distribution gaps also constrain growth. Unlike traditional energy drinks that dominate supermarket shelves and convenience stores globally, plant-based alternatives are still concentrated in niche outlets, health-focused retailers, and online platforms. This restricted visibility reduces impulse purchases and slows mainstream adoption, leaving the category dependent on targeted marketing and premium positioning.
Opportunity
Sustainability-Driven Innovation
The greatest opportunity for 2025 lies in sustainability-driven innovation and expansion into emerging markets. As consumers increasingly prioritize environmental responsibility, brands adopting eco-friendly packaging, carbon-neutral supply chains, and ethically sourced ingredients are positioned to command premium pricing and long-term loyalty. Companies such as PepsiCo’s Rockstar Energy and newer entrants like Odyssey Elixir are experimenting with biodegradable packaging and mushroom-based formulations to align with this shift.
Emerging Market Expansion
At the same time, rising disposable incomes in Asia-Pacific and Latin America are opening new growth frontiers. Countries such as India, Brazil, and Mexico—where plant-based ingredients are already embedded in traditional diets—offer fertile ground for market expansion. By adapting flavors to local preferences and scaling distribution through supermarkets and e-commerce, companies can unlock double-digit annual growth in these high-potential regions.
Trend
Multifunctional Wellness Formulations
A defining trend shaping the 2025 landscape is the rise of multifunctional, wellness-oriented formulations. Consumers no longer view energy drinks as purely performance enhancers but as holistic health solutions. To meet this demand, brands are incorporating functional ingredients such as adaptogens (ashwagandha, reishi), nootropics for cognitive support, and probiotics for gut health. These hybrid beverages blur the line between energy drinks and functional wellness products, appealing to health-conscious professionals and athletes alike.
Digital-First Growth
Parallel to this, the e-commerce surge and digital-first marketing strategies are reshaping distribution dynamics. Online sales of plant-based energy drinks are growing at nearly 15–18% annually, fueled by subscription models, influencer partnerships, and social media campaigns that emphasize transparency and lifestyle alignment. This digital-driven ecosystem not only expands reach but also enables direct consumer engagement, reinforcing brand differentiation in an increasingly competitive marketplace.
Recent Developments
December 2024 – Oasis: Launched a natural energy drink positioned for sustained energy without “jitters,” targeting busy, health-minded consumers. Adds competitive pressure in the natural/plant-forward energy niche and underscores ongoing premiumization of the category.
January 2025 – Guayakí (Yerba Mate): Completed a shift to a predominantly third-party (DSD) distribution model across the U.S. and Canada to accelerate reach and merchandising execution. Frees up resources to focus on brand building and innovation while expanding door count and shelf velocity.
March 2025 – Guayakí (Yerba Mate): Announced its largest portfolio expansion to date, adding new flavors and formats rolling out nationwide to broaden use occasions. Deepens category leadership in plant-based, clean-label energy and strengthens retailer partnerships through incremental shelf space.
May 2025 – Guayakí rebrands as “Yerba Madre”: Introduced a new masterbrand and debuted a Regenerative Organic Certified® Gold loose-leaf line, with canned RTDs transitioning to the new identity through 2025. Elevates sustainability credentials and premium positioning, reinforcing differentiation versus conventional energy brands.
May 2025 – CLEAN Cause: Expanded convenience-channel distribution, launching USDA Organic yerba mate SKUs in more than 650 7-Eleven stores across Texas, California, and Oregon. Scales impulse-driven sales and brand awareness in a priority channel for functional energy.
June 2025 – Safety Shot / Yerbae Brands Corp.: Safety Shot completed the acquisition of Yerbae Brands, integrating a plant-based yerba mate portfolio with its wellness platform. Combines complementary retail networks and functional formulations to pursue faster multi-channel growth.