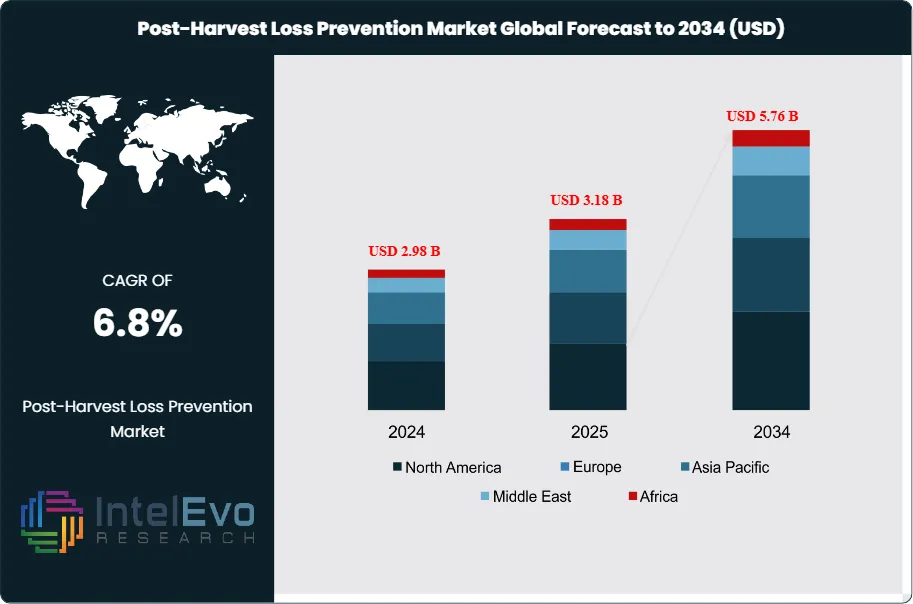
The Post-Harvest Loss Prevention Market was valued at USD 2.98 Billion in 2024 and is estimated to reach USD 3.18 Billion in 2025. The market is projected to grow to USD 5.76 Billion by 2034, expanding at a CAGR of 6.8% during the forecast period from 2026 to 2034. This represents an absolute dollar opportunity of USD 2.58 billion over the analysis period, driven by accelerating demand for shelf-life extension technologies, cold chain modernization, and bio-based treatment solutions across fruit, vegetable, and grain supply chains.
Food loss between harvest and retail constitutes a systemic crisis: the Food and Agriculture Organization of the United Nations (FAO) reports that approximately 13.2% of global food production is lost in the post-harvest supply chain before reaching retail, equivalent to 1.25 billion tonnes annually. Fruits and vegetables carry the steepest commodity-level loss rate, rising from 23.2% in 2015 to 25.4% in 2023 per FAO's SDG 12.3.1 Food Loss Index. These losses translate directly into demand for post-harvest treatment products covering edible coatings, ethylene blockers, bio-fungicides, controlled atmosphere storage (CAS), and smart monitoring platforms, because each incremental percentage point of loss reduction represents hundreds of millions of dollars in recovered agricultural value.
The regulatory environment reinforces commercial adoption. The European Union's Farm-to-Fork Strategy mandates a 50% reduction in pesticide use by 2030, pushing packers and distributors toward bio-based post-harvest solutions certified under EU Regulation (EC) No. 396/2005 on pesticide maximum residue levels (MRLs). In the United States, the USDA National Organic Program and EPA pesticide registration requirements set the framework for synthetic and biological treatment approvals. India's alignment of pesticide MRLs with Codex Alimentarius standards in 2024 expanded the addressable market for compliant treatment products across its 200 million-tonne annual fruit and vegetable output base.
Technology and innovation dynamics are bifurcating the market between legacy chemical treatments and a rapidly expanding biological and digital tier. Precision post-harvest management platforms such as AgroFresh Solutions' FreshCloud, which integrated AI-driven orchard analytics from Aerobotics and Neolithics in November 2025, illustrate how digital quality monitoring is converging with physical treatment regimes. Concurrently, JBT Marel Corporation's January 2025 USD 4.4 billion merger created the largest integrated food processing and fresh produce technology entity globally, signaling that scale and vertical integration define competitive advantage in equipment-intensive segments.
Asia Pacific held 38.5% of global post-harvest loss prevention market value in 2025, benefiting from China and India's combined annual fresh produce output exceeding 1.2 billion tonnes and increasing government investment in cold chain infrastructure. North America contributed approximately 26.2% of 2025 market revenue, anchored by stringent FDA food safety mandates and mature retail chains demanding verified shelf-life performance. Looking through to 2034, demand in sub-Saharan Africa and Southeast Asia presents the most underserved growth potential, as FAO data shows sub-Saharan Africa's post-harvest loss rate at 23.0%, the highest of any world region, against a backdrop of rising cold chain investment under African Union Agenda 2063 agricultural development programs.
Market Definition and Scope
The post-harvest loss prevention market is defined as the global commercial ecosystem of products, technologies, services, and infrastructure deployed between the point of crop harvest and the retail stage to minimize quantity and quality losses in food commodities. The market encompasses edible coatings, waxes, and surface treatments; chemical and bio-based fungicides; ethylene blockers and ripening inhibitors; sprout suppressants; controlled atmosphere and modified atmosphere packaging (MAP) storage systems; cold chain logistics and refrigeration equipment; sensor-based quality monitoring platforms; and digital supply chain management software.
This analysis covers fresh fruits, vegetables, cereals, grains, and pulses as primary crop categories. Included end-users span agricultural producers, packers and packhouses, cold storage operators, food processors, and retail distributors. Explicitly excluded are on-farm pre-harvest crop protection (herbicides, field-applied insecticides), consumer-stage food preservation products (household refrigerators, food storage containers), and processed food manufacturing. The post-harvest loss prevention sector represents a subset of the broader crop protection chemicals market, estimated at USD 67.18 billion in 2025, with the post-harvest segment capturing approximately 4.7% of parent market value based on aggregated company disclosures and trade flow analysis.
Key Takeaways
Market Growth: The global post-harvest loss prevention market reached USD 3.18 billion in 2025 and is projected to advance to USD 5.76 billion by 2034, expanding at a CAGR of 6.8% over the forecast period 2025-2034.
Segment Dominance (By Treatment Origin): Synthetic treatments commanded 57.9% of 2025 market value, driven by their proven efficacy in large-scale commercial packing operations and broad registration across major produce-importing markets.
Segment Dominance (By Application): The fruits and vegetables segment captured 46.7% of 2025 market revenue, reflecting the 25.4% post-harvest loss rate for fresh produce cited in FAO's 2023 Food Loss Index data, the highest loss rate of any commodity group.
Driver: Global food security pressure is the primary growth driver, with FAO estimating USD 400 billion in economic value lost annually at the post-harvest stage, creating quantifiable ROI for treatment adoption even among price-sensitive smallholder producers.
Restraint: Infrastructure deficits in sub-Saharan Africa and South Asia limit cold chain penetration; fewer than 4% of smallholder farmers in Kenya and Nigeria have access to affordable controlled-atmosphere storage, restricting addressable market expansion in high-loss geographies.
Opportunity: The bio-based post-harvest treatment segment represents a USD 890 million incremental revenue opportunity by 2034 as EU Farm-to-Fork pesticide reduction mandates and US National Organic Program approvals accelerate substitution of synthetic fungicides.
Trend: Digital post-harvest platforms integrating IoT sensors, AI quality inspection, and ethylene management data are gaining institutional adoption, with AgroFresh Solutions' FreshCloud ecosystem reaching integrations across six partner platforms by November 2025.
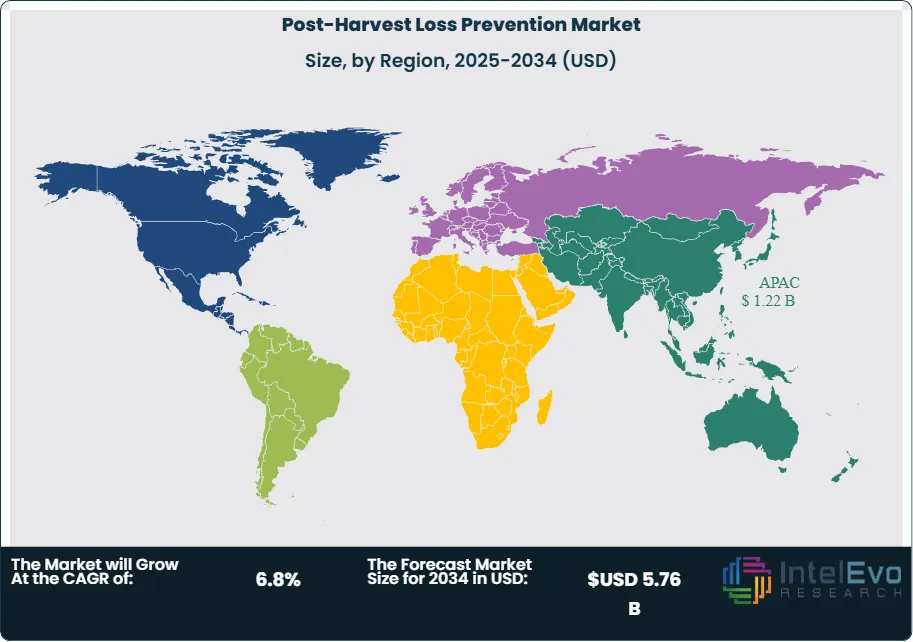
Regional: Asia Pacific led the post-harvest loss prevention market at 38.5% share, valued at approximately USD 1.22 billion in 2025, propelled by China and India's combined dominance of global horticultural output and expanding government-backed cold chain programs.
Key Insights Summary
Per FAO's SDG 12.3.1 Food Loss Index, global post-harvest losses for fruits and vegetables climbed from 23.2% in 2015 to 25.4% in 2023, marking a decade of no measurable systemic progress and confirming that commercial treatment adoption has not yet offset structural supply-chain deficiencies in high-loss regions.
OECD quantitative analysis published in 2025 calculates that meeting SDG Target 12.3 — halving post-harvest losses by 2030 — would reduce CO2-equivalent agricultural emissions by 4% and lift 137 million people out of hunger, providing governments with a carbon and food security co-benefit calculus that is reshaping public procurement and subsidy frameworks for treatment technologies.
In January 2025, JBT Marel Corporation came into being through the USD 4.4 billion combination of JBT Corporation and Marel hf., creating a global food processing technology entity with approximately 11,700 employees across 30-plus countries and 2025 combined revenue guidance of USD 3.65 to 3.73 billion.
During September 2025, DECCO Postharvest (a UPL subsidiary) added a ninth production site to its global network with the commissioning of a Beniparrell, Valencia, Spain facility, extending its capacity to serve citrus and tropical fruit packers across the European Union and North Africa.
FAO's Technical Platform on the Measurement and Reduction of Food Loss and Waste confirms that storage technology interventions targeting on-farm smallholders dominate 83% of peer-reviewed post-harvest loss reduction studies, yet intervention coverage remains concentrated in maize and rice crops, leaving high-value horticultural commodities underserved by evidence-based solutions.
AgroFresh Solutions integrated Aerobotics and Neolithics into its FreshCloud digital ecosystem in November 2025, extending AI-driven orchard analytics and optical packhouse inspection to a connected platform that now spans six partner data sources, positioning data-layer integration as a distinct competitive moat alongside physical treatment products.
Competitive Landscape Overview
The post-harvest loss prevention market exhibits moderate fragmentation at the global level, with the top four players — JBT Marel Corporation, AgroFresh Solutions, DECCO Postharvest, and BASF SE — collectively accounting for an estimated 42 to 48% of combined global treatment and equipment revenues, based on aggregated annual report disclosures and trade association data. The remaining market distributes across more than 50 regional and specialty players, creating distinct competitive tiers: broad-portfolio multinationals, equipment-focused integrators, and specialist biologicals providers.
Competition within the chemical treatment tier, where Syngenta Crop Protection AG and BASF SE compete against DECCO's coatings and fungicide lines, is shifting from active-ingredient efficacy to regulatory compliance positioning. EU MRL tightening under Regulation (EC) No. 396/2005 and the Farm-to-Fork Strategy's 2030 pesticide reduction target are compelling major players to build biological treatment portfolios — Syngenta received EU approval for an amoeba-derived bio-fungicide in June 2025, while BASF continued expanding its biological actives pipeline. The equipment and digital integration tier saw transformative consolidation in January 2025 when JBT and Marel hf. merged, shifting scale economics in cold-chain automation and produce handling technology.
New entrants in digital monitoring, including Hazel Technologies, Inc. and sensor-integrated platforms built on IoT and AI optical inspection, are compressing time-to-insight from weeks to hours, eroding the information advantage that vertically integrated packhouses historically held over independent growers. This digital disruption is the non-obvious structural shift in competitive dynamics: the vendor best positioned to own the data layer — not merely the treatment application — will capture superior recurring revenue as the market matures beyond 2028.
Competitive Landscape Matrix
Company Name
HQ
Market Position
Key Product
Geographic Strength
Recent Strategic Move
JBT Marel Corporation
USA/Iceland
Leader
ProDOSE wax dosing, cold-chain automation
Global
Closed USD 4.4B merger of JBT and Marel hf. in January 2025
AgroFresh Solutions
USA
Leader
SmartFresh 1-MCP, FreshCloud digital platform
North America, Europe, LATAM
Paired with Aerobotics and Neolithics for AI orchard-to-packhouse analytics (November 2025)
DECCO Postharvest (UPL)
USA/Spain
Leader
Edible coatings, fungicides, CATsystem automation
Europe, LATAM, MENA
Opened ninth production plant in Beniparrell, Valencia, Spain (October 2025)
BASF SE
Germany
Challenger
Fungicidal formulations, biological actives
Europe, North America
Advancing biological post-harvest pipeline under EU Farm-to-Fork sustainability mandates (2025)
Syngenta Crop Protection AG
Switzerland
Challenger
Post-harvest fungicides, ethylene management
Europe, Asia Pacific
EU approval granted for amoeba-derived bio-fungicide (June 2025)
Nufarm Limited
Australia
Niche Player
Liquid and granular post-harvest formulations
Asia Pacific, LATAM
Broadened Asia Pacific label registrations for bio-based treatments (2024)
Apeel Sciences
USA
Niche Player
Plant-derived edible coating (Edipeel, Sembla)
North America, Europe
Extended retail partnership reach into European grocery chains (2024)
Citrosol S.A.
Spain
Niche Player
CATsystem automated fungicide control
Europe, MENA
Commercialized CATsystem for precision fungicide dosing (June 2024)
By Treatment Type
Chemical treatments held the largest share of the post-harvest loss prevention market at 58.3% in 2025, generating approximately USD 1.85 billion in revenue. Fungicides and ethylene-management compounds anchor this segment, with fungicidal treatments protecting fruit and vegetable surfaces against Botrytis spp., Penicillium spp., and Colletotrichum spp. during storage and transit, while 1-methylcyclopropene (1-MCP) ethylene blockers extend pome fruit and tropical produce shelf life by 10 to 21 days in commercial packhouse trials documented in peer-reviewed sources. Key players including BASF SE, Syngenta Crop Protection AG, and DECCO Postharvest collectively support the chemical treatment segment through extensive registration portfolios across North America, the European Union, and Asia Pacific markets. Sprout inhibitors for potato storage, sanitizers for packhouse hygiene, and anti-browning agents for fresh-cut vegetables form sub-specialized chemical treatment niches with double-digit growth rates in the 2023-2025 period, driven by ready-to-eat produce category expansion.
Biological treatments occupied 22.6% of 2025 market revenue and represent the fastest-growing treatment segment, with industry analysis pointing to a CAGR exceeding 9.5% through 2034 as regulatory pressure accelerates synthetic-to-biological substitution. Bio-fungicide formulations deploying beneficial microorganisms such as Candida oleophila (commercialized by Agrauxine and distributed by DECCO under the Nexy brand) demonstrate comparable decay control efficacy to synthetic fungicides in citrus and pome fruit trials while meeting EU organic and zero-residue certification requirements. AgroFresh Solutions and Futureco Bioscience S.A. are further expanding biological portfolios targeting the growing consumer market for residue-free fresh produce, creating commercially distinct positioning versus legacy chemical lines. Physical treatments — including cold storage, controlled atmosphere, UV-C irradiation, and heat treatment — represented 19.1% of 2025 revenues and provided the upstream infrastructure that enables chemical and biological treatments to achieve their designed performance levels.
By Crop Type
Fruits and vegetables formed the largest application segment at 46.7% of 2025 market value. FAO's SDG 12.3.1 data confirms that fruits and vegetables experience the highest post-harvest loss rate of any commodity group — 25.4% in 2023 — because their high moisture content, active respiration, and ethylene sensitivity compress the commercial window between harvest and unmarketability. Tropical fruits including avocados, mangoes, and bananas represent the highest-growth sub-segment within this category, as expanding long-distance trade routes connecting South American and Southeast Asian production regions to European and North American retail markets demand multi-week shelf-life extension. JBT Marel's ProDOSE Pineapple wax dosing system, recognized as Freshness Control Solution of the Year at the 2025 AgTech Breakthrough Awards, addresses precision wax application specifically for pineapple, illustrating how crop-specific hardware innovation is displacing generic coating equipment in premium segments.
Cereals and grains accounted for 32.5% of 2025 market value, representing the largest volume segment by tonnage. Grain protectant chemicals — including organophosphates, pyrethroids, and phosphine fumigants regulated by EPA under FIFRA in the United States and by EFSA under EU harmonized standards — protect stored wheat, maize, rice, and sorghum against insect infestation and mold growth. Research published in Foods (MDPI, June 2024) confirms that achieving the correct moisture content threshold at harvest — 25% maximum for rice and approximately 14% for wheat — is the single most effective preventive lever, but where infrastructure and farmer knowledge gaps persist in sub-Saharan Africa and South Asia, chemical grain protectants remain the primary loss-reduction tool. Oilseeds, pulses, and specialty crops constituted the remaining 20.8% of 2025 application revenue, supported by niche herbicide-desiccant and anti-aflatoxin treatment formulations.
By Product Form
Liquid formulations, including emulsifiable concentrates, suspensions, and solution concentrates, dominated post-harvest treatment product forms at 54.3% of 2025 market revenue, because liquid application integrates directly into packhouse drenching, dipping, and foam systems without additional equipment capital expenditure. Coatings and wax formulations captured 31.2% of 2025 revenues and are growing at the highest rate within the product form segment, fueled by consumer preference for visually appealing fresh produce and retailer mandates for extended shelf life to reduce shrinkage losses. Apeel Sciences' plant-derived edible coating (Edipeel) and AgroFresh Solutions' VitaFresh Botanicals range demonstrate the commercial scale achievable in plant-based coating niches, with both platforms operating under EU Regulation (EU) 2018/848 organic production compatibility. Granular and powder formulations accounted for the remaining 14.5%, serving primarily grain fumigation and sprout inhibitor applications where slow-release chemistry or fumigant gas generation (phosphine-generating aluminum phosphide pellets) is technically required.
By End-User
Commercial packhouses and grower-shipper enterprises comprised the dominant end-user category at an estimated 51.4% of 2025 market spending, because centralized packing operations provide the economies of scale and technical expertise needed to implement multi-step treatment protocols from pre-cooling through storage, coating application, and quality inspection. Cold storage operators and third-party logistics providers contributed approximately 24.8%, as the controlled atmosphere and refrigeration equipment segment attracts capital expenditure from both new cold chain construction in emerging markets and technology upgrade cycles in established facilities. Food processors using post-harvest treatments for fresh-cut and minimally processed produce accounted for roughly 14.2%, while agricultural producers applying on-farm treatments — including hermetic grain storage bags marketed by GrainPro Inc. to smallholder maize farmers in Africa — constituted the remaining 9.6%.
Regional Analysis
Asia Pacific led the global post-harvest loss prevention market at 38.5% share, valued at approximately USD 1.22 billion in 2025. China, India, Thailand, and Vietnam anchor regional demand as the world's largest producers of fruits, vegetables, and grains; China alone accounts for approximately 27% of global vegetable output per FAO 2024 statistics. Regional policy tailwinds include India's Pradhan Mantri Kisan SAMPADA Yojana, which allocated INR 4,600 crore to post-harvest management and cold chain infrastructure between 2017 and 2025, and China's 14th Five-Year Plan commitments to reduce food waste by 8 to 10% by 2025. Companies including Pioneer Agrobiz Co., Ltd. and domestic Chinese agri-tech platforms are accelerating adoption of ethylene management and cold chain sensors tailored to local crop types and distribution networks.
North America held 26.2% of 2025 global market revenue, equivalent to approximately USD 833 million. The United States is the regional anchor, where FDA regulations under 21 CFR Part 110 (Current Good Manufacturing Practice) and the Food Safety Modernization Act (FSMA) create mandatory compliance drivers for post-harvest hygiene and treatment documentation across the fresh produce supply chain. AgroFresh Solutions and JBT Marel, both headquartered in the United States, command leading positions across the ethylene management and produce handling equipment segments. Canada contributed an estimated 5.8% of North American market value, with provincial grain grower groups committing USD 13.4 million to Cereals Canada's GATE initiative for advanced grain treatment research, a development confirmed by industry reports through Q3 2025.
Europe contributed approximately 21.3% of 2025 global market value, around USD 677 million, with Germany, Spain, the Netherlands, and France as the primary demand centers. EU pesticide regulations under Regulation (EC) No. 396/2005 and the EU Farm-to-Fork Strategy create the most demanding compliance environment globally, making Europe the lead market for bio-based and low-residue post-harvest treatments. DECCO Ibérica's September 2025 opening of its Beniparrell, Valencia facility and Citrosol's June 2024 CATsystem launch for automated fungicide dosing reflect Europe's role as a primary innovation hub for regulatory-compliant treatment technology. The Netherlands' position as the world's second-largest food exporter per WTO trade data reinforces European packhouse demand for advanced coating and sorting infrastructure.
Latin America accounted for 9.2% of 2025 revenues, approximately USD 292 million, centered on Brazil, Chile, Mexico, and Peru as the region's major fruit and vegetable exporters. Brazilian producers of avocados, mangoes, and citrus increasingly adopt AgroFresh's SmartFresh and VitaFresh Botanicals platforms for long-haul shipments to European retailers, who impose strict MRL compliance documentation. Chile's table grape and cherry export sector, generating over USD 4 billion annually in export value per USDA GATS data, depends on controlled atmosphere storage and ethylene inhibition technologies to manage the 14 to 21-day transit window to Asian markets.
Middle East and Africa represented 4.8% of 2025 market value, approximately USD 153 million, but carries the highest structural growth potential of any region. FAO data documents sub-Saharan Africa's post-harvest loss rate at 23.0%, the highest globally, driven by deficient cold chain infrastructure, poor road networks, and limited access to certified treatment products. Shell Foundation's July 2025 market landscaping research on post-harvest loss solutions for smallholder farmers in Kenya, Nigeria, and India identified moisture management as the primary loss driver, with solutions including solar dryers, hermetic storage, and humidity-controlled storage systems representing the highest-value intervention categories for the USD 5 billion-plus sub-Saharan produce sector.
Country Analysis
The United States post-harvest loss prevention market generated an estimated USD 780 million in 2025, representing the single largest national market globally, advancing at a country CAGR of approximately 5.7% through 2034. Federal food safety architecture under FSMA's Produce Safety Rule (21 CFR Part 112) mandates post-harvest sanitation, water quality testing, and traceability across commercial fresh produce operations, creating a compliance-driven floor for treatment product consumption. The USDA Agricultural Marketing Service (AMS) administers National Organic Program certification that determines the commercial viability of bio-based coating and treatment products in the USD 62 billion US organic food market. California alone accounts for approximately 38% of US fresh fruit and vegetable output, concentrating packhouse treatment demand in the San Joaquin Valley and Salinas Valley. JBT Marel and AgroFresh Solutions, both with primary operations and R&D infrastructure in the United States, channel the majority of their new product development investment into US regulatory certification as the de facto global launch market.
China's post-harvest loss prevention market reached an estimated USD 410 million in 2025, growing at a country CAGR of approximately 9.4%, reflecting both the scale of China's agricultural sector — the world's largest by output value — and the pace of cold chain infrastructure investment under the 14th Five-Year Plan. The Ministry of Agriculture and Rural Affairs (MARA) issued post-harvest technology adoption guidelines targeting a 5 percentage-point reduction in fruit and vegetable loss rates by 2025 compared to 2015 baseline levels. Domestic technology providers and international players including BASF and Syngenta compete for market position in China's grain storage treatment segment, where phosphine fumigation under hermetic silo conditions remains the dominant loss prevention method for the approximately 620 million tonnes of grain stored annually in state-managed reserves.
India's post-harvest loss prevention market was valued at approximately USD 290 million in 2025, with a country CAGR of approximately 5.5% through 2034 supported by government-led infrastructure investment and growing horticultural export ambitions. SAMPADA Yojana and the Agricultural Infrastructure Fund (AIF), which disbursed INR 10,000 crore in cold chain and agri-logistics financing between 2020 and 2025, are the primary public catalysts for market expansion. Tropical Agrosystem (India) Pvt. Ltd.'s July 2025 partnership with AgroFresh Inc. to distribute SmartFresh InBox across India demonstrates how international post-harvest technology is entering the Indian market through established crop protection distribution channels, bypassing infrastructure requirements by delivering 1-MCP sachets for in-transit ethylene management without dependence on fixed controlled atmosphere storage.
Brazil's post-harvest loss prevention market generated approximately USD 195 million in 2025, growing at a country CAGR of approximately 7.1%. Brazil is the world's third-largest fruit producer per FAO 2024 data, exporting more than USD 1.5 billion in fresh and processed fruit annually, with oranges, mangoes, grapes, and avocados as the key commodities requiring post-harvest treatment. Embrapa Instrumentation (the Brazilian Agricultural Research Corporation), which co-developed the nano-emulsion technology underlying AgroFresh's VitaFresh Botanicals Life Ultra coating, illustrates how domestic research institutions contribute to commercially deployable treatment innovation in the Brazilian market. MAPA (Brazil's Ministry of Agriculture, Livestock and Food Supply) oversees pesticide and coating product registration, with bio-based treatments gaining an accelerated regulatory pathway under Brazil's Biorational Pesticide Program established in 2020.
By Treatment Type, (Chemical Treatment, Biological Treatment, Physical Treatment, Thermal Treatment, Storage & Packaging Solutions, Others), By Crop Type, (Fruits & Vegetables, Cereals & Grains, Pulses & Legumes, Oilseeds, Spices, Others), By Product Form, (Liquid, Powder, Granules, Films & Packaging Materials, Others), By End-User, (Farmers & Agricultural Producers, Food Processing Companies, Storage & Warehouse Operators, Retailers & Distributors, Government & Research Institutions, Others),
Research Methodology
Primary Research- 100 Interviews of Stakeholders
Secondary Research
Desk Research
Regional scope
North America (United States, Canada, Mexico)
Latin America (Brazil, Argentina, Columbia)
East Asia And Pacific (China, Japan, South Korea, Australia, Cambodia, Fiji, Indonesia)
Sea And South Asia (India, Singapore, Thailand, Taiwan, Malaysia)
Eastern Europe (Poland, Russia, Czech Republic, Romania)
Western Europe (Germany, U.K., France, Spain, Itlay)
Middle East & Africa (GCC Countries, Egypt, Nigeria, South Africa, Israel)
Competitive Landscape
JBT MAREL CORPORATION, AGROFRESH SOLUTIONS, INC., DECCO POSTHARVEST (UPL LTD.), BASF SE, SYNGENTA CROP PROTECTION AG, NUFARM LIMITED, APEEL SCIENCES, CITROSOL S.A., PACE INTERNATIONAL LLC, HAZEL TECHNOLOGIES, INC., XEDA INTERNATIONAL S.A.S., FOMESA FRUITECH S.L., FUTURECO BIOSCIENCE S.A., BAYER AG, FMC CORPORATION, LINEAGE, INC., AMERICOLD REALTY TRUST, SEALED AIR CORPORATION, Others
Customization Scope
Customization for segments, region/country-level will be provided. Moreover, additional customization can be done based on the requirements.
Pricing and Purchase Options
Avail customized purchase options to meet your exact research needs. We have three licenses to opt for: Single User License, Multi-User License (Up to 5 Users), Corporate Use License (Unlimited User and Printable PDF).
TABLE OF CONTENTS
1. EXECUTIVE SUMMARY
1.1. MARKET SNAPSHOT
1.2. KEY FINDINGS & INSIGHTS
1.3. ANALYST RECOMMENDATIONS
1.4. FUTURE OUTLOOK
2. RESEARCH METHODOLOGY
2.1. MARKET DEFINITION & SCOPE
2.2. RESEARCH OBJECTIVES: PRIMARY & SECONDARY DATA SOURCES
2.3. DATA COLLECTION SOURCES
2.3.1. COVERAGE OF 100+ PRIMARY RESEARCH/CONSULTATION CALLS WITH INDUSTRY STAKEHOLDERS
FIGURE 17 NORTH AMERICA POST-HARVEST LOSS PREVENTION MARKET CURRENT AND FUTURE TYPE ANALYSIS, 2025–2034, (USD MILLION)
FIGURE 18 NORTH AMERICA POST-HARVEST LOSS PREVENTION MARKET CURRENT AND FUTURE END USER ANALYSIS, 2025–2034, (USD MILLION)
FIGURE 19 MARKET SHARE BY COUNTRY
FIGURE 20 LATIN AMERICA POST-HARVEST LOSS PREVENTION MARKET CURRENT AND FUTURE TYPE ANALYSIS, 2025–2034, (USD MILLION)
FIGURE 21 LATIN AMERICA POST-HARVEST LOSS PREVENTION MARKET CURRENT AND FUTURE END USER ANALYSIS, 2025–2034, (USD MILLION)
FIGURE 22 MARKET SHARE BY COUNTRY
FIGURE 23 EASTERN EUROPE POST-HARVEST LOSS PREVENTION MARKET CURRENT AND FUTURE TYPE ANALYSIS, 2025–2034, (USD MILLION)
FIGURE 24 EASTERN EUROPE POST-HARVEST LOSS PREVENTION MARKET CURRENT AND FUTURE END USER ANALYSIS, 2025–2034, (USD MILLION)
FIGURE 25 MARKET SHARE BY COUNTRY
FIGURE 26 WESTERN EUROPE POST-HARVEST LOSS PREVENTION MARKET CURRENT AND FUTURE TYPE ANALYSIS, 2025–2034, (USD MILLION)
FIGURE 27 WESTERN EUROPE POST-HARVEST LOSS PREVENTION MARKET CURRENT AND FUTURE END USER ANALYSIS, 2025–2034, (USD MILLION)
FIGURE 28 MARKET SHARE BY COUNTRY
FIGURE 29 EAST ASIA AND PACIFIC POST-HARVEST LOSS PREVENTION MARKET CURRENT AND FUTURE TYPE ANALYSIS, 2025–2034, (USD MILLION)
FIGURE 30 EAST ASIA AND PACIFIC POST-HARVEST LOSS PREVENTION MARKET CURRENT AND FUTURE END USER ANALYSIS, 2025–2034, (USD MILLION)
FIGURE 31 MARKET SHARE BY COUNTRY
FIGURE 32 SEA AND SOUTH ASIA POST-HARVEST LOSS PREVENTION MARKET CURRENT AND FUTURE TYPE ANALYSIS, 2025–2034, (USD MILLION)
FIGURE 33 SEA AND SOUTH ASIA POST-HARVEST LOSS PREVENTION MARKET CURRENT AND FUTURE END USER ANALYSIS, 2025–2034, (USD MILLION)
FIGURE 34 MARKET SHARE BY COUNTRY
FIGURE 35 MIDDLE EAST AND AFRICA POST-HARVEST LOSS PREVENTION MARKET CURRENT AND FUTURE TYPE ANALYSIS, 2025–2034, (USD MILLION)
FIGURE 36 MIDDLE EAST AND AFRICA POST-HARVEST LOSS PREVENTION MARKET CURRENT AND FUTURE END USER ANALYSIS, 2025–2034, (USD MILLION)
FIGURE 37 NORTH AMERICA POST-HARVEST LOSS PREVENTION MARKET CURRENT AND FUTURE MARKET VOLUME SHARE REGIONAL ANALYSIS, 2025–2034, (USD MILLION)
FIGURE 38 U.S. POST-HARVEST LOSS PREVENTION MARKET CURRENT AND FUTURE TYPE ANALYSIS, 2025–2034, (USD MILLION)
FIGURE 39 U.S. POST-HARVEST LOSS PREVENTION MARKET CURRENT AND FUTURE END USER ANALYSIS, 2025–2034, (USD MILLION)
FIGURE 40 CANADA POST-HARVEST LOSS PREVENTION MARKET CURRENT AND FUTURE TYPE ANALYSIS, 2025–2034, (USD MILLION)
FIGURE 41 CANADA POST-HARVEST LOSS PREVENTION MARKET CURRENT AND FUTURE END USER ANALYSIS, 2025–2034, (USD MILLION)
FIGURE 42 LATIN AMERICA POST-HARVEST LOSS PREVENTION MARKET CURRENT AND FUTURE MARKET VOLUME SHARE REGIONAL ANALYSIS, 2025–2034, (USD MILLION)
FIGURE 43 MEXICO POST-HARVEST LOSS PREVENTION MARKET CURRENT AND FUTURE TYPE ANALYSIS, 2025–2034, (USD MILLION)
FIGURE 44 MEXICO POST-HARVEST LOSS PREVENTION MARKET CURRENT AND FUTURE END USER ANALYSIS, 2025–2034, (USD MILLION)
FIGURE 45 BRAZIL POST-HARVEST LOSS PREVENTION MARKET CURRENT AND FUTURE TYPE ANALYSIS, 2025–2034, (USD MILLION)
FIGURE 46 BRAZIL POST-HARVEST LOSS PREVENTION MARKET CURRENT AND FUTURE END USER ANALYSIS, 2025–2034, (USD MILLION)
FIGURE 47 ARGENTINA POST-HARVEST LOSS PREVENTION MARKET CURRENT AND FUTURE TYPE ANALYSIS, 2025–2034, (USD MILLION)
FIGURE 48 ARGENTINA POST-HARVEST LOSS PREVENTION MARKET CURRENT AND FUTURE END USER ANALYSIS, 2025–2034, (USD MILLION)
FIGURE 49 COLUMBIA POST-HARVEST LOSS PREVENTION MARKET CURRENT AND FUTURE TYPE ANALYSIS, 2025–2034, (USD MILLION)
FIGURE 50 COLUMBIA POST-HARVEST LOSS PREVENTION MARKET CURRENT AND FUTURE END USER ANALYSIS, 2025–2034, (USD MILLION)
FIGURE 51 REST OF LATIN AMERICA POST-HARVEST LOSS PREVENTION MARKET CURRENT AND FUTURE TYPE ANALYSIS, 2025–2034, (USD MILLION)
FIGURE 52 REST OF LATIN AMERICA POST-HARVEST LOSS PREVENTION MARKET CURRENT AND FUTURE END USER ANALYSIS, 2025–2034, (USD MILLION)
FIGURE 53 EASTERN EUROPE POST-HARVEST LOSS PREVENTION MARKET CURRENT AND FUTURE MARKET VOLUME SHARE REGIONAL ANALYSIS, 2025–2034, (USD MILLION)
FIGURE 54 POLAND POST-HARVEST LOSS PREVENTION MARKET CURRENT AND FUTURE TYPE ANALYSIS, 2025–2034, (USD MILLION)
FIGURE 55 POLAND POST-HARVEST LOSS PREVENTION MARKET CURRENT AND FUTURE END USER ANALYSIS, 2025–2034, (USD MILLION)
FIGURE 56 RUSSIA POST-HARVEST LOSS PREVENTION MARKET CURRENT AND FUTURE TYPE ANALYSIS, 2025–2034, (USD MILLION)
FIGURE 57 RUSSIA POST-HARVEST LOSS PREVENTION MARKET CURRENT AND FUTURE END USER ANALYSIS, 2025–2034, (USD MILLION)
FIGURE 58 CZECH REPUBLIC POST-HARVEST LOSS PREVENTION MARKET CURRENT AND FUTURE TYPE ANALYSIS, 2025–2034, (USD MILLION)
FIGURE 59 CZECH REPUBLIC POST-HARVEST LOSS PREVENTION MARKET CURRENT AND FUTURE END USER ANALYSIS, 2025–2034, (USD MILLION)
FIGURE 60 ROMANIA POST-HARVEST LOSS PREVENTION MARKET CURRENT AND FUTURE TYPE ANALYSIS, 2025–2034, (USD MILLION)
FIGURE 61 ROMANIA POST-HARVEST LOSS PREVENTION MARKET CURRENT AND FUTURE END USER ANALYSIS, 2025–2034, (USD MILLION)
FIGURE 62 REST OF EASTERN EUROPE POST-HARVEST LOSS PREVENTION MARKET CURRENT AND FUTURE TYPE ANALYSIS, 2025–2034, (USD MILLION)
FIGURE 63 REST OF EASTERN EUROPE POST-HARVEST LOSS PREVENTION MARKET CURRENT AND FUTURE END USER ANALYSIS, 2025–2034, (USD MILLION)
FIGURE 64 WESTERN EUROPE POST-HARVEST LOSS PREVENTION MARKET CURRENT AND FUTURE MARKET VOLUME SHARE REGIONAL ANALYSIS, 2025–2034, (USD MILLION)
FIGURE 65 GERMANY POST-HARVEST LOSS PREVENTION MARKET CURRENT AND FUTURE TYPE ANALYSIS, 2025–2034, (USD MILLION)
FIGURE 66 GERMANY POST-HARVEST LOSS PREVENTION MARKET CURRENT AND FUTURE END USER ANALYSIS, 2025–2034, (USD MILLION)
FIGURE 67 FRANCE POST-HARVEST LOSS PREVENTION MARKET CURRENT AND FUTURE TYPE ANALYSIS, 2025–2034, (USD MILLION)
FIGURE 68 FRANCE POST-HARVEST LOSS PREVENTION MARKET CURRENT AND FUTURE END USER ANALYSIS, 2025–2034, (USD MILLION)
FIGURE 69 UK POST-HARVEST LOSS PREVENTION MARKET CURRENT AND FUTURE TYPE ANALYSIS, 2025–2034, (USD MILLION)
FIGURE 70 UK POST-HARVEST LOSS PREVENTION MARKET CURRENT AND FUTURE END USER ANALYSIS, 2025–2034, (USD MILLION)
FIGURE 71 SPAIN POST-HARVEST LOSS PREVENTION MARKET CURRENT AND FUTURE TYPE ANALYSIS, 2025–2034, (USD MILLION)
FIGURE 72 SPAIN POST-HARVEST LOSS PREVENTION MARKET CURRENT AND FUTURE END USER ANALYSIS, 2025–2034, (USD MILLION)
FIGURE 73 ITALY POST-HARVEST LOSS PREVENTION MARKET CURRENT AND FUTURE TYPE ANALYSIS, 2025–2034, (USD MILLION)
FIGURE 74 ITALY POST-HARVEST LOSS PREVENTION MARKET CURRENT AND FUTURE END USER ANALYSIS, 2025–2034, (USD MILLION)
FIGURE 75 REST OF WESTERN EUROPE POST-HARVEST LOSS PREVENTION MARKET CURRENT AND FUTURE TYPE ANALYSIS, 2025–2034, (USD MILLION)
FIGURE 76 REST OF WESTERN EUROPE POST-HARVEST LOSS PREVENTION MARKET CURRENT AND FUTURE END USER ANALYSIS, 2025–2034, (USD MILLION)
FIGURE 77 EAST ASIA AND PACIFIC POST-HARVEST LOSS PREVENTION MARKET CURRENT AND FUTURE MARKET VOLUME SHARE REGIONAL ANALYSIS, 2025–2034, (USD MILLION)
FIGURE 78 CHINA POST-HARVEST LOSS PREVENTION MARKET CURRENT AND FUTURE TYPE ANALYSIS, 2025–2034, (USD MILLION)
FIGURE 79 CHINA POST-HARVEST LOSS PREVENTION MARKET CURRENT AND FUTURE END USER ANALYSIS, 2025–2034, (USD MILLION)
FIGURE 80 JAPAN POST-HARVEST LOSS PREVENTION MARKET CURRENT AND FUTURE TYPE ANALYSIS, 2025–2034, (USD MILLION)
FIGURE 81 JAPAN POST-HARVEST LOSS PREVENTION MARKET CURRENT AND FUTURE END USER ANALYSIS, 2025–2034, (USD MILLION)
FIGURE 82 AUSTRALIA POST-HARVEST LOSS PREVENTION MARKET CURRENT AND FUTURE TYPE ANALYSIS, 2025–2034, (USD MILLION)
FIGURE 83 AUSTRALIA POST-HARVEST LOSS PREVENTION MARKET CURRENT AND FUTURE END USER ANALYSIS, 2025–2034, (USD MILLION)
FIGURE 84 CAMBODIA POST-HARVEST LOSS PREVENTION MARKET CURRENT AND FUTURE TYPE ANALYSIS, 2025–2034, (USD MILLION)
FIGURE 85 CAMBODIA POST-HARVEST LOSS PREVENTION MARKET CURRENT AND FUTURE END USER ANALYSIS, 2025–2034, (USD MILLION)
FIGURE 86 FIJI POST-HARVEST LOSS PREVENTION MARKET CURRENT AND FUTURE TYPE ANALYSIS, 2025–2034, (USD MILLION)
FIGURE 87 FIJI POST-HARVEST LOSS PREVENTION MARKET CURRENT AND FUTURE END USER ANALYSIS, 2025–2034, (USD MILLION)
FIGURE 88 INDONESIA POST-HARVEST LOSS PREVENTION MARKET CURRENT AND FUTURE TYPE ANALYSIS, 2025–2034, (USD MILLION)
FIGURE 89 INDONESIA POST-HARVEST LOSS PREVENTION MARKET CURRENT AND FUTURE END USER ANALYSIS, 2025–2034, (USD MILLION)
FIGURE 90 SOUTH KOREA POST-HARVEST LOSS PREVENTION MARKET CURRENT AND FUTURE TYPE ANALYSIS, 2025–2034, (USD MILLION)
FIGURE 91 SOUTH KOREA POST-HARVEST LOSS PREVENTION MARKET CURRENT AND FUTURE END USER ANALYSIS, 2025–2034, (USD MILLION)
FIGURE 92 REST OF EAST ASIA AND PACIFIC POST-HARVEST LOSS PREVENTION MARKET CURRENT AND FUTURE TYPE ANALYSIS, 2025–2034, (USD MILLION)
FIGURE 93 REST OF EAST ASIA AND PACIFIC POST-HARVEST LOSS PREVENTION MARKET CURRENT AND FUTURE END USER ANALYSIS, 2025–2034, (USD MILLION)
FIGURE 94 SEA AND SOUTH ASIA POST-HARVEST LOSS PREVENTION MARKET CURRENT AND FUTURE MARKET VOLUME SHARE REGIONAL ANALYSIS, 2025–2034, (USD MILLION)
FIGURE 95 BANGLADESH POST-HARVEST LOSS PREVENTION MARKET CURRENT AND FUTURE TYPE ANALYSIS, 2025–2034, (USD MILLION)
FIGURE 96 BANGLADESH POST-HARVEST LOSS PREVENTION MARKET CURRENT AND FUTURE END USER ANALYSIS, 2025–2034, (USD MILLION)
FIGURE 97 NEW ZEALAND POST-HARVEST LOSS PREVENTION MARKET CURRENT AND FUTURE TYPE ANALYSIS, 2025–2034, (USD MILLION)
FIGURE 98 NEW ZEALAND POST-HARVEST LOSS PREVENTION MARKET CURRENT AND FUTURE END USER ANALYSIS, 2025–2034, (USD MILLION)
FIGURE 99 INDIA POST-HARVEST LOSS PREVENTION MARKET CURRENT AND FUTURE TYPE ANALYSIS, 2025–2034, (USD MILLION)
FIGURE 100 INDIA POST-HARVEST LOSS PREVENTION MARKET CURRENT AND FUTURE END USER ANALYSIS, 2025–2034, (USD MILLION)
FIGURE 101 SINGAPORE POST-HARVEST LOSS PREVENTION MARKET CURRENT AND FUTURE TYPE ANALYSIS, 2025–2034, (USD MILLION)
FIGURE 102 SINGAPORE POST-HARVEST LOSS PREVENTION MARKET CURRENT AND FUTURE END USER ANALYSIS, 2025–2034, (USD MILLION)
FIGURE 103 THAILAND POST-HARVEST LOSS PREVENTION MARKET CURRENT AND FUTURE TYPE ANALYSIS, 2025–2034, (USD MILLION)
FIGURE 104 THAILAND POST-HARVEST LOSS PREVENTION MARKET CURRENT AND FUTURE END USER ANALYSIS, 2025–2034, (USD MILLION)
FIGURE 105 TAIWAN POST-HARVEST LOSS PREVENTION MARKET CURRENT AND FUTURE TYPE ANALYSIS, 2025–2034, (USD MILLION)
FIGURE 106 TAIWAN POST-HARVEST LOSS PREVENTION MARKET CURRENT AND FUTURE END USER ANALYSIS, 2025–2034, (USD MILLION)
FIGURE 107 MALAYSIA POST-HARVEST LOSS PREVENTION MARKET CURRENT AND FUTURE TYPE ANALYSIS, 2025–2034, (USD MILLION)
FIGURE 108 MALAYSIA POST-HARVEST LOSS PREVENTION MARKET CURRENT AND FUTURE END USER ANALYSIS, 2025–2034, (USD MILLION)
FIGURE 109 REST OF SEA AND SOUTH ASIA POST-HARVEST LOSS PREVENTION MARKET CURRENT AND FUTURE TYPE ANALYSIS, 2025–2034, (USD MILLION)
FIGURE 110 REST OF SEA AND SOUTH ASIA POST-HARVEST LOSS PREVENTION MARKET CURRENT AND FUTURE END USER ANALYSIS, 2025–2034, (USD MILLION)
FIGURE 111 MIDDLE EAST AND AFRICA POST-HARVEST LOSS PREVENTION MARKET CURRENT AND FUTURE MARKET VOLUME SHARE REGIONAL ANALYSIS, 2025–2034, (USD MILLION)
FIGURE 112 GCC COUNTRIES POST-HARVEST LOSS PREVENTION MARKET CURRENT AND FUTURE TYPE ANALYSIS, 2025–2034, (USD MILLION)
FIGURE 113 GCC COUNTRIES POST-HARVEST LOSS PREVENTION MARKET CURRENT AND FUTURE END USER ANALYSIS, 2025–2034, (USD MILLION)
FIGURE 114 SAUDI ARABIA POST-HARVEST LOSS PREVENTION MARKET CURRENT AND FUTURE TYPE ANALYSIS, 2025–2034, (USD MILLION)
FIGURE 115 SAUDI ARABIA POST-HARVEST LOSS PREVENTION MARKET CURRENT AND FUTURE END USER ANALYSIS, 2025–2034, (USD MILLION)
FIGURE 116 UAE POST-HARVEST LOSS PREVENTION MARKET CURRENT AND FUTURE TYPE ANALYSIS, 2025–2034, (USD MILLION)
FIGURE 117 UAE POST-HARVEST LOSS PREVENTION MARKET CURRENT AND FUTURE END USER ANALYSIS, 2025–2034, (USD MILLION)
FIGURE 118 BAHRAIN POST-HARVEST LOSS PREVENTION MARKET CURRENT AND FUTURE TYPE ANALYSIS, 2025–2034, (USD MILLION)
FIGURE 119 BAHRAIN POST-HARVEST LOSS PREVENTION MARKET CURRENT AND FUTURE END USER ANALYSIS, 2025–2034, (USD MILLION)
FIGURE 120 KUWAIT POST-HARVEST LOSS PREVENTION MARKET CURRENT AND FUTURE TYPE ANALYSIS, 2025–2034, (USD MILLION)
FIGURE 121 KUWAIT POST-HARVEST LOSS PREVENTION MARKET CURRENT AND FUTURE END USER ANALYSIS, 2025–2034, (USD MILLION)
FIGURE 122 OMAN POST-HARVEST LOSS PREVENTION MARKET CURRENT AND FUTURE TYPE ANALYSIS, 2025–2034, (USD MILLION)
FIGURE 123 OMAN POST-HARVEST LOSS PREVENTION MARKET CURRENT AND FUTURE END USER ANALYSIS, 2025–2034, (USD MILLION)
FIGURE 124 QATAR POST-HARVEST LOSS PREVENTION MARKET CURRENT AND FUTURE TYPE ANALYSIS, 2025–2034, (USD MILLION)
FIGURE 125 QATAR POST-HARVEST LOSS PREVENTION MARKET CURRENT AND FUTURE END USER ANALYSIS, 2025–2034, (USD MILLION)
FIGURE 126 EGYPT POST-HARVEST LOSS PREVENTION MARKET CURRENT AND FUTURE TYPE ANALYSIS, 2025–2034, (USD MILLION)
FIGURE 127 EGYPT POST-HARVEST LOSS PREVENTION MARKET CURRENT AND FUTURE END USER ANALYSIS, 2025–2034, (USD MILLION)
FIGURE 128 NIGERIA POST-HARVEST LOSS PREVENTION MARKET CURRENT AND FUTURE TYPE ANALYSIS, 2025–2034, (USD MILLION)
FIGURE 129 NIGERIA POST-HARVEST LOSS PREVENTION MARKET CURRENT AND FUTURE END USER ANALYSIS, 2025–2034, (USD MILLION)
FIGURE 130 SOUTH AFRICA POST-HARVEST LOSS PREVENTION MARKET CURRENT AND FUTURE TYPE ANALYSIS, 2025–2034, (USD MILLION)
FIGURE 131 SOUTH AFRICA POST-HARVEST LOSS PREVENTION MARKET CURRENT AND FUTURE END USER ANALYSIS, 2025–2034, (USD MILLION)
FIGURE 132 ISRAEL POST-HARVEST LOSS PREVENTION MARKET CURRENT AND FUTURE TYPE ANALYSIS, 2025–2034, (USD MILLION)
FIGURE 133 ISRAEL POST-HARVEST LOSS PREVENTION MARKET CURRENT AND FUTURE END USER ANALYSIS, 2025–2034, (USD MILLION)
FIGURE 134 REST OF MEA POST-HARVEST LOSS PREVENTION MARKET CURRENT AND FUTURE TYPE ANALYSIS, 2025–2034, (USD MILLION)
FIGURE 135 REST OF MEA POST-HARVEST LOSS PREVENTION MARKET CURRENT AND FUTURE END USER ANALYSIS, 2025–2034, (USD MILLION)
FIGURE 136 U. S. MARKET SHARE ANALYSIS BY TYPE (2025)
FIGURE 137 U. S. MARKET SHARE ANALYSIS BY END USER (2025)
FIGURE 138 CANADA MARKET SHARE ANALYSIS BY TYPE (2025)
FIGURE 139 CANADA MARKET SHARE ANALYSIS BY END USER (2025)
FIGURE 140 MEXICO MARKET SHARE ANALYSIS BY TYPE (2025)
FIGURE 141 MEXICO MARKET SHARE ANALYSIS BY END USER (2025)
FIGURE 142 CHINA MARKET SHARE ANALYSIS BY TYPE (2025)
FIGURE 143 CHINA MARKET SHARE ANALYSIS BY END USER (2025)
FIGURE 144 JAPAN MARKET SHARE ANALYSIS BY TYPE (2025)
FIGURE 145 JAPAN MARKET SHARE ANALYSIS BY END USER (2025)
FIGURE 146 INDIA MARKET SHARE ANALYSIS BY TYPE (2025)
FIGURE 147 INDIA MARKET SHARE ANALYSIS BY END USER (2025)
FIGURE 148 SOUTH KOREA MARKET SHARE ANALYSIS BY TYPE (2025)
FIGURE 149 SOUTH KOREA MARKET SHARE ANALYSIS BY END USER (2025)
FIGURE 150 SAUDI ARABIA MARKET SHARE ANALYSIS BY TYPE (2025)
FIGURE 151 SAUDI ARABIA MARKET SHARE ANALYSIS BY END USER (2025)
FIGURE 152 UAE MARKET SHARE ANALYSIS BY TYPE (2025)
FIGURE 153 UAE MARKET SHARE ANALYSIS BY END USER (2025)
FIGURE 154 EGYPT MARKET SHARE ANALYSIS BY TYPE (2025)
FIGURE 155 EGYPT MARKET SHARE ANALYSIS BY END USER (2025)
FIGURE 156 NIGERIA MARKET SHARE ANALYSIS BY TYPE (2025)
FIGURE 157 NIGERIA MARKET SHARE ANALYSIS BY END USER (2025)
FIGURE 158 SOUTH AFRICA MARKET SHARE ANALYSIS BY TYPE (2025)
FIGURE 159 SOUTH AFRICA MARKET SHARE ANALYSIS BY END USER (2025)
FIGURE 160 GERMANY MARKET SHARE ANALYSIS BY TYPE (2025)
FIGURE 161 GERMANY MARKET SHARE ANALYSIS BY END USER (2025)
FIGURE 162 FRANCE MARKET SHARE ANALYSIS BY TYPE (2025)
FIGURE 163 FRANCE MARKET SHARE ANALYSIS BY END USER (2025)
FIGURE 164 UK MARKET SHARE ANALYSIS BY TYPE (2025)
FIGURE 165 UK MARKET SHARE ANALYSIS BY END USER (2025)
FIGURE 166 SPAIN MARKET SHARE ANALYSIS BY TYPE (2025)
FIGURE 167 SPAIN MARKET SHARE ANALYSIS BY END USER (2025)
FIGURE 168 ITALY MARKET SHARE ANALYSIS BY TYPE (2025)
FIGURE 169 ITALY MARKET SHARE ANALYSIS BY END USER (2025)
FIGURE 170 BRAZIL MARKET SHARE ANALYSIS BY TYPE (2025)
FIGURE 171 BRAZIL MARKET SHARE ANALYSIS BY END USER (2025)
FIGURE 172 ARGENTINA MARKET SHARE ANALYSIS BY TYPE (2025)
FIGURE 173 ARGENTINA MARKET SHARE ANALYSIS BY END USER (2025)
FIGURE 174 COLUMBIA MARKET SHARE ANALYSIS BY TYPE (2025)
FIGURE 175 COLUMBIA MARKET SHARE ANALYSIS BY END USER (2025)
FIGURE 176 POST-HARVEST LOSS PREVENTION MARKET CURRENT AND FUTURE MARKET KEY COUNTRY LEVEL ANALYSIS, 2025–2034, (USD MILLION)
FIGURE 177 FINANCIAL OVERVIEW:
Key Player Analysis
JBT Marel Corporation
JBT Marel Corporation, headquartered jointly in Chicago (USA) and Reykjavik (Iceland), became the world's largest integrated food processing and fresh produce technology company following the January 2, 2025 completion of JBT Corporation's USD 4.4 billion acquisition of Marel hf. The combined entity — operating under the NYSE and Nasdaq Iceland ticker JBTM — generated standalone JBT revenue of USD 1.72 billion in 2024 and established combined 2025 revenue guidance of USD 3.65 to 3.73 billion, with over 50% of revenue derived from recurring products and services. JBT Marel's post-harvest technology portfolio spans ProDOSE automated wax dosing machines (the ProDOSE Pineapple receiving the 2025 AgTech Breakthrough Awards' Freshness Control Solution of the Year recognition), cold-chain automation systems, produce coatings and waxes, and OmniBlu digital monitoring software, giving the company unmatched vertical integration from produce reception through packaging.
The merger delivers strategic differentiation through scale: JBT Marel operates 133 locations across 29 countries, enabling global customer coverage that smaller treatment-only providers cannot match. The company targets USD 35 to 40 million in realized cost synergies during 2025, contributing to adjusted EBITDA margin expansion from the 13.1% reported in Q1 2025. JBT Marel's key differentiator in the post-harvest loss prevention market is its ability to bundle physical treatment equipment — coating, cooling, and sorting machinery — with digital monitoring platforms and lifetime service contracts, creating recurring revenue streams that reduce customer price sensitivity and raise competitive switching barriers.
AgroFresh Solutions, Inc.
AgroFresh Solutions, Inc. (acquired by Paine Schwartz Partners in November 2022 and operating under its established brand) is headquartered in Collegeville, Pennsylvania, and has built its market position around the SmartFresh Quality System, the commercial 1-MCP ethylene management platform that extended apple and pear shelf life from weeks to months when first introduced and now covers a range of crops from kiwifruit to broccoli. AgroFresh operates seven innovation centers on four continents and maintains ISO 9001 and ISO 14001 management system certifications across its coatings manufacturing operations. The company's FreshCloud digital ecosystem, which by November 2025 integrated AI orchard analytics from Aerobotics and high-speed optical inspection from Neolithics alongside existing partners Rubens Technologies, Strella Biotechnology, and Escavox, positions AgroFresh as the leading data-layer provider in fresh produce post-harvest management — a differentiated capability that physical treatment vendors cannot easily replicate.
In July 2025, AgroFresh's SmartFresh InBox sachets entered the Indian market through Tropical Agrosystem (India) Pvt. Ltd., extending its geographic reach into a 200 million-tonne fresh produce market with minimal fixed infrastructure investment. AgroFresh's strategic differentiator is its dual-layer moat: proprietary chemistry (1-MCP is covered by a broad IP estate) combined with a growing digital ecosystem that creates data network effects as more growers and packers contribute quality data to FreshCloud's analytical models.
DECCO Postharvest (UPL Ltd.)
DECCO Postharvest, the post-harvest solutions division of UPL Ltd. (NSE/BSE: UPL, LSE: UPLL), operates across more than 40 countries with a 90-plus year history in post-harvest coating and decay control chemistry. DECCO's product portfolio spans edible wax coatings, broad-spectrum fungicidal treatments, plant growth regulators including 1-MCP, bio-fungicides (Nexy, distributed under an exclusive agreement with Agrauxine), sanitizers, and purpose-built application equipment including the CATsystem automatic fungicide dosing platform commercialized in June 2024. In October 2025, DECCO expanded its manufacturing footprint to nine global production plants with the commissioning of a new facility in Beniparrell, Valencia, Spain, enhancing its supply chain proximity to Spain's citrus export industry — which generates more than EUR 3.5 billion in annual fresh citrus exports per Spain's Ministry of Agriculture, Fisheries, and Food.
DECCO Ibérica's registration of DECCO Zox (azoxystrobin) for post-harvest citrus protection in Spain — the first and only azoxystrobin post-harvest registration in Europe as of 2025 — illustrates DECCO's strategy of securing first-mover regulatory positions that provide durable commercial exclusivity in high-value produce categories. DECCO's key differentiator is its combination of chemistry depth, equipment integration capability, and the on-site service model that places dedicated DECCO technical staff inside major packhouses, creating high customer retention through embedded expertise rather than product transactions.
BASF SE, headquartered in Ludwigshafen, Germany, participates in the post-harvest loss prevention market primarily through its agricultural solutions division (Crop Protection), which develops and sells fungicidal actives including triazoles, strobilurins, and carboxamides applied in both pre-harvest field programs and post-harvest treatment applications. BASF's Intrinsic brand fungicide family, including the 2025 US introduction of Pillar SC Intrinsic, provides multi-mode-of-action disease control applicable to packhouse and storage environments. BASF SE reported total agricultural solutions revenue of approximately EUR 7.5 billion in 2024 per its annual report, with post-harvest applications constituting an estimated sub-segment of its broader fungicide portfolio rather than a separately disclosed business.
BASF's strategic advantage in post-harvest treatment lies in its R&D scale — the company invested EUR 2.2 billion in agricultural R&D between 2022 and 2024 — enabling it to develop biological active ingredients and combination products that comply with tightening EU MRL standards while maintaining efficacy comparable to established synthetic compounds. BASF's global regulatory affairs infrastructure across 90 countries enables faster post-harvest product registration compared to smaller specialty companies, making it the preferred supply partner for multinational food retailers seeking globally harmonized MRL compliance.
Market Key Players
JBT MAREL CORPORATION
AGROFRESH SOLUTIONS, INC.
DECCO POSTHARVEST (UPL LTD.)
BASF SE
SYNGENTA CROP PROTECTION AG
NUFARM LIMITED
APEEL SCIENCES
CITROSOL S.A.
PACE INTERNATIONAL LLC
HAZEL TECHNOLOGIES, INC.
XEDA INTERNATIONAL S.A.S.
FOMESA FRUITECH S.L.
FUTURECO BIOSCIENCE S.A.
BAYER AG
FMC CORPORATION
LINEAGE, INC.
AMERICOLD REALTY TRUST
SEALED AIR CORPORATION
Others
Drivers
Increasing Global Focus on Food Security and Waste Reduction
The growing need to reduce food losses across agricultural supply chains is a major driver of the global post-harvest loss prevention market. A significant portion of agricultural production is lost after harvesting due to inadequate storage facilities, improper handling, transportation challenges, and lack of preservation technologies. Governments, agricultural organizations, and food companies are increasingly implementing strategies to minimize post-harvest losses and improve food availability.
Rising global population, increasing food demand, and concerns regarding resource efficiency are encouraging the adoption of advanced post-harvest solutions. Technologies such as improved storage systems, protective treatments, smart packaging, and monitoring solutions are gaining importance as essential tools for maintaining crop quality and extending shelf life.
Growing Adoption of Advanced Storage and Preservation Technologies
The increasing use of modern preservation technologies is significantly supporting market growth. Solutions such as controlled atmosphere storage, cold chain infrastructure, modified atmosphere packaging, and biological treatments are helping reduce spoilage and maintain nutritional quality across various agricultural products.
The expansion of agricultural technology and digital farming solutions is further accelerating adoption. Smart sensors, real-time monitoring systems, and automated storage management platforms enable better control of environmental conditions, reducing losses and improving efficiency throughout the food supply chain.
Restraints
High Implementation Costs and Infrastructure Limitations
The high cost associated with advanced post-harvest management technologies remains a key challenge for market growth. Investments required for cold storage facilities, advanced packaging systems, monitoring equipment, and treatment solutions can be significant, particularly for small-scale farmers and agricultural businesses in developing regions.
Limited access to financing, inadequate infrastructure, and lack of technical expertise can restrict adoption among smaller producers. Many regions continue to rely on traditional storage and handling methods, slowing the transition toward modern post-harvest loss prevention solutions.
Lack of Awareness and Technical Knowledge
Limited awareness regarding advanced post-harvest technologies is another factor affecting market expansion. Many farmers and supply chain operators lack sufficient knowledge about modern preservation methods, proper handling practices, and the economic benefits of reducing post-harvest losses.
Additionally, insufficient training programs and limited availability of skilled professionals can create operational challenges. Improving education, technical support, and awareness initiatives will be essential to increasing adoption across emerging agricultural markets.
Trends
Integration of Smart Technologies and Digital Monitoring
The integration of digital technologies is becoming a major trend in the post-harvest loss prevention market. IoT-enabled sensors, artificial intelligence, and data analytics are being increasingly used to monitor storage conditions such as temperature, humidity, and product quality in real time.
These technologies help identify potential spoilage risks early and enable proactive decision-making across agricultural supply chains. The adoption of smart monitoring solutions is expected to increase as food producers and distributors seek greater transparency, efficiency, and quality control.
Growth of Sustainable and Eco-Friendly Preservation Solutions
The rising demand for sustainable agricultural practices is driving the development of environmentally friendly post-harvest preservation solutions. Biological treatments, natural coatings, biodegradable packaging materials, and chemical-free preservation methods are gaining attention as alternatives to conventional approaches.
Consumers and regulatory bodies are increasingly encouraging sustainable food production practices, pushing companies to develop solutions that reduce waste while minimizing environmental impact. This trend is expected to create new opportunities for innovative post-harvest technologies.
Opportunities
Expansion of Cold Chain Infrastructure in Emerging Markets
The rapid development of cold chain infrastructure in emerging economies presents significant growth opportunities for the post-harvest loss prevention market. Increasing investments in refrigerated transportation, storage facilities, and logistics networks are helping reduce losses of perishable agricultural products such as fruits, vegetables, dairy products, and seafood.
Government initiatives aimed at strengthening agricultural supply chains and improving food distribution systems are further supporting market expansion. As developing regions modernize their food infrastructure, demand for efficient preservation and storage solutions is expected to increase.
Rising Demand for Sustainable Food Supply Chain Solutions
The growing emphasis on sustainable food systems is creating new opportunities for post-harvest loss prevention technologies. Food companies, retailers, and governments are increasingly focusing on reducing waste, improving resource utilization, and building resilient agricultural supply chains.
Innovations in smart packaging, digital tracking, and advanced preservation techniques are opening new avenues for market growth. Strategic collaborations among technology providers, agricultural organizations, and food industry stakeholders are expected to accelerate the adoption of next-generation post-harvest solutions worldwide.
Investment and M&A Activity
The post-harvest loss prevention market recorded approximately USD 5.8 billion in disclosed M&A and corporate investment activity over the trailing 12 months through May 2026, reflecting consolidation dynamics at the food processing equipment tier and expansion investment at the specialty treatment tier. The JBT and Marel hf. combination — the single largest transaction in the space — set USD 4.4 billion as the landmark deal value for the period, establishing JBT Marel Corporation as the reference platform for integrated fresh produce technology.
Beyond the JBT-Marel consolidation, venture and strategic funding activity concentrated in bio-based treatments and digital monitoring platforms. BioPrime, a specialist in biological post-harvest fungicide and insecticide development, closed a USD 6 million funding round for advanced bio-fungicide and bio-insecticide programs, reported through industry sources in 2025. Cereals Canada's GATE initiative drew a combined USD 13.4 million commitment from provincial grain grower groups in Canada, funding advanced grain treatment and loss reduction research. The Manitoba Government's USD 13 million investment in the Downtown Agriculture Exchange further reinforced public-capital flows toward post-harvest infrastructure in North America. Private equity ownership at AgroFresh Solutions — held by Paine Schwartz Partners since November 2022 — continues to shape corporate strategy toward digital platform development and recurring revenue expansion rather than capital-heavy infrastructure, a structural preference that distinguishes treatment-specialist M&A logic from equipment-sector acquisitions.
Midstream post-harvest assets — cold storage networks, grain elevators, and processing facilities — attracted M&A attention from food manufacturers and commodity traders seeking supply chain control. Industry M&A commentary from agricultural advisory firms in 2025 documented multiple instances of food manufacturers acquiring vertically integrated indoor farming operations and minority stakes in AI-based yield forecasting platforms, reflecting a thesis that data-rich post-harvest infrastructure commands premium valuations from acquirers prioritizing supply chain resilience over pure financial returns. Valuation multiples for bio-based treatment companies remain elevated relative to synthetic-chemical counterparts, as buyers price in regulatory tailwind from EU Farm-to-Fork and US organic growth markets.
Recent Developments
November 2025 | AgroFresh Solutions, Inc.
During November 2025, AgroFresh broadened its FreshCloud digital ecosystem by forming technology alliances with Aerobotics and Neolithics, embedding AI-powered orchard sizing and high-speed optical packhouse inspection into a platform that now connects six partner data sources. The integration extends FreshCloud's reach from orchard-level yield forecasting to in-line quality grading, enabling growers and packers to obtain continuous, objective quality data across the full pre-to-packhouse workflow.
Strategic Impact: By owning the data aggregation layer across the fresh produce supply chain, AgroFresh is establishing a network-effect moat that compounds as more producers contribute data, making the platform progressively more accurate and switching costs progressively higher — a competitive dynamic that treatment-only vendors cannot replicate.
October 2025 | DECCO Postharvest (UPL Ltd.)
In October 2025, DECCO commissioned a ninth global production facility in Beniparrell, Valencia, Spain — its second manufacturing site in the Valencia region — bringing total manufacturing capacity to a nine-plant worldwide network. The site, announced in September 2025, was designed to reduce lead times and strengthen supply security for citrus and tropical fruit packers across the European Union and Mediterranean export markets.
Strategic Impact: Geographic proximity to Spain's EUR 3.5 billion-plus citrus export sector gives DECCO a logistics cost advantage versus import-dependent competitors and positions the company to capture volume from mandarin and orange growers requiring just-in-time coating and fungicide supply during peak packing seasons.
July 2025 | AgroFresh Solutions, Inc. & Tropical Agrosystem (India) Pvt. Ltd.
During July 2025, Tropical Agrosystem (India) Pvt. Ltd. and AgroFresh formalized a distribution arrangement covering SmartFresh InBox sachets across the Indian domestic market. The agreement channels AgroFresh's 1-MCP ethylene management technology through Tropical Agro's established crop protection distribution network, reaching mango, guava, and pomegranate producers without requiring fixed cold storage infrastructure.
Strategic Impact: The partnership demonstrates how intellectual-property-intensive, low-infrastructure-dependency treatment formats — small-format sachets generating 1-MCP gas in transit containers — can penetrate high-loss, infrastructure-constrained markets that capital-intensive cold chain solutions cannot serve economically.
January 2025 | JBT Marel Corporation
On January 2, 2025, JBT Corporation finalized its voluntary takeover of Marel hf., with 97.5% of Marel shareholders accepting the offer, and the combined entity commenced trading as JBT Marel Corporation (NYSE and Nasdaq Iceland: JBTM). The transaction, valued at approximately EUR 3.5 billion including Marel's net debt, brought together JBT's post-harvest produce handling and coating expertise with Marel's advanced poultry, meat, and fish processing systems.
Strategic Impact: The merger creates the only global food processing technology company with deep competency across fresh produce post-harvest treatment equipment and protein processing automation, enabling cross-selling of digital platforms (OmniBlu and Innova) across a combined installed base that competitors cannot access without comparable capital deployment.
November 2025 | AgroFresh Solutions, Inc. FreshCloud Sensor Expansion
Building on its FreshCloud integrations, AgroFresh further extended real-time quality control capabilities by incorporating sensor data from produce-monitoring partners including Strella Biotechnology and Escavox during late 2024 through November 2025, consolidating ethylene sensor readings, carbon dioxide atmosphere data, and visual inspection outputs into a unified dashboard available to growers, packers, and retail buyers.
Strategic Impact: Multi-sensor data fusion reduces the dependence on single-point quality assessment — historically the main failure mode in post-harvest quality management — and gives retail buyers verifiable chain-of-custody quality data that supports premium pricing and reduces markdown losses at store level.
June 2024 | Citrosol S.A.
During June 2024, Citrosol S.A. brought to market the CATsystem — described by the company as the world's first fully automated control system for post-harvest fungicide treatments. The system maintains fungicide concentration in treatment baths within prescribed tolerance bands in real time, reducing chemical consumption waste, mitigating resistance development, and improving treatment consistency across high-volume citrus and pome fruit packing lines.
Strategic Impact: Precision dosing automation addresses the dual regulatory and cost pressures facing packhouses: EU Regulation (EC) No. 396/2005 compliance requires demonstrably consistent MRL-compliant treatment concentrations, while rising fungicide input costs create a financial return for reducing overdosing — making CATsystem adoption financially self-justifying within a single packing season for high-volume operations.
Frequently Asked Questions
How big is the Post-Harvest Loss Prevention Market?
Global Post-Harvest Loss Prevention Market was valued at USD 3.18 Billion in 2025 and is projected to reach USD 5.76 Billion by 2034, growing at a CAGR of 6.8% during 2026–2034. Explore market trends, drivers, opportunities, segmentation, and industry insights.
Who are the major players in the Post-Harvest Loss Prevention Market?
JBT MAREL CORPORATION, AGROFRESH SOLUTIONS, INC., DECCO POSTHARVEST (UPL LTD.), BASF SE, SYNGENTA CROP PROTECTION AG, NUFARM LIMITED, APEEL SCIENCES, CITROSOL S.A., PACE INTERNATIONAL LLC, HAZEL TECHNOLOGIES, INC., XEDA INTERNATIONAL S.A.S., FOMESA FRUITECH S.L., FUTURECO BIOSCIENCE S.A., BAYER AG, FMC CORPORATION, LINEAGE, INC., AMERICOLD REALTY TRUST, SEALED AIR CORPORATION, Others
Which segments covered the Post-Harvest Loss Prevention Market?
By Treatment Type, (Chemical Treatment, Biological Treatment, Physical Treatment, Thermal Treatment, Storage & Packaging Solutions, Others), By Crop Type, (Fruits & Vegetables, Cereals & Grains, Pulses & Legumes, Oilseeds, Spices, Others), By Product Form, (Liquid, Powder, Granules, Films & Packaging Materials, Others), By End-User, (Farmers & Agricultural Producers, Food Processing Companies, Storage & Warehouse Operators, Retailers & Distributors, Government & Research Institutions, Others),
How can this market research report help my business make strategic decisions?
Our market research reports provide actionable intelligence, including verified market size data, CAGR projections, competitive benchmarking, and segment-level opportunity analysis. These insights support strategic planning, investment decisions, product development, and market entry strategies for enterprises and startups alike.
How frequently is the data updated?
We continuously monitor industry developments and update our reports to reflect regulatory changes, technological advancements, and macroeconomic shifts. Updated editions ensure you receive the latest market intelligence.


 Aerospace And Defence
 Agriculture
 Automotive And Transportation
 Banking And Finance
 Business
 Chemicals And Materials
 Consumer And Retail
 Electronics And Semiconductors
 Food And Beverages
 Machinery & Equipments
 Manufacturing And Construction
 Medical Devices
 Others
 Pharmaceuticals And Healthcare
 Power And Energy
 Sports
 Technology