
- Home
- Industries
 Aerospace And Defence
 Agriculture
 Automotive And Transportation
 Banking And Finance
 Business
 Chemicals And Materials
 Consumer And Retail
 Electronics And Semiconductors
 Food And Beverages
 Machinery & Equipments
 Manufacturing And Construction
 Medical Devices
 Others
 Pharmaceuticals And Healthcare
 Power And Energy
 Sports
 Technology
- Services
- News Room
- About us
- Contact Us
-
Potato Chips Market Size, Share & Growth Forecast 2034 | 5.0% CAGR
Global Potato Chips Market Size, Share, Analysis Report By Type (Fried, Baked, Dried, Others), Category (Conventional, Organic), Flavour (Regular, Single Flavor, Blended Flavor, Plain/Salted), End-User (Food Service Sector, Retail), Distribution Channel (Convenience Stores, Supermarkets & Hypermarkets, Online, Others), Region and Key Players - Industry Segment Overview, Market Dynamics, Competitive Strategies, Trends and Forecast 2025-2034

Report Overview:
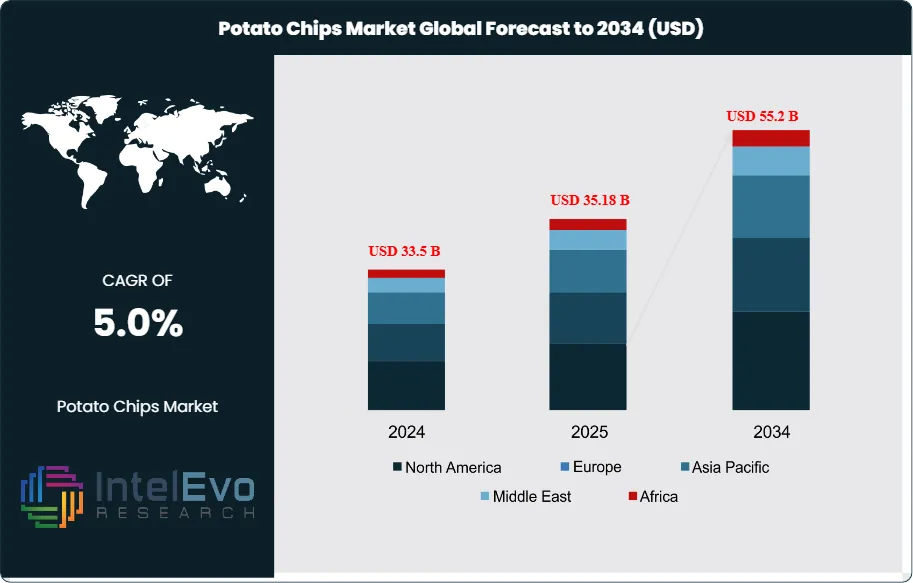
The Global Potato Chips Market size is expected to reach USD 55.2 billion by 2034, up from USD 33.5 billion in 2024, growing at a CAGR of 5.0% during the forecast period from 2025 to 2034. The market growth is fueled by the rising demand for convenient and ready-to-eat snack foods, driven by changing lifestyles, urbanization, and increasing disposable incomes worldwide. Consumers are increasingly seeking flavored, low-fat, and health-conscious variants, which is encouraging innovation and product diversification in the sector. Moreover, the expansion of modern retail chains and e-commerce platforms is improving accessibility, further boosting market penetration across regions.
Get More Information about this report -
Request Free Sample ReportPotato chips are thinly sliced potatoes that are either deep-fried or baked until they become crispy. These snacks are widely consumed across the globe due to their convenience, taste, and availability in various flavors. As one of the most popular ready-to-eat snacks, the potato chips market has witnessed steady growth over the years. Increasing urbanization, rising disposable incomes, and fast-paced lifestyles have led to greater demand for on-the-go snacking options. Additionally, the growth of modern retail formats such as supermarkets and convenience stores has enhanced accessibility to a wide range of snack options, further boosting market demand.
Several key factors influence the potato chips market. Product innovation remains central to driving consumer interest, with brands frequently introducing unique flavors, organic variants, and healthier alternatives such as baked or low-fat chips. Consumers are increasingly health-conscious and seek snacks with reduced sodium, trans fats, and artificial additives, encouraging manufacturers to adopt clean-label ingredients. Moreover, rising global internet penetration and mobile device usage have fueled the growth of e-commerce platforms, making snacks like potato chips easily accessible for online purchase. Packaging innovations, improved shelf life, and product personalization are also contributing to the market’s sustained expansion.
North America remains the largest consumer of potato chips due to the region’s long-established snacking culture and the presence of several key players such as PepsiCo (Lay’s). The region benefits from a high standard of living and consumer willingness to spend on convenient foods. Europe also holds a significant market share, particularly due to its demand for premium and artisanal products. Meanwhile, Asia-Pacific is experiencing the fastest growth, driven by increasing urban populations, evolving taste preferences, and higher disposable incomes in countries like China, India, and Indonesia. This region presents strong growth potential, especially with local players launching regional flavor variants.
The COVID-19 pandemic had a varied impact on the global potato chips market. Initially, supply chain disruptions, lockdowns, and panic buying led to inconsistent product availability in retail stores. However, as people adapted to stay-at-home lifestyles, consumption of comfort and convenience foods, including potato chips, surged significantly. This led to a rise in bulk purchases and home snacking, especially in developed markets. The pandemic also accelerated digital transformation, with consumers turning to online platforms to buy groceries and snacks. Many manufacturers responded by strengthening their online presence and expanding direct-to-consumer sales channels. Although the foodservice sector temporarily declined, at-home consumption compensated for this loss, keeping the market relatively stable. Post-pandemic, the focus on health and wellness continues to shape product offerings, with a growing demand for healthier chip variants and sustainable packaging solutions.
, Category (Conventional, Organic), Flavour (Regular, Single Flavor, Blended Flavor, Plain/Salted), End-User (Food Service Sector, Retail), Distribution Channel (Convenience Stores, Supermarkets & Hypermarkets, Online, Others), Region and Key Players - Industry Segment Overview, Market Dynamics, Competitive Strategies, Trends and Forecast 2025-2034")
Key Takeaways:
- Market Growth: The Potato Chips Market is expected to reach USD 55.2 billion by 2034, growing at a robust CAGR of 5.0%, rising demand for convenience foods, and evolving retail landscapes.
- Type Dominance: Fried chips holding the dominant market share due to their widespread popularity and taste appeal. However, baked and dried chips are gaining traction as consumers seek healthier snacking alternatives driven by increasing health consciousness.
- Category Dominance: Conventional chips currently dominating due to their affordability, widespread availability, and strong brand presence. However, organic potato chips are gaining momentum as consumer preferences shift toward healthier, clean-label, and environmentally sustainable products.
- Flavour Dominance: Regular segment leads due to its broad consumer appeal, brand familiarity, and consistent demand. While Regular dominates, the Blended Flavor segment is emerging as a fast-growing category, fueled by consumer interest in adventurous and global taste profiles.
- End-User Dominance: The Retail/Household segment currently dominates the potato chips market, driven by strong at-home snacking trends and easy product accessibility through supermarkets, convenience stores, and e-commerce.
- Distribution Channel Dominance: Supermarkets & Hypermarkets segment leads the potato chips market due to its extensive reach, wide product variety, and consumer trust in in-store purchases.
- Driver: Primarily driven by rising urbanization, fast-paced lifestyles, and the increasing demand for convenient and ready-to-eat snack options. Innovations in flavors and healthier alternatives further propel consumer interest and drive repeat purchases.
- Restraint: Health concerns over high fat, sodium, and calorie content in potato chips are major market restraints. Additionally, rising awareness around obesity and non-communicable diseases has prompted consumers to shift toward healthier snack alternatives.
- Opportunity: Emerging markets and increasing online retail channels present lucrative growth opportunities for the potato chips market. There's also a significant opportunity in expanding healthier product lines to meet evolving consumer demands.
- Trend: The potato chips market is witnessing a rise in demand for premium, clean-label, and sustainable products. Consumers are also gravitating toward personalized snacking experiences and region-specific flavors, driven by social media and experiential marketing.
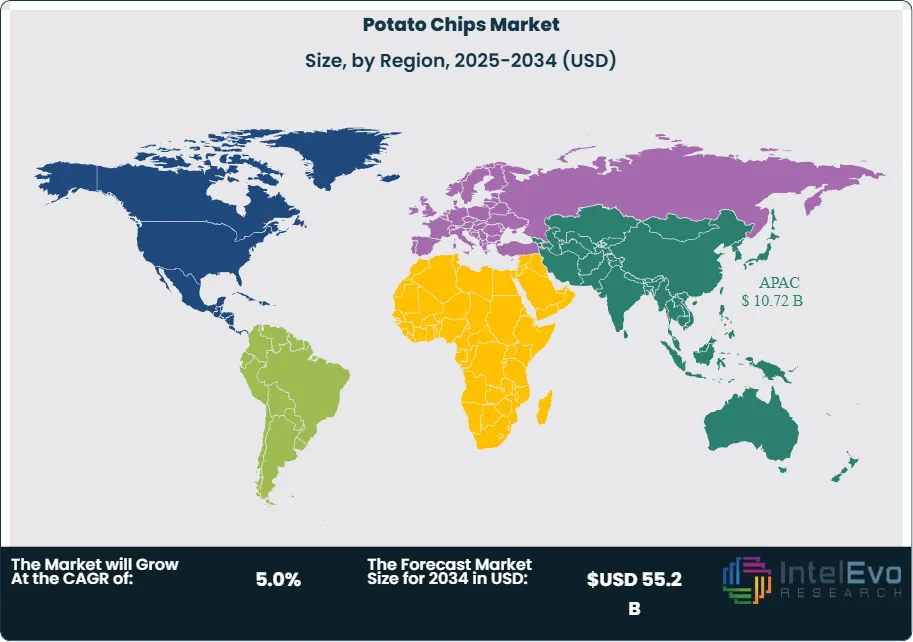
- Regional Analysis: Asia-Pacific leads the global potato chips market due to its large population, rising disposable incomes, and increasing demand for convenient snacks. While North America and Europe maintain strong market presence, the rapid expansion of retail networks and changing food habits in Asia-Pacific are fueling accelerated growth.
Type Analysis:
Fried Leads With more than 65% of Market Share in Potato Chips Market: Fried potato chips remain the most consumed type globally, largely because of their strong taste, availability, and long-standing consumer loyalty. Major brands like Lay’s and Pringles dominate this segment with wide-ranging flavor innovations. Despite rising health concerns over oil content, fried chips continue to hold a commanding lead due to aggressive marketing, attractive packaging, and affordable pricing. This segment is also deeply embedded in fast food and retail snacking culture, contributing to sustained demand.
The baked and dried segments are witnessing a steady rise, fueled by the global shift toward low-fat, low-calorie snacks. Baked chips, in particular, offer a healthier alternative without compromising too much on taste, making them popular among urban, health-conscious consumers.
Category Analysis:
Conventional potato chips hold the largest share of the market, largely due to their low production costs, extensive distribution networks, and established consumer base. These chips are easily accessible across convenience stores, supermarkets, and foodservice outlets, making them a go-to snack for most consumers. Additionally, their lower price point compared to organic options makes them attractive to a wider demographic, especially in price-sensitive markets.
The organic segment is emerging as a high-growth area, driven by increasing health awareness, demand for non-GMO ingredients, and sustainability concerns. Consumers are increasingly scrutinizing product labels and leaning toward chips made from organically grown potatoes without synthetic fertilizers or pesticides.
Product Analysis:
The Regular flavor segment holds the largest share in the potato chips market, driven by its classic taste, high consumer familiarity, and deep-rooted presence in retail shelves globally. These chips often serve as the “default” choice for consumers, especially during social events, gatherings, or snacking moments where universally liked flavors are preferred. Its simplicity appeals across age groups and geographies, making it the most stable and trusted segment in terms of volume and revenue generation.
Blended Flavor potato chips are showing the fastest growth potential as consumers increasingly seek unique, multi-dimensional taste experiences. This segment caters especially to younger demographics and urban consumers with a preference for novel and bold snack options.
End-User Analysis:
The Retail/Household segment leads the potato chips market due to its direct alignment with consumer snacking habits at home, which surged further post-COVID-19. The convenience of ready-to-eat chips and their availability in various pack sizes make them a staple item in shopping carts. The rising culture of remote work and streaming entertainment has further enhanced at-home snacking, reinforcing this segment’s dominance.
The Food Service Sector is set to grow steadily due to increasing snack demand in quick-service restaurants (QSRs), hotels, cinemas, and cafeterias. Many establishments are incorporating premium and customized chip options into their menus to elevate the consumer experience.
Distribution Channel Analysis:
Supermarkets and Hypermarkets Leads With over 50% of Market Share in Potato Chips Market: Supermarkets and hypermarkets dominate the potato chips distribution landscape due to their strategic physical presence, product visibility, and broad assortment of brands and flavors. Consumers prefer this channel for its ability to offer value packs, promotional deals, and the opportunity to physically inspect products before purchase. This segment continues to thrive in both urban and semi-urban areas, where consumers enjoy the one-stop shopping experience and immediate product availability.
The online distribution channel is poised for significant growth due to shifting consumer behavior favoring digital shopping. Increased internet penetration, mobile commerce, and evolving consumer preferences for convenience have accelerated the adoption of platforms like Amazon, Instacart, and direct-to-consumer brand websites.
Region Analysis:
The Asia-Pacific region has emerged as the dominant force in the global potato chips market, fueled by a combination of factors including a growing urban population, rising middle-class incomes, and evolving snacking behaviors. Countries like India, China, Japan, and Indonesia are experiencing a significant increase in demand for packaged and ready-to-eat snacks, especially potato chips, driven by youth preferences and expanding retail infrastructure. The introduction of region-specific flavors and affordable pricing has further accelerated market penetration. In addition, the rise of e-commerce and quick-commerce platforms is making chips more accessible across urban and semi-urban areas.
While North America and Europe continue to be mature markets characterized by high per capita consumption and product innovation, growth in these regions is relatively stable. On the other hand, Asia-Pacific is expected to lead future market expansion, especially in the baked and organic chip segments, due to increasing health awareness. Manufacturers are leveraging this momentum by launching new products tailored to local tastes and investing in distribution channels across the region.
Get More Information about this report -
Request Free Sample ReportKey Market Segment
By Type
- Fried
- Baked
- Dried
- Others
By Product Type
- Conventional/Classic Potato Chips
- Flavored Potato Chips
- Baked & Low-Fat Potato Chips
- Organic & Specialty Potato Chips
By Flavor
- Salted
- Cheese
- Barbecue
- Sour Cream & Onion
- Others
By Packaging Type
- Small Pack (Individual Serving)
- Medium Pack (Family Size)
- Large Pack (Bulk)
By Distribution Channel
- Supermarkets & Hypermarkets
- Convenience Stores
- Online Retail / E-commerce
- Others (Specialty Stores, Vending Machines)
By End-User
- Food Service Sector
- Retail/Household
By Region
- North America
- Latin America
- East Asia And Pacific
- Sea And South Asia
- Eastern Europe
- Western Europe
- Middle East & Africa
| Report Attribute | Details |
| Market size (2025) | USD 35.18 B |
| Forecast Revenue (2034) | USD 55.2 B |
| CAGR (2025-2034) | 5.0% |
| Historical data | 2018-2023 |
| Base Year For Estimation | 2024 |
| Forecast Period | 2025-2034 |
| Report coverage | Revenue Forecast, Competitive Landscape, Market Dynamics, Growth Factors, Trends and Recent Developments |
| Segments covered | By Type (Fried, Baked, Dried, Others), By Product Type (Conventional/Classic Potato Chips, Flavored Potato Chips, Baked & Low-Fat Potato Chips, Organic & Specialty Potato Chips), By Flavor (Salted, Cheese, Barbecue, Sour Cream & Onion, Others), By Packaging Type (Small Pack (Individual Serving), Medium Pack (Family Size), Large Pack (Bulk)), By Distribution Channel (Supermarkets & Hypermarkets, Convenience Stores, Online Retail / E-commerce, Others (Specialty Stores, Vending Machines)), By End-User (Food Service Sector, Retail/Household) |
| Research Methodology |
|
| Regional scope |
|
| Competitive Landscape | PepsiCo, Great Lakes Potato Chips, The Campbell Soup Company, EuropeSnacks, The Kraft Heinz Company, Nestlé , LaSalle Capital, KP Snacks, Calbee Inc., The Lorenz Bahlsen Snack-World GmbH & Co KG, Old Dutch Foods, Kellanova, Burts Potato Chips Ltd, Utz Brands Inc., Bikaji Foods International Ltd., Kettle Brand |
| Customization Scope | Customization for segments, region/country-level will be provided. Moreover, additional customization can be done based on the requirements. |
| Pricing and Purchase Options | Avail customized purchase options to meet your exact research needs. We have three licenses to opt for: Single User License, Multi-User License (Up to 5 Users), Corporate Use License (Unlimited User and Printable PDF). |
, Category (Conventional, Organic), Flavour (Regular, Single Flavor, Blended Flavor, Plain/Salted), End-User (Food Service Sector, Retail), Distribution Channel (Convenience Stores, Supermarkets & Hypermarkets, Online, Others), Region and Key Players - Industry Segment Overview, Market Dynamics, Competitive Strategies, Trends and Forecast 2025-2034")
, Category (Conventional, Organic), Flavour (Regular, Single Flavor, Blended Flavor, Plain/Salted), End-User (Food Service Sector, Retail), Distribution Channel (Convenience Stores, Supermarkets & Hypermarkets, Online, Others), Region and Key Players - Industry Segment Overview, Market Dynamics, Competitive Strategies, Trends and Forecast 2025-2034")
, Category (Conventional, Organic), Flavour (Regular, Single Flavor, Blended Flavor, Plain/Salted), End-User (Food Service Sector, Retail), Distribution Channel (Convenience Stores, Supermarkets & Hypermarkets, Online, Others), Region and Key Players - Industry Segment Overview, Market Dynamics, Competitive Strategies, Trends and Forecast 2025-2034")
Frequently Asked Questions
How big is the Potato Chips Market?
Explore the Global Potato Chips Market, projected to reach USD 55.2B by 2034 at 5.0% CAGR. Discover key trends, product innovations, and growth opportunities.
Who are the major players in the Potato Chips Market?
PepsiCo, Great Lakes Potato Chips, The Campbell Soup Company, EuropeSnacks, The Kraft Heinz Company, Nestlé , LaSalle Capital, KP Snacks, Calbee Inc., The Lorenz Bahlsen Snack-World GmbH & Co KG, Old Dutch Foods, Kellanova, Burts Potato Chips Ltd, Utz Brands Inc., Bikaji Foods International Ltd., Kettle Brand
Which segments covered the Potato Chips Market?
By Type (Fried, Baked, Dried, Others), By Product Type (Conventional/Classic Potato Chips, Flavored Potato Chips, Baked & Low-Fat Potato Chips, Organic & Specialty Potato Chips), By Flavor (Salted, Cheese, Barbecue, Sour Cream & Onion, Others), By Packaging Type (Small Pack (Individual Serving), Medium Pack (Family Size), Large Pack (Bulk)), By Distribution Channel (Supermarkets & Hypermarkets, Convenience Stores, Online Retail / E-commerce, Others (Specialty Stores, Vending Machines)), By End-User (Food Service Sector, Retail/Household)
How can this market research report help my business make strategic decisions?
Our market research reports provide actionable intelligence, including verified market size data, CAGR projections, competitive benchmarking, and segment-level opportunity analysis. These insights support strategic planning, investment decisions, product development, and market entry strategies for enterprises and startups alike.
How frequently is the data updated?
We continuously monitor industry developments and update our reports to reflect regulatory changes, technological advancements, and macroeconomic shifts. Updated editions ensure you receive the latest market intelligence.

Select Licence Type
Connect with our sales team
Why IntelEvoResearch
100%
Customer
Satisfaction
24x7+
Availability - we are always
there when you need us
200+
Fortune 50 Companies trust
IntelEvoResearch
80%
of our reports are exclusive
and first in the industry
100%
more data
and analysis
1000+
reports published
till date