Global Power Amplifier Market Size, Share, Analysis Report By Product (Audio Power Amplifier, RF Power Amplifier), Vertical (Consumer Electronics, Industrial, Telecommunication, Automotive, Military & Defense, Others), Region and Key Players - Industry Segment Overview, Market Dynamics, Competitive Strategies, Trends and Forecast 2025-2034
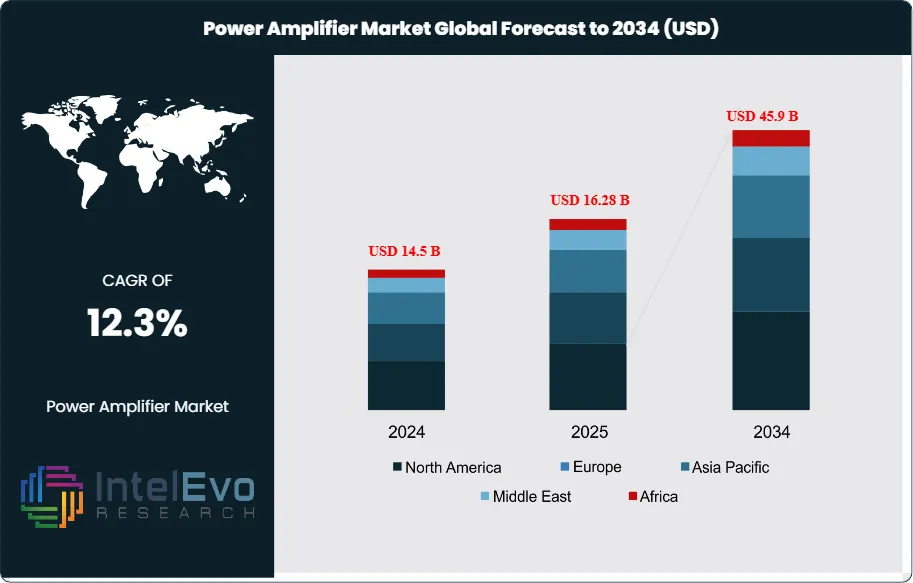
The Power Amplifier Market size is projected to be worth around USD 45.9 billion by 2034, up from USD 14.5 billion in 2024, growing at a CAGR of 12.3% during the forecast period from 2025 to 2034. The market growth is driven by the surging demand for high-efficiency amplifiers across consumer electronics, 5G infrastructure, and automotive applications. As connectivity expands and IoT devices multiply, power amplifiers are becoming crucial for delivering seamless performance and superior signal strength. The rising focus on energy-efficient and compact amplifier solutions is expected to further accelerate market adoption globally.
A power amplifier is an essential electronic device designed to increase the power level of an input signal, enabling it to drive a load such as a speaker, antenna, or other output devices. It functions by taking a low-power signal and amplifying it in terms of voltage, current, or both, to produce a higher-power output while maintaining the integrity of the original signal. Power amplifiers are commonly used in various applications, including audio systems, broadcasting, telecommunications, and industrial machinery. For instance, in audio systems, power amplifiers boost weak audio signals to a level that can effectively power loudspeakers, while in wireless communication systems, they amplify radio frequency (RF) signals for transmission over long distances. Different types of power amplifiers—such as audio, RF, and operational amplifiers—are designed to meet specific application needs. Their ability to deliver clean, efficient amplification makes them crucial components in both consumer electronics and high-performance industrial systems.
The growth dynamics of the power amplifier market are influenced by increasing demand across various sectors, including telecommunications, consumer electronics, automotive, and industrial applications. The rapid global rollout of 4G and 5G networks has significantly driven the need for RF power amplifiers, which are crucial for signal transmission in mobile and wireless communication infrastructure. At the same time, the rising popularity of smart devices, portable audio systems, and home entertainment has spurred demand for compact, energy-efficient audio power amplifiers. In the automotive sector, advancements in electric vehicles and in-car infotainment systems are further expanding the use of power amplifiers. Additionally, emerging technologies such as the Internet of Things (IoT), satellite communication, and defense electronics are opening new avenues for growth. Innovations in semiconductor materials, particularly gallium nitride (GaN) and silicon carbide (SiC), are also enhancing the efficiency, power density, and thermal performance of modern power amplifiers. These combined factors are contributing to a robust and evolving global power amplifier market.
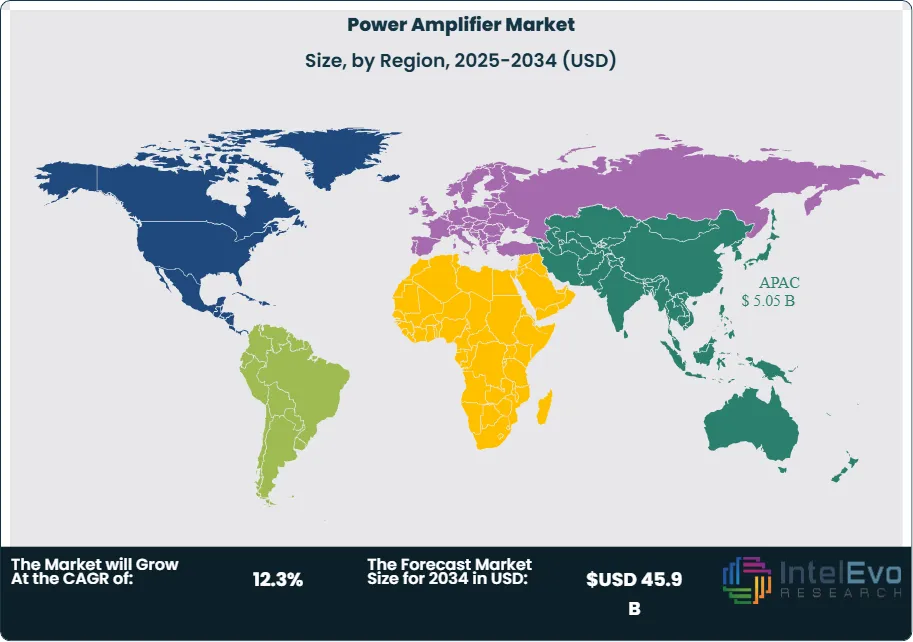
The Asia-Pacific power amplifier market is experiencing robust growth, driven by the rapid expansion of telecommunications infrastructure, increasing adoption of consumer electronics, and advancements in semiconductor technologies. This dominance is attributed to strong manufacturing capabilities and the presence of key industry players in countries like China, South Korea, and Japan, which are at the forefront of consumer electronics, telecommunications, and technological innovation. The proliferation of 5G networks and the surge in Internet of Things (IoT) devices have significantly boosted the demand for RF power amplifiers in the region. These amplifiers are essential for enabling wireless communication between IoT devices, which include sensors, actuators, and other smart devices embedded with wireless connectivity.
The COVID-19 pandemic significantly accelerated the adoption of power amplifiers across various industries. As companies faced strict social distancing protocols and labor shortages due to health concerns, the need for contactless and efficient material handling became more urgent. Warehouses and distribution centers turned to automation to maintain operations with fewer on-site workers, and power amplifiers proved to be a practical solution. These machines helped ensure business continuity while minimizing human interaction. The pandemic also exposed vulnerabilities in global supply chains, prompting companies to invest in resilient and flexible automation technologies. As a result, the demand for power amplifiers surged and continues to grow as businesses prioritize safety, efficiency, and long-term preparedness.
Key Takeaways
Market Growth: The power amplifier market is expected to reach USD 45.9 billion by 2034, growing at a robust CAGR of 12.3%, indicating strong market expansion.
Product Segment Dominance: The product segment is dominated by RF power amplifier, accounting for over 58% of the market share. The RF Power Amplifier segment is driven by TWTAs and SSPAs. TWTAs are ideal for high-power, broadband uses like satellite and radar due to their high-frequency efficiency. SSPAs offer compact, energy-efficient solutions for telecom and aerospace, making both crucial to advancing RF communications
Vertical Segment Insights: Consumer electronics are anticipated to hold the largest market share. The consumer electronics segment dominates the segment due to the high use of amplifiers in smartphones, tablets, and smart devices. Growing adoption of IoT and connected technology continues to boost demand, reinforcing the segment’s leadership.
Driver: The power amplifier market is growing fast, mainly because of the global rollout of 5G, which needs strong, reliable signal boosters. More people are using smart devices like phones, wearables, and home gadgets—all of which rely on amplifiers. The rise of electric vehicles and smart technologies in homes and industries also adds to the demand. Plus, new materials like GaN and GaAs are making amplifiers more efficient and powerful, helping them perform better in smaller spaces.
Restraint: The power amplifier market faces restraints like high power consumption, heat generation, complex design requirements, and supply chain disruptions. These challenges make production costly and limit adoption in some regions.
Opportunity: The power amplifier market has big opportunities in areas like 5G expansion, IoT growth, and electric vehicles. Emerging markets in Asia, Africa, and Latin America offer strong potential as telecom and tech infrastructure grows. There's also rising demand in defense, aerospace, and medical fields. Plus, advancements in GaN and GaAs semiconductors are opening doors for more powerful, energy-efficient designs.
Trend: Modern gadgets like smartphones, smartwatches, wireless earbuds, and smart TVs all depend on power amplifiers for features like better sound and stronger wireless signals. As more people use these devices daily, the market for compact and efficient amplifiers keeps growing.
Regional Analysis: The Asia-Pacific power amplifier market is growing rapidly, driven by the expansion of 5G networks, rising IoT adoption, and strong demand in consumer electronics and automotive sectors. Technological advancements in GaN and GaAs semiconductors are further boosting performance and efficiency across applications.
Product Analysis:
The product segment is divided into audio power amplifiers and RF power amplifiers. The RF power amplifiers segment dominated the market, with a market share of around 58% accounting for 7.9 billion 2024. The RF power amplifier segment is largely propelled by two key technologies: Traveling-Wave Tube Amplifiers (TWTAs) and Solid State Power Amplifiers (SSPAs). TWTAs are essential for applications that require high power output and wide bandwidth, making them a go-to choice for satellite communication, radar systems, and electronic warfare. Their ability to operate efficiently at very high frequencies with stable and robust performance makes them highly reliable in demanding environments. On the other hand, SSPAs offer benefits like compact size, energy efficiency, and long operational life, and are increasingly favored in commercial telecom, broadcasting, and aerospace systems. Together, these technologies drive innovation and meet the growing demand for high-speed, high-frequency communication systems across both defense and commercial sectors.
Vertical Analysis:
The vertical segment is divided into consumer electronics, industrial, telecommunication, automotive, military & defense, and others. The consumer electronics segment dominated the market, with a market share of around 24% accounting for 3.2 billion 2024. The consumer electronics segment leads the vertical segment due to the widespread use of devices like smartphones, tablets, and home entertainment systems, all of which rely on power amplifiers to improve audio and signal quality. The rapid growth of IoT and smart devices has further boosted this demand, as more products now require reliable, compact, and energy-efficient amplifiers to support advanced connectivity features. As technology continues to evolve and connected living becomes the norm, this segment is expected to maintain its strong position in the market.
Region Analysis:
Asia Pacific Leads With 34.8% Market Share in the Power Amplifier Market. Asia Pacific is really at the heart of the power amplifier market right now. Countries like China, Japan, South Korea, and India are leading the charge, mainly because they’re investing heavily in things like 5G networks, smart devices, and electric vehicles—all of which rely on power amplifiers to work efficiently. On top of that, the region is packed with manufacturers and tech innovators who are pushing the limits with next-gen semiconductor materials like gallium nitride (GaN), which make amplifiers more powerful and energy-efficient. What’s also driving the momentum is the huge growth in consumer electronics and IoT devices—everything from smartphones to smart home systems needs reliable amplification. With urban areas expanding, internet access improving, and a tech-savvy population demanding better, faster devices, Asia Pacific isn’t just growing—it’s shaping the future of the power amplifier industry. It’s safe to say this region will stay a global leader in the market for years to come.
Customization for segments, region/country-level will be provided. Moreover, additional customization can be done based on the requirements.
Pricing and Purchase Options
Avail customized purchase options to meet your exact research needs. We have three licenses to opt for: Single User License, Multi-User License (Up to 5 Users), Corporate Use License (Unlimited User and Printable PDF).
TABLE OF CONTENTS
1. EXECUTIVE SUMMARY
1.1. MARKET SNAPSHOT
1.2. KEY FINDINGS & INSIGHTS
1.3. ANALYST RECOMMENDATIONS
1.4. FUTURE OUTLOOK
2. RESEARCH METHODOLOGY
2.1. MARKET DEFINITION & SCOPE
2.2. RESEARCH OBJECTIVES: PRIMARY & SECONDARY DATA SOURCES
2.3. DATA COLLECTION SOURCES
2.3.1. COVERAGE OF 100+ PRIMARY RESEARCH/CONSULTATION CALLS WITH INDUSTRY STAKEHOLDERS
FIGURE 17 NORTH AMERICA POWER AMPLIFIER CURRENT AND FUTURE TYPE ANALYSIS, 2025–2034, (USD MILLION)
FIGURE 18 NORTH AMERICA POWER AMPLIFIER CURRENT AND FUTURE END USER ANALYSIS, 2025–2034, (USD MILLION)
FIGURE 19 MARKET SHARE BY COUNTRY
FIGURE 20 LATIN AMERICA POWER AMPLIFIER CURRENT AND FUTURE TYPE ANALYSIS, 2025–2034, (USD MILLION)
FIGURE 21 LATIN AMERICA POWER AMPLIFIER CURRENT AND FUTURE END USER ANALYSIS, 2025–2034, (USD MILLION)
FIGURE 22 MARKET SHARE BY COUNTRY
FIGURE 23 EASTERN EUROPE POWER AMPLIFIER CURRENT AND FUTURE TYPE ANALYSIS, 2025–2034, (USD MILLION)
FIGURE 24 EASTERN EUROPE POWER AMPLIFIER CURRENT AND FUTURE END USER ANALYSIS, 2025–2034, (USD MILLION)
FIGURE 25 MARKET SHARE BY COUNTRY
FIGURE 26 WESTERN EUROPE POWER AMPLIFIER CURRENT AND FUTURE TYPE ANALYSIS, 2025–2034, (USD MILLION)
FIGURE 27 WESTERN EUROPE POWER AMPLIFIER CURRENT AND FUTURE END USER ANALYSIS, 2025–2034, (USD MILLION)
FIGURE 28 MARKET SHARE BY COUNTRY
FIGURE 29 EAST ASIA AND PACIFIC POWER AMPLIFIER CURRENT AND FUTURE TYPE ANALYSIS, 2025–2034, (USD MILLION)
FIGURE 30 EAST ASIA AND PACIFIC POWER AMPLIFIER CURRENT AND FUTURE END USER ANALYSIS, 2025–2034, (USD MILLION)
FIGURE 31 MARKET SHARE BY COUNTRY
FIGURE 32 SEA AND SOUTH ASIA POWER AMPLIFIER CURRENT AND FUTURE TYPE ANALYSIS, 2025–2034, (USD MILLION)
FIGURE 33 SEA AND SOUTH ASIA POWER AMPLIFIER CURRENT AND FUTURE END USER ANALYSIS, 2025–2034, (USD MILLION)
FIGURE 34 MARKET SHARE BY COUNTRY
FIGURE 35 MIDDLE EAST AND AFRICA POWER AMPLIFIER CURRENT AND FUTURE TYPE ANALYSIS, 2025–2034, (USD MILLION)
FIGURE 36 MIDDLE EAST AND AFRICA POWER AMPLIFIER CURRENT AND FUTURE END USER ANALYSIS, 2025–2034, (USD MILLION)
FIGURE 37 NORTH AMERICA POWER AMPLIFIER CURRENT AND FUTURE MARKET VOLUME SHARE REGIONAL ANALYSIS, 2025–2034, (USD MILLION)
FIGURE 38 U.S. POWER AMPLIFIER CURRENT AND FUTURE TYPE ANALYSIS, 2025–2034, (USD MILLION)
FIGURE 39 U.S. POWER AMPLIFIER CURRENT AND FUTURE END USER ANALYSIS, 2025–2034, (USD MILLION)
FIGURE 40 CANADA POWER AMPLIFIER CURRENT AND FUTURE TYPE ANALYSIS, 2025–2034, (USD MILLION)
FIGURE 41 CANADA POWER AMPLIFIER CURRENT AND FUTURE END USER ANALYSIS, 2025–2034, (USD MILLION)
FIGURE 42 LATIN AMERICA POWER AMPLIFIER CURRENT AND FUTURE MARKET VOLUME SHARE REGIONAL ANALYSIS, 2025–2034, (USD MILLION)
FIGURE 43 MEXICO POWER AMPLIFIER CURRENT AND FUTURE TYPE ANALYSIS, 2025–2034, (USD MILLION)
FIGURE 44 MEXICO POWER AMPLIFIER CURRENT AND FUTURE END USER ANALYSIS, 2025–2034, (USD MILLION)
FIGURE 45 BRAZIL POWER AMPLIFIER CURRENT AND FUTURE TYPE ANALYSIS, 2025–2034, (USD MILLION)
FIGURE 46 BRAZIL POWER AMPLIFIER CURRENT AND FUTURE END USER ANALYSIS, 2025–2034, (USD MILLION)
FIGURE 47 ARGENTINA POWER AMPLIFIER CURRENT AND FUTURE TYPE ANALYSIS, 2025–2034, (USD MILLION)
FIGURE 48 ARGENTINA POWER AMPLIFIER CURRENT AND FUTURE END USER ANALYSIS, 2025–2034, (USD MILLION)
FIGURE 49 COLUMBIA POWER AMPLIFIER CURRENT AND FUTURE TYPE ANALYSIS, 2025–2034, (USD MILLION)
FIGURE 50 COLUMBIA POWER AMPLIFIER CURRENT AND FUTURE END USER ANALYSIS, 2025–2034, (USD MILLION)
FIGURE 51 REST OF LATIN AMERICA POWER AMPLIFIER CURRENT AND FUTURE TYPE ANALYSIS, 2025–2034, (USD MILLION)
FIGURE 52 REST OF LATIN AMERICA POWER AMPLIFIER CURRENT AND FUTURE END USER ANALYSIS, 2025–2034, (USD MILLION)
FIGURE 53 EASTERN EUROPE POWER AMPLIFIER CURRENT AND FUTURE MARKET VOLUME SHARE REGIONAL ANALYSIS, 2025–2034, (USD MILLION)
FIGURE 54 POLAND POWER AMPLIFIER CURRENT AND FUTURE TYPE ANALYSIS, 2025–2034, (USD MILLION)
FIGURE 55 POLAND POWER AMPLIFIER CURRENT AND FUTURE END USER ANALYSIS, 2025–2034, (USD MILLION)
FIGURE 56 RUSSIA POWER AMPLIFIER CURRENT AND FUTURE TYPE ANALYSIS, 2025–2034, (USD MILLION)
FIGURE 57 RUSSIA POWER AMPLIFIER CURRENT AND FUTURE END USER ANALYSIS, 2025–2034, (USD MILLION)
FIGURE 58 CZECH REPUBLIC POWER AMPLIFIER CURRENT AND FUTURE TYPE ANALYSIS, 2025–2034, (USD MILLION)
FIGURE 59 CZECH REPUBLIC POWER AMPLIFIER CURRENT AND FUTURE END USER ANALYSIS, 2025–2034, (USD MILLION)
FIGURE 60 ROMANIA POWER AMPLIFIER CURRENT AND FUTURE TYPE ANALYSIS, 2025–2034, (USD MILLION)
FIGURE 61 ROMANIA POWER AMPLIFIER CURRENT AND FUTURE END USER ANALYSIS, 2025–2034, (USD MILLION)
FIGURE 62 REST OF EASTERN EUROPE POWER AMPLIFIER CURRENT AND FUTURE TYPE ANALYSIS, 2025–2034, (USD MILLION)
FIGURE 63 REST OF EASTERN EUROPE POWER AMPLIFIER CURRENT AND FUTURE END USER ANALYSIS, 2025–2034, (USD MILLION)
FIGURE 64 WESTERN EUROPE POWER AMPLIFIER CURRENT AND FUTURE MARKET VOLUME SHARE REGIONAL ANALYSIS, 2025–2034, (USD MILLION)
FIGURE 65 GERMANY POWER AMPLIFIER CURRENT AND FUTURE TYPE ANALYSIS, 2025–2034, (USD MILLION)
FIGURE 66 GERMANY POWER AMPLIFIER CURRENT AND FUTURE END USER ANALYSIS, 2025–2034, (USD MILLION)
FIGURE 67 FRANCE POWER AMPLIFIER CURRENT AND FUTURE TYPE ANALYSIS, 2025–2034, (USD MILLION)
FIGURE 68 FRANCE POWER AMPLIFIER CURRENT AND FUTURE END USER ANALYSIS, 2025–2034, (USD MILLION)
FIGURE 69 UK POWER AMPLIFIER CURRENT AND FUTURE TYPE ANALYSIS, 2025–2034, (USD MILLION)
FIGURE 70 UK POWER AMPLIFIER CURRENT AND FUTURE END USER ANALYSIS, 2025–2034, (USD MILLION)
FIGURE 71 SPAIN POWER AMPLIFIER CURRENT AND FUTURE TYPE ANALYSIS, 2025–2034, (USD MILLION)
FIGURE 72 SPAIN POWER AMPLIFIER CURRENT AND FUTURE END USER ANALYSIS, 2025–2034, (USD MILLION)
FIGURE 73 ITALY POWER AMPLIFIER CURRENT AND FUTURE TYPE ANALYSIS, 2025–2034, (USD MILLION)
FIGURE 74 ITALY POWER AMPLIFIER CURRENT AND FUTURE END USER ANALYSIS, 2025–2034, (USD MILLION)
FIGURE 75 REST OF WESTERN EUROPE POWER AMPLIFIER CURRENT AND FUTURE TYPE ANALYSIS, 2025–2034, (USD MILLION)
FIGURE 76 REST OF WESTERN EUROPE POWER AMPLIFIER CURRENT AND FUTURE END USER ANALYSIS, 2025–2034, (USD MILLION)
FIGURE 77 EAST ASIA AND PACIFIC POWER AMPLIFIER CURRENT AND FUTURE MARKET VOLUME SHARE REGIONAL ANALYSIS, 2025–2034, (USD MILLION)
FIGURE 78 CHINA POWER AMPLIFIER CURRENT AND FUTURE TYPE ANALYSIS, 2025–2034, (USD MILLION)
FIGURE 79 CHINA POWER AMPLIFIER CURRENT AND FUTURE END USER ANALYSIS, 2025–2034, (USD MILLION)
FIGURE 80 JAPAN POWER AMPLIFIER CURRENT AND FUTURE TYPE ANALYSIS, 2025–2034, (USD MILLION)
FIGURE 81 JAPAN POWER AMPLIFIER CURRENT AND FUTURE END USER ANALYSIS, 2025–2034, (USD MILLION)
FIGURE 82 AUSTRALIA POWER AMPLIFIER CURRENT AND FUTURE TYPE ANALYSIS, 2025–2034, (USD MILLION)
FIGURE 83 AUSTRALIA POWER AMPLIFIER CURRENT AND FUTURE END USER ANALYSIS, 2025–2034, (USD MILLION)
FIGURE 84 CAMBODIA POWER AMPLIFIER CURRENT AND FUTURE TYPE ANALYSIS, 2025–2034, (USD MILLION)
FIGURE 85 CAMBODIA POWER AMPLIFIER CURRENT AND FUTURE END USER ANALYSIS, 2025–2034, (USD MILLION)
FIGURE 86 FIJI POWER AMPLIFIER CURRENT AND FUTURE TYPE ANALYSIS, 2025–2034, (USD MILLION)
FIGURE 87 FIJI POWER AMPLIFIER CURRENT AND FUTURE END USER ANALYSIS, 2025–2034, (USD MILLION)
FIGURE 88 INDONESIA POWER AMPLIFIER CURRENT AND FUTURE TYPE ANALYSIS, 2025–2034, (USD MILLION)
FIGURE 89 INDONESIA POWER AMPLIFIER CURRENT AND FUTURE END USER ANALYSIS, 2025–2034, (USD MILLION)
FIGURE 90 SOUTH KOREA POWER AMPLIFIER CURRENT AND FUTURE TYPE ANALYSIS, 2025–2034, (USD MILLION)
FIGURE 91 SOUTH KOREA POWER AMPLIFIER CURRENT AND FUTURE END USER ANALYSIS, 2025–2034, (USD MILLION)
FIGURE 92 REST OF EAST ASIA AND PACIFIC POWER AMPLIFIER CURRENT AND FUTURE TYPE ANALYSIS, 2025–2034, (USD MILLION)
FIGURE 93 REST OF EAST ASIA AND PACIFIC POWER AMPLIFIER CURRENT AND FUTURE END USER ANALYSIS, 2025–2034, (USD MILLION)
FIGURE 94 SEA AND SOUTH ASIA POWER AMPLIFIER CURRENT AND FUTURE MARKET VOLUME SHARE REGIONAL ANALYSIS, 2025–2034, (USD MILLION)
FIGURE 95 BANGLADESH POWER AMPLIFIER CURRENT AND FUTURE TYPE ANALYSIS, 2025–2034, (USD MILLION)
FIGURE 96 BANGLADESH POWER AMPLIFIER CURRENT AND FUTURE END USER ANALYSIS, 2025–2034, (USD MILLION)
FIGURE 97 NEW ZEALAND POWER AMPLIFIER CURRENT AND FUTURE TYPE ANALYSIS, 2025–2034, (USD MILLION)
FIGURE 98 NEW ZEALAND POWER AMPLIFIER CURRENT AND FUTURE END USER ANALYSIS, 2025–2034, (USD MILLION)
FIGURE 99 INDIA POWER AMPLIFIER CURRENT AND FUTURE TYPE ANALYSIS, 2025–2034, (USD MILLION)
FIGURE 100 INDIA POWER AMPLIFIER CURRENT AND FUTURE END USER ANALYSIS, 2025–2034, (USD MILLION)
FIGURE 101 SINGAPORE POWER AMPLIFIER CURRENT AND FUTURE TYPE ANALYSIS, 2025–2034, (USD MILLION)
FIGURE 102 SINGAPORE POWER AMPLIFIER CURRENT AND FUTURE END USER ANALYSIS, 2025–2034, (USD MILLION)
FIGURE 103 THAILAND POWER AMPLIFIER CURRENT AND FUTURE TYPE ANALYSIS, 2025–2034, (USD MILLION)
FIGURE 104 THAILAND POWER AMPLIFIER CURRENT AND FUTURE END USER ANALYSIS, 2025–2034, (USD MILLION)
FIGURE 105 TAIWAN POWER AMPLIFIER CURRENT AND FUTURE TYPE ANALYSIS, 2025–2034, (USD MILLION)
FIGURE 106 TAIWAN POWER AMPLIFIER CURRENT AND FUTURE END USER ANALYSIS, 2025–2034, (USD MILLION)
FIGURE 107 MALAYSIA POWER AMPLIFIER CURRENT AND FUTURE TYPE ANALYSIS, 2025–2034, (USD MILLION)
FIGURE 108 MALAYSIA POWER AMPLIFIER CURRENT AND FUTURE END USER ANALYSIS, 2025–2034, (USD MILLION)
FIGURE 109 REST OF SEA AND SOUTH ASIA POWER AMPLIFIER CURRENT AND FUTURE TYPE ANALYSIS, 2025–2034, (USD MILLION)
FIGURE 110 REST OF SEA AND SOUTH ASIA POWER AMPLIFIER CURRENT AND FUTURE END USER ANALYSIS, 2025–2034, (USD MILLION)
FIGURE 111 MIDDLE EAST AND AFRICA POWER AMPLIFIER CURRENT AND FUTURE MARKET VOLUME SHARE REGIONAL ANALYSIS, 2025–2034, (USD MILLION)
FIGURE 112 GCC COUNTRIES POWER AMPLIFIER CURRENT AND FUTURE TYPE ANALYSIS, 2025–2034, (USD MILLION)
FIGURE 113 GCC COUNTRIES POWER AMPLIFIER CURRENT AND FUTURE END USER ANALYSIS, 2025–2034, (USD MILLION)
FIGURE 114 SAUDI ARABIA POWER AMPLIFIER CURRENT AND FUTURE TYPE ANALYSIS, 2025–2034, (USD MILLION)
FIGURE 115 SAUDI ARABIA POWER AMPLIFIER CURRENT AND FUTURE END USER ANALYSIS, 2025–2034, (USD MILLION)
FIGURE 116 UAE POWER AMPLIFIER CURRENT AND FUTURE TYPE ANALYSIS, 2025–2034, (USD MILLION)
FIGURE 117 UAE POWER AMPLIFIER CURRENT AND FUTURE END USER ANALYSIS, 2025–2034, (USD MILLION)
FIGURE 118 BAHRAIN POWER AMPLIFIER CURRENT AND FUTURE TYPE ANALYSIS, 2025–2034, (USD MILLION)
FIGURE 119 BAHRAIN POWER AMPLIFIER CURRENT AND FUTURE END USER ANALYSIS, 2025–2034, (USD MILLION)
FIGURE 120 KUWAIT POWER AMPLIFIER CURRENT AND FUTURE TYPE ANALYSIS, 2025–2034, (USD MILLION)
FIGURE 121 KUWAIT POWER AMPLIFIER CURRENT AND FUTURE END USER ANALYSIS, 2025–2034, (USD MILLION)
FIGURE 122 OMAN POWER AMPLIFIER CURRENT AND FUTURE TYPE ANALYSIS, 2025–2034, (USD MILLION)
FIGURE 123 OMAN POWER AMPLIFIER CURRENT AND FUTURE END USER ANALYSIS, 2025–2034, (USD MILLION)
FIGURE 124 QATAR POWER AMPLIFIER CURRENT AND FUTURE TYPE ANALYSIS, 2025–2034, (USD MILLION)
FIGURE 125 QATAR POWER AMPLIFIER CURRENT AND FUTURE END USER ANALYSIS, 2025–2034, (USD MILLION)
FIGURE 126 EGYPT POWER AMPLIFIER CURRENT AND FUTURE TYPE ANALYSIS, 2025–2034, (USD MILLION)
FIGURE 127 EGYPT POWER AMPLIFIER CURRENT AND FUTURE END USER ANALYSIS, 2025–2034, (USD MILLION)
FIGURE 128 NIGERIA POWER AMPLIFIER CURRENT AND FUTURE TYPE ANALYSIS, 2025–2034, (USD MILLION)
FIGURE 129 NIGERIA POWER AMPLIFIER CURRENT AND FUTURE END USER ANALYSIS, 2025–2034, (USD MILLION)
FIGURE 130 SOUTH AFRICA POWER AMPLIFIER CURRENT AND FUTURE TYPE ANALYSIS, 2025–2034, (USD MILLION)
FIGURE 131 SOUTH AFRICA POWER AMPLIFIER CURRENT AND FUTURE END USER ANALYSIS, 2025–2034, (USD MILLION)
FIGURE 132 ISRAEL POWER AMPLIFIER CURRENT AND FUTURE TYPE ANALYSIS, 2025–2034, (USD MILLION)
FIGURE 133 ISRAEL POWER AMPLIFIER CURRENT AND FUTURE END USER ANALYSIS, 2025–2034, (USD MILLION)
FIGURE 134 REST OF MEA POWER AMPLIFIER CURRENT AND FUTURE TYPE ANALYSIS, 2025–2034, (USD MILLION)
FIGURE 135 REST OF MEA POWER AMPLIFIER CURRENT AND FUTURE END USER ANALYSIS, 2025–2034, (USD MILLION)
FIGURE 136 U. S. MARKET SHARE ANALYSIS BY TYPE (2024)
FIGURE 137 U. S. MARKET SHARE ANALYSIS BY END USER (2024)
FIGURE 138 CANADA MARKET SHARE ANALYSIS BY TYPE (2024)
FIGURE 139 CANADA MARKET SHARE ANALYSIS BY END USER (2024)
FIGURE 140 MEXICO MARKET SHARE ANALYSIS BY TYPE (2024)
FIGURE 141 MEXICO MARKET SHARE ANALYSIS BY END USER (2024)
FIGURE 142 CHINA MARKET SHARE ANALYSIS BY TYPE (2024)
FIGURE 143 CHINA MARKET SHARE ANALYSIS BY END USER (2024)
FIGURE 144 JAPAN MARKET SHARE ANALYSIS BY TYPE (2024)
FIGURE 145 JAPAN MARKET SHARE ANALYSIS BY END USER (2024)
FIGURE 146 INDIA MARKET SHARE ANALYSIS BY TYPE (2024)
FIGURE 147 INDIA MARKET SHARE ANALYSIS BY END USER (2024)
FIGURE 148 SOUTH KOREA MARKET SHARE ANALYSIS BY TYPE (2024)
FIGURE 149 SOUTH KOREA MARKET SHARE ANALYSIS BY END USER (2024)
FIGURE 150 SAUDI ARABIA MARKET SHARE ANALYSIS BY TYPE (2024)
FIGURE 151 SAUDI ARABIA MARKET SHARE ANALYSIS BY END USER (2024)
FIGURE 152 UAE MARKET SHARE ANALYSIS BY TYPE (2024)
FIGURE 153 UAE MARKET SHARE ANALYSIS BY END USER (2024)
FIGURE 154 EGYPT MARKET SHARE ANALYSIS BY TYPE (2024)
FIGURE 155 EGYPT MARKET SHARE ANALYSIS BY END USER (2024)
FIGURE 156 NIGERIA MARKET SHARE ANALYSIS BY TYPE (2024)
FIGURE 157 NIGERIA MARKET SHARE ANALYSIS BY END USER (2024)
FIGURE 158 SOUTH AFRICA MARKET SHARE ANALYSIS BY TYPE (2024)
FIGURE 159 SOUTH AFRICA MARKET SHARE ANALYSIS BY END USER (2024)
FIGURE 160 GERMANY MARKET SHARE ANALYSIS BY TYPE (2024)
FIGURE 161 GERMANY MARKET SHARE ANALYSIS BY END USER (2024)
FIGURE 162 FRANCE MARKET SHARE ANALYSIS BY TYPE (2024)
FIGURE 163 FRANCE MARKET SHARE ANALYSIS BY END USER (2024)
FIGURE 164 UK MARKET SHARE ANALYSIS BY TYPE (2024)
FIGURE 165 UK MARKET SHARE ANALYSIS BY END USER (2024)
FIGURE 166 SPAIN MARKET SHARE ANALYSIS BY TYPE (2024)
FIGURE 167 SPAIN MARKET SHARE ANALYSIS BY END USER (2024)
FIGURE 168 ITALY MARKET SHARE ANALYSIS BY TYPE (2024)
FIGURE 169 ITALY MARKET SHARE ANALYSIS BY END USER (2024)
FIGURE 170 BRAZIL MARKET SHARE ANALYSIS BY TYPE (2024)
FIGURE 171 BRAZIL MARKET SHARE ANALYSIS BY END USER (2024)
FIGURE 172 ARGENTINA MARKET SHARE ANALYSIS BY TYPE (2024)
FIGURE 173 ARGENTINA MARKET SHARE ANALYSIS BY END USER (2024)
FIGURE 174 COLUMBIA MARKET SHARE ANALYSIS BY TYPE (2024)
FIGURE 175 COLUMBIA MARKET SHARE ANALYSIS BY END USER (2024)
FIGURE 176 GLOBAL POWER AMPLIFIER CURRENT AND FUTURE MARKET KEY COUNTRY LEVEL ANALYSIS, 2024–2034, (USD MILLION)
FIGURE 177 FINANCIAL OVERVIEW:
Key Players Analysis:
Qualcomm: Best known for its leadership in 5G technology and mobile chipsets, Qualcomm integrates high-performance RF power amplifiers into its Snapdragon SoCs (System-on-Chip), which power a vast number of smartphones and connected devices worldwide. Qualcomm’s power amplifiers are designed to support multi-band, high-speed data transmission, which is essential for 5G, LTE, Wi-Fi, and Bluetooth connectivity. The company focuses heavily on creating compact, highly efficient RF front-end (RFFE) modules that combine power amplifiers with filters, switches, and tuners. These modules are optimized for low power consumption, signal integrity, and thermal efficiency, helping manufacturers reduce space and battery drain in devices.
Toshiba: Toshiba offers a range of power amplifier solutions, particularly focusing on radio frequency (RF) and audio amplifiers, catering to applications in consumer electronics, automotive, industrial equipment, and communication systems. Toshiba’s power amplifiers are valued for their high reliability, low distortion, and efficient thermal performance, making them suitable for high-frequency and high-power applications. In the automotive industry, Toshiba provides power amplifiers for in-vehicle infotainment and safety systems, supporting the growing demand for electronics in electric and connected vehicles. In consumer electronics, their amplifiers are used in audio systems, home appliances, and portable devices, where compact size and energy efficiency are crucial.
Texas Instruments: In the power amplifier space, Texas Instruments focuses heavily on energy efficiency, integration, and precision. Their amplifiers are designed to offer low power consumption, high signal integrity, and compact designs, which are ideal for modern devices that demand both performance and size optimization. For example, in the automotive sector, TI amplifiers are used in infotainment systems and advanced driver-assistance systems (ADAS), while in consumer electronics, their amplifiers power everything from smart speakers to wearables.
Market Key Players
Texas Instruments
Toshiba
Maxim Integrated
Qorvo
Analog Devices
QSC Audio Products
Qualcomm
Bonn Elektronik
ETL System
Broadcom
STMicroelectronics
Yamaha
NXP Semiconductors
Skyworks
Peavey Electronics
Macom
Renesas Electronics
Ophir RF
Driver:
Rapid Expansion of 5G Networks
The deployment of 5G technology worldwide is a major growth engine for the power amplifier market. Power amplifiers are critical for boosting radio signals in both base stations and mobile devices, enabling fast and stable data transmission. 5G requires a denser network of smaller cell sites, each needing compact, high-performance amplifiers. This trend is expected to continue as telecom providers expand 5G infrastructure to more urban and rural areas.
Internet of Things (IoT) Adoption
IoT devices—from smart thermostats and security systems to wearable health monitors and industrial sensors—all need wireless communication. Power amplifiers play a key role in transmitting these signals reliably. With the IoT ecosystem growing rapidly across homes, businesses, agriculture, and smart cities, the demand for low-power, high-frequency amplifiers is rising significantly.
Restrain:
High power consumption and heat generation
Despite strong growth, the power amplifier market faces a few roadblocks. One major issue is high power consumption and heat generation, which can lead to overheating and reduce efficiency. Designing amplifiers that are both powerful and energy-efficient is technically challenging and can increase production costs. Complex manufacturing processes and miniaturization demands also make it tough for smaller players to keep up. On top of that, supply chain disruptions, especially for advanced semiconductors, can delay production and impact availability. These factors can slow down market growth, especially in price-sensitive regions.
Opportunities:
Rising demand of electric vehicles (EVs)
Another major opportunity lies in the rise of electric vehicles (EVs) and autonomous cars. These vehicles depend heavily on electronic systems for communication, navigation, and safety features—all of which require power amplifiers. In addition, emerging markets in regions like Asia-Pacific, Africa, and Latin America are investing in telecom and industrial infrastructure, creating fresh demand for amplifier technologies. The defense and aerospace sectors also offer strong growth potential, as they require high-performance amplifiers for radar, communication, and navigation systems. Finally, continued innovation in semiconductor materials, especially Gallium Nitride (GaN) and Gallium Arsenide (GaAs), is enabling the development of smaller, faster, and more energy-efficient amplifiers—opening up new use cases across industries.
Trends:
Surging Demand for RF Power Amplifiers
The power amplifier market is undergoing significant transformation, driven by key industry trends. One major trend is the growing demand for RF power amplifiers, fueled by the global expansion of 5G networks and the increasing reliance on wireless communication. As devices like smartphones, base stations, and routers require stable and powerful signals, RF amplifiers have become essential. Another important development is the shift toward advanced semiconductor materials like Gallium Nitride (GaN) and Gallium Arsenide (GaAs), which enable amplifiers to deliver higher power efficiency and operate at higher frequencies compared to traditional silicon-based components. In consumer electronics, the widespread use of smart devices such as phones, smartwatches, and home entertainment systems has significantly increased the need for compact, energy-efficient amplifiers that enhance performance without draining battery life.
Recent Development
In January 2024, Qorvo signed a binding deal to purchase Anokiwave, a supplier of high-performance silicon integrated circuits for intelligent active array antennas used in defence, SATCOM, and 5G applications.
In June 2024, Analogue Devices introduced the ADPA1116, a gallium nitride (GaN) power amplifier that operates between 0.3 GHz and 6 GHz, boosting RF and microwave applications.
In September 2024, MACOM showcased their varied product line, which included a 300W X-band GaN-on-SiC matched power amplifier designed for pulsed radar applications such as maritime, defense, and weather radar.