
- Home
- Industries
 Aerospace And Defence
 Agriculture
 Automotive And Transportation
 Banking And Finance
 Business
 Chemicals And Materials
 Consumer And Retail
 Electronics And Semiconductors
 Food And Beverages
 Machinery & Equipments
 Manufacturing And Construction
 Medical Devices
 Others
 Pharmaceuticals And Healthcare
 Power And Energy
 Sports
 Technology
- Services
- News Room
- About us
- Contact Us
-
Power Semiconductor Market Size, Growth Trends & Forecast | CAGR 6.5%
Global Power Semiconductor Market Size, Share & Technology Analysis By Material (Silicon, SiC, GaN), By Device Type (MOSFETs, IGBTs, Diodes), By Application (EVs, Renewable Energy, Industrial Automation, Consumer Electronics), Energy Efficiency Regulations, Supply Chain Trends, Key Players & Forecast 2025–2034

Report Overview
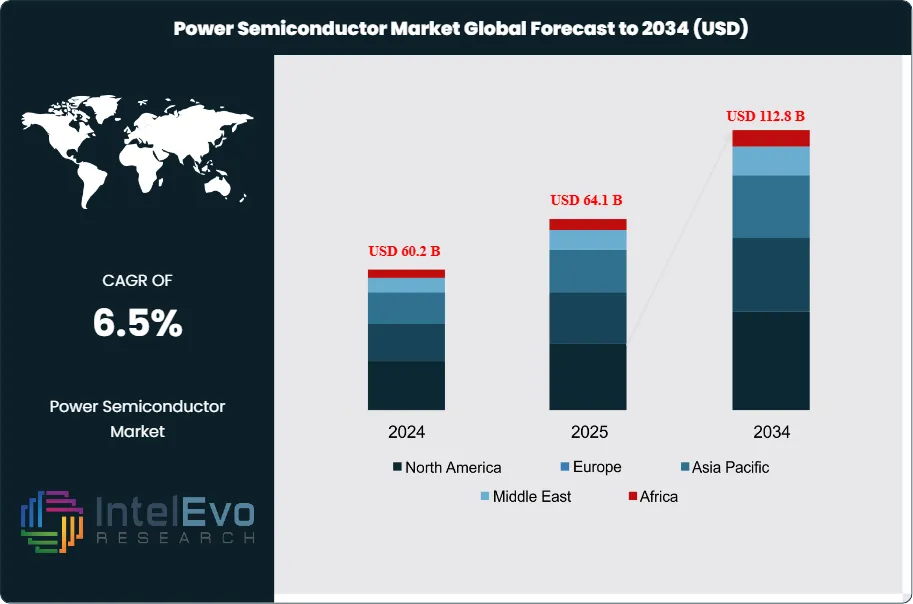
The Power Semiconductor Market is estimated at USD 60.2 billion in 2024 and is projected to reach approximately USD 112.8 billion by 2034, registering a compound annual growth rate (CAGR) of 6.5% over 2025–2034. This growth trajectory is being driven by accelerating electrification across automotive, industrial automation, and renewable energy systems. Rising adoption of electric vehicles, fast-charging infrastructure, and energy-efficient power management solutions is significantly increasing demand for power MOSFETs, IGBTs, and wide-bandgap semiconductors such as SiC and GaN. In parallel, government-led decarbonization initiatives and investments in smart grids are reinforcing long-term market momentum, positioning power semiconductors as a critical enabler of next-generation energy and mobility ecosystems.
Get More Information about this report -
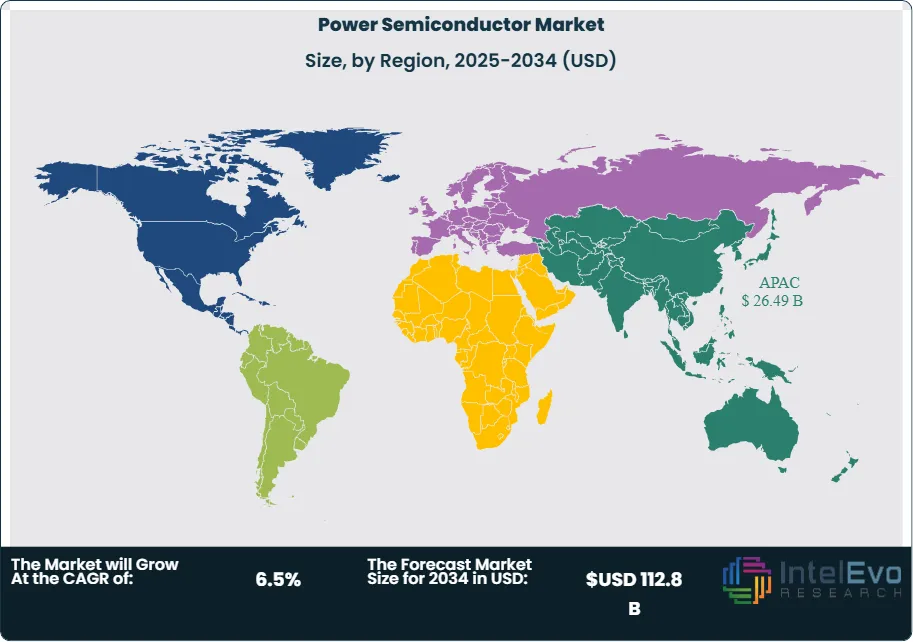
Request Free Sample ReportThe market has expanded steadily over the past decade, supported by rising demand for efficient power management across industries. In 2023, Asia Pacific accounted for 45.3% of global revenue, valued at USD 24.46 billion, underscoring the region’s dominance in both manufacturing capacity and consumption. This trajectory reflects a structural shift in global energy and mobility systems, where power semiconductors are becoming indispensable to industrial, automotive, and renewable energy applications.
The market’s growth is anchored in several demand-side drivers. The transition to electric vehicles is accelerating adoption, as each EV requires advanced semiconductor modules to manage high voltages and currents. Renewable energy integration, particularly solar and wind, is also expanding the need for efficient conversion and grid stabilization technologies. On the supply side, manufacturers are scaling production of silicon carbide (SiC) and gallium nitride (GaN) devices, which outperform traditional silicon in high-temperature and high-voltage environments. These materials are expected to capture a growing share of the market, with SiC devices alone projected to grow at double-digit rates through the forecast horizon.
Challenges remain, particularly in supply chain resilience and capital intensity. Semiconductor fabrication requires significant upfront investment, and geopolitical risks continue to influence sourcing strategies. However, governments are responding with policy support and incentives. India’s planned semiconductor fabrication facility in Dholera, with an investment of approximately USD 11 billion, illustrates how national strategies are reshaping the global supply base.
Technological advances are reinforcing adoption. Approximately 30% of electricity consumed in the United States already flows through power electronic devices, highlighting their central role in energy efficiency. Digitalization, automation, and AI-driven design tools are further improving device performance and accelerating time-to-market.
Regionally, Asia Pacific remains the largest and fastest-growing hub, driven by strong demand from China, Japan, and South Korea. North America and Europe are also critical markets, supported by EV adoption, renewable energy targets, and government-backed semiconductor initiatives. Emerging economies in Southeast Asia and the Middle East are beginning to attract investment as industrial electrification and renewable projects scale.
For investors, the market presents opportunities in advanced materials, fabrication capacity, and regional expansion. With energy efficiency and electrification at the forefront of global priorities, power semiconductors are positioned as a cornerstone of long-term industrial and technological growth.
, By Device Type (MOSFETs, IGBTs, Diodes), By Application (EVs, Renewable Energy, Industrial Automation, Consumer Electronics), Energy Efficiency Regulations, Supply Chain Trends, Key Players & Forecast 2025–2034")
Key Takeaways
- Market Growth: The global power semiconductor market was valued at USD 60.2 billion in 2024 and is projected to reach USD 112.8 billion by 2034, expanding at a CAGR of 6.5% from 2025 to 2034. Growth is driven by rising demand for energy-efficient electronics, electric vehicles, and renewable energy integration.
- Component: Discrete power semiconductors accounted for 64.5% of total revenue in 2023. Their dominance reflects widespread use in consumer devices, automotive systems, and industrial equipment where cost efficiency and reliability are critical.
- Material: Silicon carbide (SiC) devices captured 68.1% of the material segment in 2023. Their superior performance in high-voltage and high-temperature applications is accelerating adoption across EV inverters, charging infrastructure, and renewable energy systems.
- End Use: Consumer electronics represented 28.0% of global demand in 2023. Smartphones, laptops, and household appliances continue to drive high-volume consumption, supported by rising global shipments and demand for compact, energy-efficient devices.
- Driver: The rapid shift toward electric mobility is a key growth catalyst. Global EV sales surpassed 14 million units in 2023, each requiring advanced semiconductor modules for efficient power conversion and battery management.
- Restraint: High capital intensity and supply chain risks remain significant barriers. Semiconductor fabrication facilities require multi-billion-dollar investments, and geopolitical tensions continue to disrupt raw material sourcing and equipment supply.
- Opportunity: Wide-bandgap materials such as SiC and gallium nitride (GaN) present strong growth potential. The SiC device market alone is projected to grow at over 20% CAGR through 2030, creating opportunities for manufacturers and investors targeting high-performance applications.
- Trend: Strategic investments in domestic semiconductor manufacturing are reshaping the industry. India’s planned USD 11 billion fabrication unit in Gujarat aims to expand capacity for power management chips and reduce import dependency, signaling a shift in global supply dynamics.
- Regional Analysis: Asia Pacific led with 45.3% of global revenue in 2023, valued at USD 24.46 billion, supported by strong demand from China, Japan, and South Korea. North America and Europe are expected to post steady growth, driven by EV adoption and renewable energy targets, while Southeast Asia and the Middle East are emerging as new investment destinations.
Component Analysis
As of 2025, discrete power semiconductors continue to dominate the component landscape, accounting for more than 63% of global revenue. Their widespread use in automotive, consumer electronics, and industrial systems reflects their reliability in handling high voltages and currents with minimal energy loss. Discrete devices remain the preferred choice in applications where cost efficiency and durability are critical, particularly in electric vehicles and industrial automation.
Power ICs and modules are gaining traction as integrated solutions that combine multiple functions into compact packages. These products improve energy efficiency and reduce system complexity, making them increasingly attractive for advanced electronics and renewable energy systems. However, discrete devices retain their leadership due to their versatility and proven performance across diverse applications.
Looking ahead, demand for discrete components is expected to remain strong, supported by rising electrification trends and the expansion of renewable energy infrastructure. At the same time, ICs and modules are projected to grow at faster rates, driven by the need for compact, high-performance solutions in data centers, 5G networks, and EV charging infrastructure.
Material Analysis
Silicon carbide (SiC) has emerged as the dominant material in 2025, holding more than two-thirds of the market share. Its ability to operate at higher voltages, temperatures, and switching frequencies makes it indispensable in electric vehicles, renewable energy inverters, and industrial power supplies. The global SiC market is projected to expand at a CAGR exceeding 20% through 2030, supported by large-scale adoption in EV drivetrains and charging systems.
Gallium nitride (GaN) is also gaining momentum, particularly in high-frequency and high-efficiency applications such as fast chargers, telecom power supplies, and aerospace systems. Its superior electron mobility enables smaller, lighter, and more efficient devices, making it a strong competitor in segments where size and efficiency are critical. Silicon and silicon-germanium remain relevant for cost-sensitive applications, particularly in consumer electronics and legacy industrial systems.
The shift toward wide-bandgap materials reflects the industry’s focus on energy efficiency and performance. With governments and manufacturers investing heavily in EV and renewable energy ecosystems, SiC and GaN are expected to capture a growing share of the market, gradually reducing reliance on traditional silicon-based devices.
End-Use Industry Analysis
Consumer electronics remain the largest end-use segment in 2025, accounting for more than 27% of global demand. Smartphones, laptops, and smart appliances continue to drive consumption, with manufacturers prioritizing power semiconductors that extend battery life and enable device miniaturization. The rapid adoption of 5G-enabled devices and connected home solutions further supports this segment’s growth.
The automotive sector is expanding at the fastest pace, fueled by the global shift toward electric and hybrid vehicles. Each EV requires advanced semiconductor modules for battery management, inverters, and charging systems, making automotive one of the most lucrative growth areas. Industrial applications also represent a significant share, with automation, robotics, and renewable energy integration driving demand for high-performance power devices.
Aerospace and defense, along with IT and telecommunications, are adopting advanced semiconductors to support mission-critical systems and high-speed communication networks. These industries require components that deliver both efficiency and reliability under demanding conditions, reinforcing the strategic importance of power semiconductors across multiple sectors.
Regional Analysis
Asia Pacific remains the largest regional market in 2025, contributing more than 44% of global revenue. China, Japan, and South Korea lead in both production and consumption, supported by strong EV adoption, large-scale renewable energy projects, and robust consumer electronics manufacturing. India is emerging as a key growth hub, with government-backed investments in semiconductor fabrication and renewable energy infrastructure.
North America holds a significant share, driven by advanced automotive technologies, renewable energy targets, and strong demand from data centers. The United States is investing heavily in domestic semiconductor manufacturing to reduce import dependency and strengthen supply chain resilience. Europe follows closely, supported by stringent energy efficiency regulations and ambitious climate goals that accelerate adoption of high-efficiency power devices.
Latin America and the Middle East & Africa are smaller but growing markets. Industrialization, digital transformation, and renewable energy projects are creating new opportunities for power semiconductor adoption. These regions are expected to post steady growth through 2030 as infrastructure development and electrification initiatives expand.
Get More Information about this report -
Request Free Sample ReportKey Market Segments
By Component
- Discrete
- Power ICs (Integrated Circuits)
- Module
By Material
- Silicon Carbide
- Gallium Nitride
- Silicon/Germanium
By End-Use Industry
- Consumer Electronics
- Automotive
- IT and Telecommunications
- Aerospace and Defense
- Industrial
- Other End-Use Industries
Regions
- North America
- Latin America
- East Asia And Pacific
- Sea And South Asia
- Eastern Europe
- Western Europe
- Middle East & Africa
| Report Attribute | Details |
| Market size (2024) | USD 60.2 B |
| Forecast Revenue (2034) | USD 112.8 B |
| CAGR (2024-2034) | 6.5% |
| Historical data | 2020-2023 |
| Base Year For Estimation | 2024 |
| Forecast Period | 2025-2034 |
| Report coverage | Revenue Forecast, Competitive Landscape, Market Dynamics, Growth Factors, Trends and Recent Developments |
| Segments covered | By Component (Discrete, Power ICs (Integrated Circuits), Module), By Material (Silicon Carbide, Gallium Nitride, Silicon/Germanium), By End-Use Industry (Consumer Electronics, Automotive, IT and Telecommunications, Aerospace and Defense, Industrial, Other End-Use Industries) |
| Research Methodology |
|
| Regional scope |
|
| Competitive Landscape | Market Key Players, Mitsubishi Electric Corporation, Texas Instruments Incorporated, ROHM Co., Ltd., Infineon Technologies AG, Toshiba Corporation, Analog Devices, Inc., Fuji Electric Co., Ltd., NXP Semiconductors N.V., STMicroelectronics NV, onsemi, Other Key Players |
| Customization Scope | Customization for segments, region/country-level will be provided. Moreover, additional customization can be done based on the requirements. |
| Pricing and Purchase Options | Avail customized purchase options to meet your exact research needs. We have three licenses to opt for: Single User License, Multi-User License (Up to 5 Users), Corporate Use License (Unlimited User and Printable PDF). |
, By Device Type (MOSFETs, IGBTs, Diodes), By Application (EVs, Renewable Energy, Industrial Automation, Consumer Electronics), Energy Efficiency Regulations, Supply Chain Trends, Key Players & Forecast 2025–2034")
, By Device Type (MOSFETs, IGBTs, Diodes), By Application (EVs, Renewable Energy, Industrial Automation, Consumer Electronics), Energy Efficiency Regulations, Supply Chain Trends, Key Players & Forecast 2025–2034")
, By Device Type (MOSFETs, IGBTs, Diodes), By Application (EVs, Renewable Energy, Industrial Automation, Consumer Electronics), Energy Efficiency Regulations, Supply Chain Trends, Key Players & Forecast 2025–2034")
Frequently Asked Questions
How big is the Power Semiconductor Market?
The global power semiconductor market was valued at USD 60.2 billion in 2024 and is projected to reach USD 112.8 billion by 2034, growing at a 6.5% CAGR. Rising EV adoption, renewable energy expansion, and demand for energy-efficient power management are driving long-term market growth.
Who are the major players in the Power Semiconductor Market?
Market Key Players, Mitsubishi Electric Corporation, Texas Instruments Incorporated, ROHM Co., Ltd., Infineon Technologies AG, Toshiba Corporation, Analog Devices, Inc., Fuji Electric Co., Ltd., NXP Semiconductors N.V., STMicroelectronics NV, onsemi, Other Key Players
Which segments covered the Power Semiconductor Market?
By Component (Discrete, Power ICs (Integrated Circuits), Module), By Material (Silicon Carbide, Gallium Nitride, Silicon/Germanium), By End-Use Industry (Consumer Electronics, Automotive, IT and Telecommunications, Aerospace and Defense, Industrial, Other End-Use Industries)
How can this market research report help my business make strategic decisions?
Our market research reports provide actionable intelligence, including verified market size data, CAGR projections, competitive benchmarking, and segment-level opportunity analysis. These insights support strategic planning, investment decisions, product development, and market entry strategies for enterprises and startups alike.
How frequently is the data updated?
We continuously monitor industry developments and update our reports to reflect regulatory changes, technological advancements, and macroeconomic shifts. Updated editions ensure you receive the latest market intelligence.

Select Licence Type
Connect with our sales team
Why IntelEvoResearch
100%
Customer
Satisfaction
24x7+
Availability - we are always
there when you need us
200+
Fortune 50 Companies trust
IntelEvoResearch
80%
of our reports are exclusive
and first in the industry
100%
more data
and analysis
1000+
reports published
till date
