
- Home
- Industries
 Aerospace And Defence
 Agriculture
 Automotive And Transportation
 Banking And Finance
 Business
 Chemicals And Materials
 Consumer And Retail
 Electronics And Semiconductors
 Food And Beverages
 Machinery & Equipments
 Manufacturing And Construction
 Medical Devices
 Others
 Pharmaceuticals And Healthcare
 Power And Energy
 Sports
 Technology
- Services
- News Room
- About us
- Contact Us
-
Predictive AI in Stock Market: $18.7B by 2034 with 19.5% CAGR!
Global Predictive AI in Stock Market Size, Share, Analysis Report By Type (Algorithmic Trading Platforms, AI Portfolio Management, Sentiment Analysis Tools, Alternative Data Analytics, Risk Management Systems) Platform (Cloud-Based AI, On-Premises, Hybrid) End-User (Institutional Investors, Retail Investors, Financial Advisory Firms) Industry Region & Key Players-Industry Segment Overview, Market Dynamics, Competitive Strategies, Trends & Forecast 2025-2034

Report Overview
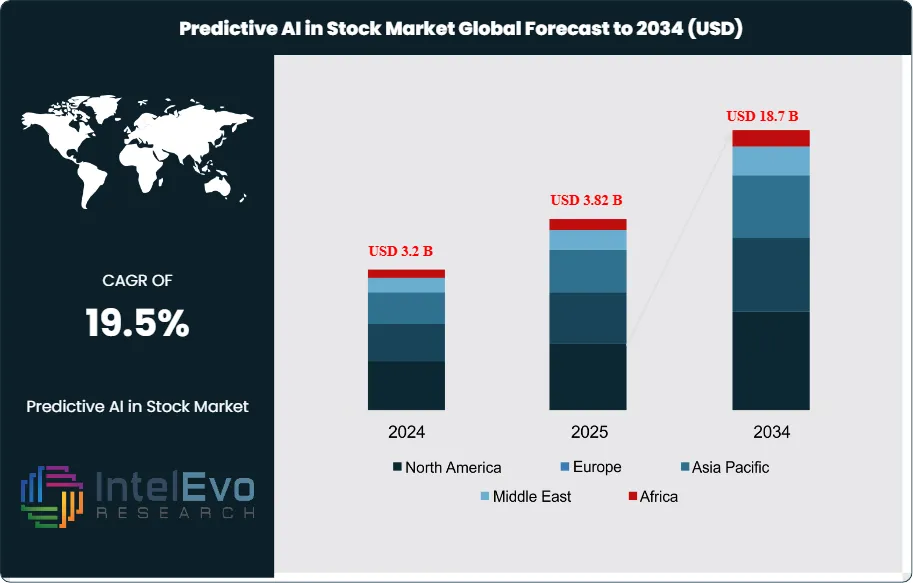
The Predictive AI in Stock Market size is projected to reach approximately USD 18.7 billion by 2034, rising from USD 3.2 billion in 2024, and expanding at a CAGR of 19.5% during the forecast period from 2024 to 2034. This rapid growth is driven by increasing adoption of machine learning models, quantitative trading strategies, and real-time data analytics by hedge funds, asset managers, and retail investors. Advancements in big data processing, alternative data usage, and AI-driven risk management tools are further enhancing market forecasting accuracy, positioning predictive AI as a critical enabler of next-generation algorithmic and data-driven investment strategies worldwide.
Get More Information about this report -
Request Free Sample ReportPredictive AI in the stock market represents the cutting edge of financial technology, utilizing advanced artificial intelligence and machine learning algorithms to anticipate stock prices, market trends, and trading opportunities. This dynamic market includes a broad spectrum of solutions such as algorithmic trading platforms, sentiment analysis tools, risk management systems, and portfolio optimization engines. The sector’s rapid growth is fueled by the explosion of big data, ongoing advancements in deep learning and natural language processing, and a rising demand for automated, data-driven investment strategies among both institutional and retail investors. By integrating AI, traders and asset managers can analyze vast datasets in real time—including historical prices, financial news, social media sentiment, and macroeconomic indicators—gaining actionable insights and a significant competitive edge.
The ecosystem supporting predictive AI in the stock market is evolving at a remarkable pace, shaped by technological breakthroughs in cloud computing, quantum computing, and edge analytics. These innovations enable faster data processing, more sophisticated modeling, and the ability to deploy AI solutions at scale. The proliferation of alternative data sources, such as satellite imagery and IoT signals, further enhances the predictive power of AI models, allowing for deeper and more nuanced market analysis. As a result, AI-driven tools are becoming increasingly indispensable for modern investment decision-making.
Regulatory support for fintech innovation, the democratization of trading platforms, and the rise of robo-advisors are also accelerating the adoption of AI in the financial sector. These trends are making advanced investment tools accessible to a broader range of users, from large asset managers to individual retail investors. The COVID-19 pandemic further underscored the importance of agile, automated trading systems, as heightened market volatility and the shift to remote work increased reliance on digital solutions for portfolio management and risk mitigation.
Predictive AI is transforming the stock market by enabling real-time, data-driven decision-making and opening new frontiers in financial analysis. As technology continues to advance and alternative data becomes more integrated, the role of AI in investment strategy is set to grow even more prominent, shaping the future of global financial markets.
 Platform (Cloud-Based AI, On-Premises, Hybrid) End-User (Institutional Investors, Retail Investors, Financial Advisory Firms) Industry Region & Key Players-Industry Segment Overview, Market Dynamics, Competitive Strategies, Trends & Forecast 2025-2034")
Key Takeaways
- Market Growth: The Predictive AI in Stock Market sector is expected to reach USD 18.7 Billion by 2034, as financial institutions and individual investors increasingly adopt AI-powered tools for forecasting, trading, and risk management. The convergence of big data analytics, cloud infrastructure, and advanced machine learning is fueling sustained growth across global markets.
- Type Dominance: Algorithmic trading platforms and AI-powered portfolio management solutions dominate the market, accounting for over 60% share in 2024, due to their ability to deliver high-frequency, data-driven trading decisions and optimize investment returns.
- Platform Dominance: Cloud-based AI platforms hold the largest share, with over 55% of deployments, as they offer scalability, real-time data processing, and seamless integration with trading systems and data feeds.
- End-User Industry Dominance: Institutional investors, including hedge funds, asset managers, and proprietary trading firms, represent 48% of the market in 2024, followed by retail investors (28%) and financial advisory firms (15%).
- Driver: The surge in market data volume, the need for real-time decision-making, and the quest for alpha generation are driving rapid adoption. Advances in deep learning, NLP, and reinforcement learning are enabling more accurate and adaptive predictive models.
- Restraint: Data privacy concerns, model interpretability challenges, and regulatory scrutiny present barriers to adoption, especially in highly regulated markets. The risk of overfitting and algorithmic bias also poses challenges for widespread deployment.
- Opportunity: The emergence of explainable AI, integration of alternative data, and expansion into emerging markets offer significant opportunities to enhance predictive accuracy and broaden adoption. The rise of AI-powered ESG (Environmental, Social, Governance) analytics is unlocking new investment strategies.
- Trend: Integration of real-time sentiment analysis, AI-driven risk management, and autonomous trading bots are redefining how investors approach the stock market. Partnerships between fintech startups and traditional financial institutions are accelerating innovation and market maturity.
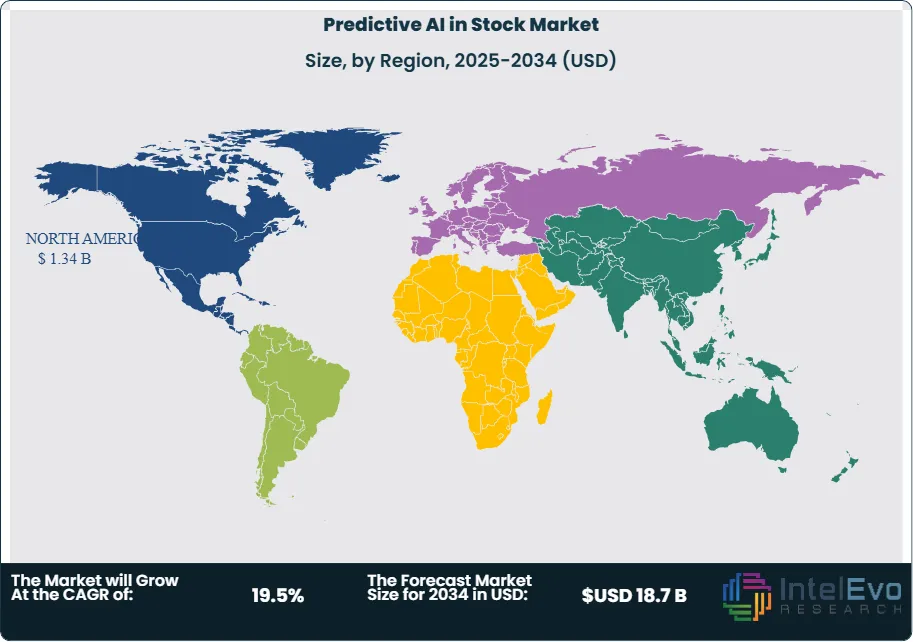
- Regional Analysis: North America leads the global predictive AI in stock market sector, holding 42% market share in 2024, driven by the presence of major financial hubs, advanced technology infrastructure, and supportive regulatory frameworks. Asia Pacific follows with 31%, fueled by rapid fintech adoption in China, India, and Southeast Asia. Europe holds 20%, with strong growth in the UK, Germany, and Switzerland. Latin America and the Middle East & Africa are emerging markets with rising fintech investment and digital trading adoption.
Type Analysis:
Algorithmic Trading Platforms and AI Portfolio Management solutions are the cornerstone of the predictive AI in stock market sector, accounting for the largest share among solution types. Their dominance is rooted in the ability to process massive datasets, identify trading signals, and execute trades at high speed and accuracy. These platforms leverage machine learning, deep learning, and reinforcement learning to adapt to changing market conditions and optimize investment strategies.
Sentiment Analysis Tools and Alternative Data Analytics are gaining traction, enabling investors to incorporate real-time news, social media, and non-traditional data sources into their predictive models. These tools enhance market forecasting by capturing market sentiment and identifying emerging trends before they are reflected in prices.
Platform Analysis:
Cloud-Based AI Platforms Lead With Over 55% Market Share. Cloud-based platforms have become the dominant deployment model for predictive AI in the stock market, offering scalability, flexibility, and real-time data processing capabilities. These platforms enable seamless integration with trading systems, data feeds, and third-party analytics, making them ideal for both institutional and retail investors. The adoption of cloud infrastructure reduces operational costs and accelerates the deployment of AI models, driving continued investment and innovation in this segment. On-premises solutions remain relevant for large financial institutions with stringent data security and compliance requirements, but the trend is shifting toward hybrid and cloud-native architectures.
End-User Industry Analysis:
Institutional Investors Lead Adoption With 48% Market Share. Institutional investors, including hedge funds, asset managers, and proprietary trading firms, are the primary adopters of predictive AI solutions, leveraging advanced analytics to gain competitive advantages in trading and portfolio management. Retail investors are increasingly accessing AI-powered tools through robo-advisors and online trading platforms, democratizing access to sophisticated investment strategies. Financial advisory firms are also integrating AI to enhance client services and optimize portfolio recommendations.
Region Analysis:
North America Leads With 42% Market Share. North America dominates the global predictive AI in stock market sector, driven by the concentration of major financial institutions, fintech startups, and technology providers in the US and Canada. The region benefits from advanced digital infrastructure, regulatory support for innovation, and a mature investment ecosystem. Asia Pacific is the fastest-growing region, fueled by rapid fintech adoption, expanding capital markets, and government initiatives supporting AI research and development. Europe maintains a strong presence, particularly in the UK, Germany, and Switzerland, where financial services innovation and regulatory clarity support market growth. Emerging markets in Latin America, Africa, and Southeast Asia are expected to see significant growth as digital trading adoption accelerates.
Get More Information about this report -
Request Free Sample ReportKey Market Segment
Type
- Algorithmic Trading Platforms
- AI Portfolio Management
- Sentiment Analysis Tools
- Alternative Data Analytics
- Risk Management Systems
Platform
- Cloud-Based AI Platforms
- On-Premises Solutions
- Hybrid Architectures
End-User Industry
- Institutional Investors
- Retail Investors
- Financial Advisory Firms
- Others
Region
- North America
- Latin America
- East Asia And Pacific
- Sea And South Asia
- Eastern Europe
- Western Europe
- Middle East & Africa
| Report Attribute | Details |
| Market size (2025) | USD 3.82 B |
| Forecast Revenue (2034) | USD 18.7 B |
| CAGR (2025-2034) | 19.5% |
| Historical data | 2018-2023 |
| Base Year For Estimation | 2024 |
| Forecast Period | 2025-2034 |
| Report coverage | Revenue Forecast, Competitive Landscape, Market Dynamics, Growth Factors, Trends and Recent Developments |
| Segments covered | Type (Algorithmic Trading Platforms, AI Portfolio Management, Sentiment Analysis Tools, Alternative Data Analytics, Risk Management Systems) Platform (Cloud-Based AI Platforms, On-Premises Solutions, Hybrid Architectures) End-User Industry (Institutional Investors, Retail Investors, Financial Advisory Firms, Others) |
| Research Methodology |
|
| Regional scope |
|
| Competitive Landscape | IBM Corporation, Google LLC (Alphabet Inc.), Microsoft Corporation, Bloomberg L.P., Refinitiv (London Stock Exchange Group), Alpaca, Kensho Technologies (S&P Global), Numerai, Sentifi, Dataminr, Trade Ideas LLC, Upstox, QuantConnect, BlackRock, Inc., Two Sigma Investments |
| Customization Scope | Customization for segments, region/country-level will be provided. Moreover, additional customization can be done based on the requirements. |
| Pricing and Purchase Options | Avail customized purchase options to meet your exact research needs. We have three licenses to opt for: Single User License, Multi-User License (Up to 5 Users), Corporate Use License (Unlimited User and Printable PDF). |
 Platform (Cloud-Based AI, On-Premises, Hybrid) End-User (Institutional Investors, Retail Investors, Financial Advisory Firms) Industry Region & Key Players-Industry Segment Overview, Market Dynamics, Competitive Strategies, Trends & Forecast 2025-2034")
 Platform (Cloud-Based AI, On-Premises, Hybrid) End-User (Institutional Investors, Retail Investors, Financial Advisory Firms) Industry Region & Key Players-Industry Segment Overview, Market Dynamics, Competitive Strategies, Trends & Forecast 2025-2034")
 Platform (Cloud-Based AI, On-Premises, Hybrid) End-User (Institutional Investors, Retail Investors, Financial Advisory Firms) Industry Region & Key Players-Industry Segment Overview, Market Dynamics, Competitive Strategies, Trends & Forecast 2025-2034")
Frequently Asked Questions
How big is the Predictive AI in Stock Market?
Predictive AI in Stock Market set to soar from USD 3.2B in 2024 to USD 18.7B by 2034, growing at 19.5% CAGR—driven by AI-led trading, forecasting, and automation.
Who are the major players in the Predictive AI in Stock Market?
IBM Corporation, Google LLC (Alphabet Inc.), Microsoft Corporation, Bloomberg L.P., Refinitiv (London Stock Exchange Group), Alpaca, Kensho Technologies (S&P Global), Numerai, Sentifi, Dataminr, Trade Ideas LLC, Upstox, QuantConnect, BlackRock, Inc., Two Sigma Investments
Which segments covered the Predictive AI in Stock Market?
Type (Algorithmic Trading Platforms, AI Portfolio Management, Sentiment Analysis Tools, Alternative Data Analytics, Risk Management Systems) Platform (Cloud-Based AI Platforms, On-Premises Solutions, Hybrid Architectures) End-User Industry (Institutional Investors, Retail Investors, Financial Advisory Firms, Others)
How can this market research report help my business make strategic decisions?
Our market research reports provide actionable intelligence, including verified market size data, CAGR projections, competitive benchmarking, and segment-level opportunity analysis. These insights support strategic planning, investment decisions, product development, and market entry strategies for enterprises and startups alike.
How frequently is the data updated?
We continuously monitor industry developments and update our reports to reflect regulatory changes, technological advancements, and macroeconomic shifts. Updated editions ensure you receive the latest market intelligence.

Select Licence Type
Connect with our sales team
Predictive AI in Stock Market
Published Date : 05 Aug 2025 | Formats :Why IntelEvoResearch
100%
Customer
Satisfaction
24x7+
Availability - we are always
there when you need us
200+
Fortune 50 Companies trust
IntelEvoResearch
80%
of our reports are exclusive
and first in the industry
100%
more data
and analysis
1000+
reports published
till date