Predictive Analytics in EdTech Market Size & 25.4% CAGR
Global Predictive Analytics in EdTech Market Size, Share & Digital Learning Insights By Solution Type, By Application (Student Performance, Retention, Curriculum Design), By End User (K-12, Higher Education, Corporate Training), Regional Adoption Trends, Key Vendors & Forecast 2025–2034
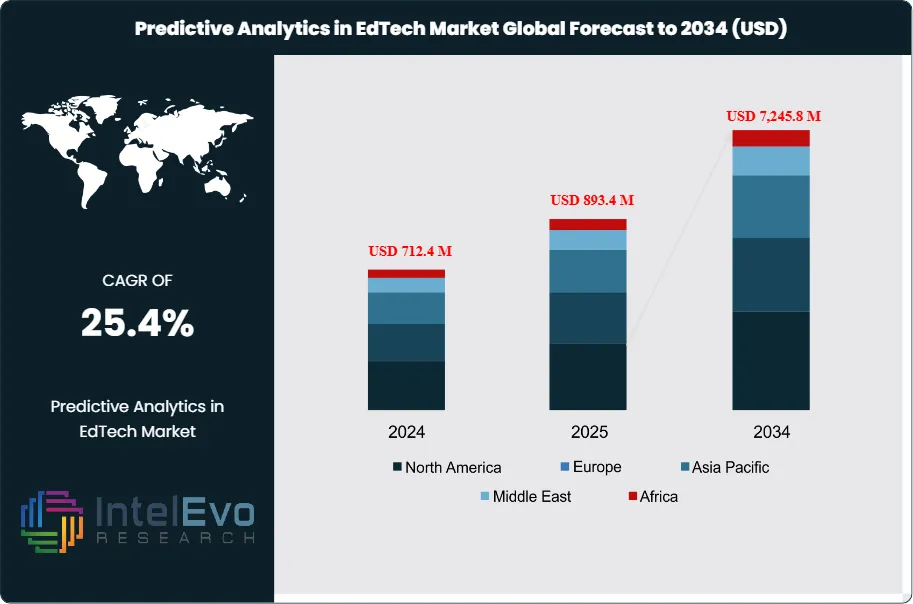
The Predictive Analytics in EdTech Market is estimated at USD 712.4 million in 2024 and is projected to reach approximately USD 7,245.8 million by 2034, registering a strong CAGR of about 25.4% during 2025–2034. This rapid expansion is driven by accelerating adoption of data-driven decision-making across K–12, higher education, and corporate learning platforms. Institutions are increasingly leveraging predictive analytics to personalize learning paths, improve student retention, and optimize academic outcomes. The integration of AI, machine learning, and real-time learning management system data is further transforming predictive analytics into a core component of next-generation digital education ecosystems.
The sector has transitioned from early adoption to accelerated growth, fueled by the rapid expansion of digital learning environments and data-driven education models. Between 2019 and 2024, spending on education technology more than doubled as institutions moved toward hybrid and online learning. This created a robust foundation for analytics tools capable of turning student performance data into actionable insights.
In 2024, North America accounted for over 34.8% of global revenues, led by major implementations across the United States and Canada. Europe followed with strong adoption in the United Kingdom and Germany, while Asia-Pacific is emerging as the fastest-growing region, supported by expanding enrollment in online universities and national digital education programs in India, China, and Southeast Asia. These markets are expected to present high-return opportunities for investors seeking early-stage growth potential.
The expansion of predictive analytics in education is largely demand-driven. Institutions seek to improve retention, forecast learner outcomes, and manage resources more efficiently. As educational data volumes increase—from learning management systems, adaptive platforms, and assessment tools—analytics solutions help administrators and instructors anticipate student needs. On the supply side, falling costs of cloud infrastructure and AI modeling have lowered adoption barriers, while policy support for digital transformation strengthens long-term market stability. However, unresolved challenges remain. Data privacy concerns and the uneven digital readiness of institutions continue to limit uptake in developing economies.
Technology is at the center of the market’s evolution. Machine learning models now enable real-time tracking of student engagement, while natural language processing improves grading accuracy and feedback efficiency. Automation is streamlining routine academic administration, freeing instructors to focus on pedagogy. The next growth phase will depend on integrating these tools into holistic decision-making frameworks—systems where educators, administrators, and technology providers use analytics collaboratively to deliver measurable learning gains. As predictive analytics become standard practice, the market’s growth trajectory points toward deeper institutional integration and sustainable long-term adoption across the global EdTech sector.
Key Takeaways
Market Growth: The global Predictive Analytics in EdTech market is valued at USD 712.4 million in 2024 and is projected to reach approximately USD 7,245.8 million by 2034, growing at a compound annual rate of 25.4%. Growth is supported by increased adoption of data-driven learning tools and institutional demand for improved student retention and performance insights.
Component: The Software segment holds the largest share, accounting for 67.4% of market revenue in 2024. This dominance is driven by widespread use of predictive learning platforms and AI-enabled analytics suites that integrate with existing education management systems.
Deployment Model: The Cloud-Based segment leads with 58.2% of total adoption in 2024. Institutions are moving toward cloud infrastructure to reduce maintenance costs and enable real-time data processing for adaptive learning environments.
Application: Student Performance Management represents the largest application area, capturing 47.3% of the market share in 2024. Schools and universities use predictive analytics to identify at-risk students, personalize learning paths, and boost completion rates.
End Use: The Higher Education segment holds 26.2% of total market share in 2024, reflecting extensive adoption in universities focused on institutional efficiency and research-based performance analytics.
Driver: Rising digital learning activity and expanding data volume from learning management systems are key growth drivers. Over 70% of higher education institutions now use analytics to inform student success strategies, supporting continued market expansion.
Restraint: Data privacy and compliance regulations, particularly around student data protection, limit analytics deployment. Legal constraints under frameworks such as GDPR and FERPA raise implementation costs and slow adoption across regions with stricter standards.
Opportunity: The Asia-Pacific region presents untapped growth potential with forecasted CAGRs exceeding 26% through 2034. Expanding e-learning adoption in India, China, and Southeast Asia positions the region as a priority target for foreign investment and analytics software providers.
Trend: Integration of artificial intelligence and natural language processing is accelerating predictive accuracy and automated course feedback. Companies such as IBM Watson Education and Civitas Learning are advancing adaptive algorithms to support personalized instruction and institutional analytics.
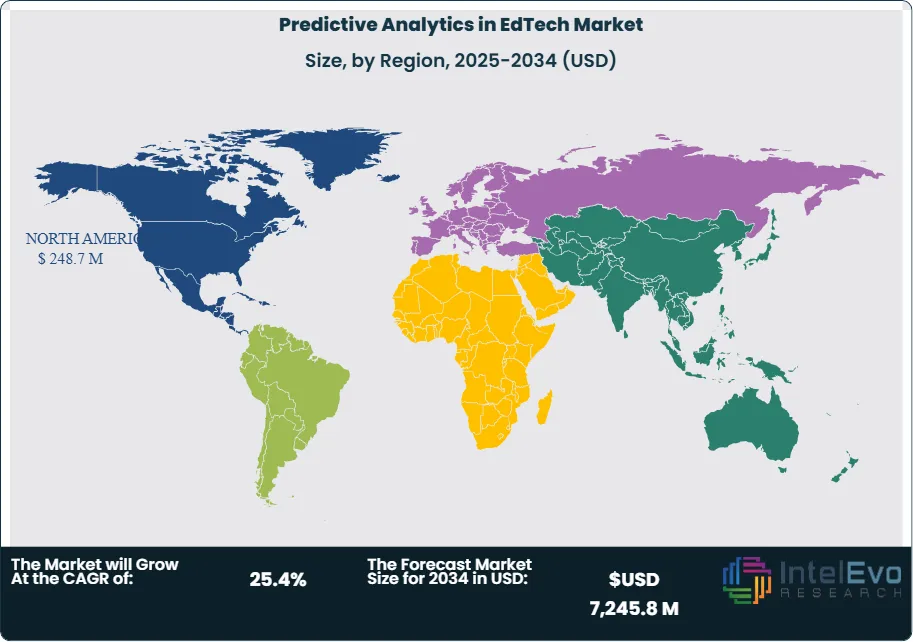
Regional Analysis: North America leads with 34.9% of global revenue in 2024, valued at USD 237 million. Europe shows strong policy-backed adoption, while Asia-Pacific is the fastest-growing region, driven by national digital education programs and rapid scaling of online learning platforms.
Component
As of 2025, software solutions maintain a commanding presence in the global Predictive Analytics in EdTech market, accounting for over 67% of total revenue. This dominance reflects the integral role of predictive analytics software in transforming educational data into measurable intelligence. Advanced software platforms now incorporate machine learning and artificial intelligence algorithms that can assess vast datasets in real time, guiding educators and administrators in identifying performance trends and improving operational efficiency. The market has evolved from basic analytics dashboards to fully integrated decision-making systems used across K-12, higher education, and corporate learning institutions.
The continued strength of the software segment is supported by rising adoption of cloud-based analytics platforms and modular learning management system (LMS) integrations. These systems enable scalability and interoperability, making them suitable for institutions handling complex data structures and large online student populations. Leading vendors such as IBM, Oracle, and Civitas Learning have expanded their focus on education-specific solutions that offer predictive capabilities for both learning outcomes and institutional performance. Service-based components are also gaining ground as institutions seek consulting and implementation support, but software remains the core driver of market expansion through 2034.
Application
Student Performance Management continues to represent the largest application area, contributing nearly half of the market’s total share in 2025. The focus on data-informed teaching is accelerating as institutions prioritize student retention, engagement, and personalized instruction. Analytics tools now identify early signs of academic risk using attendance records, submission patterns, and behavioral data. These insights enable intervention strategies that directly impact graduation rates and institutional rankings.
Curriculum Development and Resource Allocation are also expanding applications. Institutions are shifting toward predictive course planning, using analytics to forecast enrollment trends and design flexible curriculums aligned with market demand. Resource Allocation analytics allow universities to improve spending efficiency across staffing, digital tools, and physical infrastructure. Between 2025 and 2034, these applications are projected to grow at a CAGR exceeding 22%, driven by tighter education budgets and the need for performance accountability in both private and public education systems.
End-User
Higher Education remains the largest end-user segment, accounting for roughly 26% of total market share in 2025. Universities rely on predictive analytics to evaluate student outcomes, forecast enrollment, and anticipate academic risks. Competitive pressures are pushing institutions to adopt data-backed retention models, with large-scale implementations across North American and European universities. The segment’s sustained growth is supported by strong investments in digital infrastructure and analytics partnerships with major technology providers.
Corporate Training represents a fast-growing opportunity within the market. Organizations are using predictive analytics to measure training effectiveness and align learning programs with workforce performance targets. Platforms such as Coursera for Business and LinkedIn Learning are integrating predictive capabilities to customize learning pathways and track skills progression. K–12 and online learning platforms also continue to benefit as governments and private operators invest in adaptive learning models, enabling individualized content delivery for millions of remote learners worldwide.
Regional
North America maintains its leadership position in 2025, representing approximately 34.8% of global market share and generating an estimated USD 270 million in revenue. This dominance stems from strong institutional adoption, high data literacy, and advanced education technology infrastructure. U.S. universities and school districts are expanding predictive analytics programs to enhance performance accountability and evidence-based policy development. Canada continues to report high adoption of AI-backed learning analytics, supported by provincial funding for digital transformation in education.
Europe follows as the second major region, with the United Kingdom, Germany, and the Nordics leading through government investments in education analytics and digital assessment systems. The Asia Pacific region, however, is poised for the highest growth, projected to record a CAGR above 26% through 2034. Countries including India, China, and South Korea are investing heavily in national e-learning frameworks that prioritize analytics integration. Meanwhile, Latin America and the Middle East & Africa are emerging as key expansion zones as online education and cloud connectivity improve. Growing awareness of personalized learning and performance-based metrics in these regions will continue to create strong commercial opportunities for EdTech analytics providers over the next decade.
By Component (Software, Services), By Deployment Mode (Cloud-Based, On-Premises), By Application (Student Performance Management, Curriculum Development, Resource Allocation, Others), By End-User (K-12 Education, Higher Education, Corporate Training, Online Learning Platforms)
Research Methodology
Primary Research- 100 Interviews of Stakeholders
Secondary Research
Desk Research
Regional scope
North America (United States, Canada, Mexico)
Latin America (Brazil, Argentina, Columbia)
East Asia And Pacific (China, Japan, South Korea, Australia, Cambodia, Fiji, Indonesia)
Sea And South Asia (India, Singapore, Thailand, Taiwan, Malaysia)
Eastern Europe (Poland, Russia, Czech Republic, Romania)
Western Europe (Germany, U.K., France, Spain, Itlay)
Middle East & Africa (GCC Countries, Egypt, Nigeria, South Africa, Israel)
Competitive Landscape
Oracle Corporation, Instructure, Inc., SAS Institute Inc., IBM Corporation, Blackboard Inc., Salesforce, Google LLC, D2L Corporation, Microsoft Corporation, Other Major Players
Customization Scope
Customization for segments, region/country-level will be provided. Moreover, additional customization can be done based on the requirements.
Pricing and Purchase Options
Avail customized purchase options to meet your exact research needs. We have three licenses to opt for: Single User License, Multi-User License (Up to 5 Users), Corporate Use License (Unlimited User and Printable PDF).
TABLE OF CONTENTS
1. EXECUTIVE SUMMARY
1.1. MARKET SNAPSHOT
1.2. KEY FINDINGS & INSIGHTS
1.3. ANALYST RECOMMENDATIONS
1.4. FUTURE OUTLOOK
2. RESEARCH METHODOLOGY
2.1. MARKET DEFINITION & SCOPE
2.2. RESEARCH OBJECTIVES: PRIMARY & SECONDARY DATA SOURCES
2.3. DATA COLLECTION SOURCES
2.3.1. COVERAGE OF 100+ PRIMARY RESEARCH/CONSULTATION CALLS WITH INDUSTRY STAKEHOLDERS
FIGURE 17 NORTH AMERICA PREDICTIVE ANALYTICS IN EDTECH CURRENT AND FUTURE TYPE ANALYSIS, 2025–2034, (USD MILLION)
FIGURE 18 NORTH AMERICA PREDICTIVE ANALYTICS IN EDTECH CURRENT AND FUTURE END USER ANALYSIS, 2025–2034, (USD MILLION)
FIGURE 19 MARKET SHARE BY COUNTRY
FIGURE 20 LATIN AMERICA PREDICTIVE ANALYTICS IN EDTECH CURRENT AND FUTURE TYPE ANALYSIS, 2025–2034, (USD MILLION)
FIGURE 21 LATIN AMERICA PREDICTIVE ANALYTICS IN EDTECH CURRENT AND FUTURE END USER ANALYSIS, 2025–2034, (USD MILLION)
FIGURE 22 MARKET SHARE BY COUNTRY
FIGURE 23 EASTERN EUROPE PREDICTIVE ANALYTICS IN EDTECH CURRENT AND FUTURE TYPE ANALYSIS, 2025–2034, (USD MILLION)
FIGURE 24 EASTERN EUROPE PREDICTIVE ANALYTICS IN EDTECH CURRENT AND FUTURE END USER ANALYSIS, 2025–2034, (USD MILLION)
FIGURE 25 MARKET SHARE BY COUNTRY
FIGURE 26 WESTERN EUROPE PREDICTIVE ANALYTICS IN EDTECH CURRENT AND FUTURE TYPE ANALYSIS, 2025–2034, (USD MILLION)
FIGURE 27 WESTERN EUROPE PREDICTIVE ANALYTICS IN EDTECH CURRENT AND FUTURE END USER ANALYSIS, 2025–2034, (USD MILLION)
FIGURE 28 MARKET SHARE BY COUNTRY
FIGURE 29 EAST ASIA AND PACIFIC PREDICTIVE ANALYTICS IN EDTECH CURRENT AND FUTURE TYPE ANALYSIS, 2025–2034, (USD MILLION)
FIGURE 30 EAST ASIA AND PACIFIC PREDICTIVE ANALYTICS IN EDTECH CURRENT AND FUTURE END USER ANALYSIS, 2025–2034, (USD MILLION)
FIGURE 31 MARKET SHARE BY COUNTRY
FIGURE 32 SEA AND SOUTH ASIA PREDICTIVE ANALYTICS IN EDTECH CURRENT AND FUTURE TYPE ANALYSIS, 2025–2034, (USD MILLION)
FIGURE 33 SEA AND SOUTH ASIA PREDICTIVE ANALYTICS IN EDTECH CURRENT AND FUTURE END USER ANALYSIS, 2025–2034, (USD MILLION)
FIGURE 34 MARKET SHARE BY COUNTRY
FIGURE 35 MIDDLE EAST AND AFRICA PREDICTIVE ANALYTICS IN EDTECH CURRENT AND FUTURE TYPE ANALYSIS, 2025–2034, (USD MILLION)
FIGURE 36 MIDDLE EAST AND AFRICA PREDICTIVE ANALYTICS IN EDTECH CURRENT AND FUTURE END USER ANALYSIS, 2025–2034, (USD MILLION)
FIGURE 37 NORTH AMERICA PREDICTIVE ANALYTICS IN EDTECH CURRENT AND FUTURE MARKET VOLUME SHARE REGIONAL ANALYSIS, 2025–2034, (USD MILLION)
FIGURE 38 U.S. PREDICTIVE ANALYTICS IN EDTECH CURRENT AND FUTURE TYPE ANALYSIS, 2025–2034, (USD MILLION)
FIGURE 39 U.S. PREDICTIVE ANALYTICS IN EDTECH CURRENT AND FUTURE END USER ANALYSIS, 2025–2034, (USD MILLION)
FIGURE 40 CANADA PREDICTIVE ANALYTICS IN EDTECH CURRENT AND FUTURE TYPE ANALYSIS, 2025–2034, (USD MILLION)
FIGURE 41 CANADA PREDICTIVE ANALYTICS IN EDTECH CURRENT AND FUTURE END USER ANALYSIS, 2025–2034, (USD MILLION)
FIGURE 42 LATIN AMERICA PREDICTIVE ANALYTICS IN EDTECH CURRENT AND FUTURE MARKET VOLUME SHARE REGIONAL ANALYSIS, 2025–2034, (USD MILLION)
FIGURE 43 MEXICO PREDICTIVE ANALYTICS IN EDTECH CURRENT AND FUTURE TYPE ANALYSIS, 2025–2034, (USD MILLION)
FIGURE 44 MEXICO PREDICTIVE ANALYTICS IN EDTECH CURRENT AND FUTURE END USER ANALYSIS, 2025–2034, (USD MILLION)
FIGURE 45 BRAZIL PREDICTIVE ANALYTICS IN EDTECH CURRENT AND FUTURE TYPE ANALYSIS, 2025–2034, (USD MILLION)
FIGURE 46 BRAZIL PREDICTIVE ANALYTICS IN EDTECH CURRENT AND FUTURE END USER ANALYSIS, 2025–2034, (USD MILLION)
FIGURE 47 ARGENTINA PREDICTIVE ANALYTICS IN EDTECH CURRENT AND FUTURE TYPE ANALYSIS, 2025–2034, (USD MILLION)
FIGURE 48 ARGENTINA PREDICTIVE ANALYTICS IN EDTECH CURRENT AND FUTURE END USER ANALYSIS, 2025–2034, (USD MILLION)
FIGURE 49 COLUMBIA PREDICTIVE ANALYTICS IN EDTECH CURRENT AND FUTURE TYPE ANALYSIS, 2025–2034, (USD MILLION)
FIGURE 50 COLUMBIA PREDICTIVE ANALYTICS IN EDTECH CURRENT AND FUTURE END USER ANALYSIS, 2025–2034, (USD MILLION)
FIGURE 51 REST OF LATIN AMERICA PREDICTIVE ANALYTICS IN EDTECH CURRENT AND FUTURE TYPE ANALYSIS, 2025–2034, (USD MILLION)
FIGURE 52 REST OF LATIN AMERICA PREDICTIVE ANALYTICS IN EDTECH CURRENT AND FUTURE END USER ANALYSIS, 2025–2034, (USD MILLION)
FIGURE 53 EASTERN EUROPE PREDICTIVE ANALYTICS IN EDTECH CURRENT AND FUTURE MARKET VOLUME SHARE REGIONAL ANALYSIS, 2025–2034, (USD MILLION)
FIGURE 54 POLAND PREDICTIVE ANALYTICS IN EDTECH CURRENT AND FUTURE TYPE ANALYSIS, 2025–2034, (USD MILLION)
FIGURE 55 POLAND PREDICTIVE ANALYTICS IN EDTECH CURRENT AND FUTURE END USER ANALYSIS, 2025–2034, (USD MILLION)
FIGURE 56 RUSSIA PREDICTIVE ANALYTICS IN EDTECH CURRENT AND FUTURE TYPE ANALYSIS, 2025–2034, (USD MILLION)
FIGURE 57 RUSSIA PREDICTIVE ANALYTICS IN EDTECH CURRENT AND FUTURE END USER ANALYSIS, 2025–2034, (USD MILLION)
FIGURE 58 CZECH REPUBLIC PREDICTIVE ANALYTICS IN EDTECH CURRENT AND FUTURE TYPE ANALYSIS, 2025–2034, (USD MILLION)
FIGURE 59 CZECH REPUBLIC PREDICTIVE ANALYTICS IN EDTECH CURRENT AND FUTURE END USER ANALYSIS, 2025–2034, (USD MILLION)
FIGURE 60 ROMANIA PREDICTIVE ANALYTICS IN EDTECH CURRENT AND FUTURE TYPE ANALYSIS, 2025–2034, (USD MILLION)
FIGURE 61 ROMANIA PREDICTIVE ANALYTICS IN EDTECH CURRENT AND FUTURE END USER ANALYSIS, 2025–2034, (USD MILLION)
FIGURE 62 REST OF EASTERN EUROPE PREDICTIVE ANALYTICS IN EDTECH CURRENT AND FUTURE TYPE ANALYSIS, 2025–2034, (USD MILLION)
FIGURE 63 REST OF EASTERN EUROPE PREDICTIVE ANALYTICS IN EDTECH CURRENT AND FUTURE END USER ANALYSIS, 2025–2034, (USD MILLION)
FIGURE 64 WESTERN EUROPE PREDICTIVE ANALYTICS IN EDTECH CURRENT AND FUTURE MARKET VOLUME SHARE REGIONAL ANALYSIS, 2025–2034, (USD MILLION)
FIGURE 65 GERMANY PREDICTIVE ANALYTICS IN EDTECH CURRENT AND FUTURE TYPE ANALYSIS, 2025–2034, (USD MILLION)
FIGURE 66 GERMANY PREDICTIVE ANALYTICS IN EDTECH CURRENT AND FUTURE END USER ANALYSIS, 2025–2034, (USD MILLION)
FIGURE 67 FRANCE PREDICTIVE ANALYTICS IN EDTECH CURRENT AND FUTURE TYPE ANALYSIS, 2025–2034, (USD MILLION)
FIGURE 68 FRANCE PREDICTIVE ANALYTICS IN EDTECH CURRENT AND FUTURE END USER ANALYSIS, 2025–2034, (USD MILLION)
FIGURE 69 UK PREDICTIVE ANALYTICS IN EDTECH CURRENT AND FUTURE TYPE ANALYSIS, 2025–2034, (USD MILLION)
FIGURE 70 UK PREDICTIVE ANALYTICS IN EDTECH CURRENT AND FUTURE END USER ANALYSIS, 2025–2034, (USD MILLION)
FIGURE 71 SPAIN PREDICTIVE ANALYTICS IN EDTECH CURRENT AND FUTURE TYPE ANALYSIS, 2025–2034, (USD MILLION)
FIGURE 72 SPAIN PREDICTIVE ANALYTICS IN EDTECH CURRENT AND FUTURE END USER ANALYSIS, 2025–2034, (USD MILLION)
FIGURE 73 ITALY PREDICTIVE ANALYTICS IN EDTECH CURRENT AND FUTURE TYPE ANALYSIS, 2025–2034, (USD MILLION)
FIGURE 74 ITALY PREDICTIVE ANALYTICS IN EDTECH CURRENT AND FUTURE END USER ANALYSIS, 2025–2034, (USD MILLION)
FIGURE 75 REST OF WESTERN EUROPE PREDICTIVE ANALYTICS IN EDTECH CURRENT AND FUTURE TYPE ANALYSIS, 2025–2034, (USD MILLION)
FIGURE 76 REST OF WESTERN EUROPE PREDICTIVE ANALYTICS IN EDTECH CURRENT AND FUTURE END USER ANALYSIS, 2025–2034, (USD MILLION)
FIGURE 77 EAST ASIA AND PACIFIC PREDICTIVE ANALYTICS IN EDTECH CURRENT AND FUTURE MARKET VOLUME SHARE REGIONAL ANALYSIS, 2025–2034, (USD MILLION)
FIGURE 78 CHINA PREDICTIVE ANALYTICS IN EDTECH CURRENT AND FUTURE TYPE ANALYSIS, 2025–2034, (USD MILLION)
FIGURE 79 CHINA PREDICTIVE ANALYTICS IN EDTECH CURRENT AND FUTURE END USER ANALYSIS, 2025–2034, (USD MILLION)
FIGURE 80 JAPAN PREDICTIVE ANALYTICS IN EDTECH CURRENT AND FUTURE TYPE ANALYSIS, 2025–2034, (USD MILLION)
FIGURE 81 JAPAN PREDICTIVE ANALYTICS IN EDTECH CURRENT AND FUTURE END USER ANALYSIS, 2025–2034, (USD MILLION)
FIGURE 82 AUSTRALIA PREDICTIVE ANALYTICS IN EDTECH CURRENT AND FUTURE TYPE ANALYSIS, 2025–2034, (USD MILLION)
FIGURE 83 AUSTRALIA PREDICTIVE ANALYTICS IN EDTECH CURRENT AND FUTURE END USER ANALYSIS, 2025–2034, (USD MILLION)
FIGURE 84 CAMBODIA PREDICTIVE ANALYTICS IN EDTECH CURRENT AND FUTURE TYPE ANALYSIS, 2025–2034, (USD MILLION)
FIGURE 85 CAMBODIA PREDICTIVE ANALYTICS IN EDTECH CURRENT AND FUTURE END USER ANALYSIS, 2025–2034, (USD MILLION)
FIGURE 86 FIJI PREDICTIVE ANALYTICS IN EDTECH CURRENT AND FUTURE TYPE ANALYSIS, 2025–2034, (USD MILLION)
FIGURE 87 FIJI PREDICTIVE ANALYTICS IN EDTECH CURRENT AND FUTURE END USER ANALYSIS, 2025–2034, (USD MILLION)
FIGURE 88 INDONESIA PREDICTIVE ANALYTICS IN EDTECH CURRENT AND FUTURE TYPE ANALYSIS, 2025–2034, (USD MILLION)
FIGURE 89 INDONESIA PREDICTIVE ANALYTICS IN EDTECH CURRENT AND FUTURE END USER ANALYSIS, 2025–2034, (USD MILLION)
FIGURE 90 SOUTH KOREA PREDICTIVE ANALYTICS IN EDTECH CURRENT AND FUTURE TYPE ANALYSIS, 2025–2034, (USD MILLION)
FIGURE 91 SOUTH KOREA PREDICTIVE ANALYTICS IN EDTECH CURRENT AND FUTURE END USER ANALYSIS, 2025–2034, (USD MILLION)
FIGURE 92 REST OF EAST ASIA AND PACIFIC PREDICTIVE ANALYTICS IN EDTECH CURRENT AND FUTURE TYPE ANALYSIS, 2025–2034, (USD MILLION)
FIGURE 93 REST OF EAST ASIA AND PACIFIC PREDICTIVE ANALYTICS IN EDTECH CURRENT AND FUTURE END USER ANALYSIS, 2025–2034, (USD MILLION)
FIGURE 94 SEA AND SOUTH ASIA PREDICTIVE ANALYTICS IN EDTECH CURRENT AND FUTURE MARKET VOLUME SHARE REGIONAL ANALYSIS, 2025–2034, (USD MILLION)
FIGURE 95 BANGLADESH PREDICTIVE ANALYTICS IN EDTECH CURRENT AND FUTURE TYPE ANALYSIS, 2025–2034, (USD MILLION)
FIGURE 96 BANGLADESH PREDICTIVE ANALYTICS IN EDTECH CURRENT AND FUTURE END USER ANALYSIS, 2025–2034, (USD MILLION)
FIGURE 97 NEW ZEALAND PREDICTIVE ANALYTICS IN EDTECH CURRENT AND FUTURE TYPE ANALYSIS, 2025–2034, (USD MILLION)
FIGURE 98 NEW ZEALAND PREDICTIVE ANALYTICS IN EDTECH CURRENT AND FUTURE END USER ANALYSIS, 2025–2034, (USD MILLION)
FIGURE 99 INDIA PREDICTIVE ANALYTICS IN EDTECH CURRENT AND FUTURE TYPE ANALYSIS, 2025–2034, (USD MILLION)
FIGURE 100 INDIA PREDICTIVE ANALYTICS IN EDTECH CURRENT AND FUTURE END USER ANALYSIS, 2025–2034, (USD MILLION)
FIGURE 101 SINGAPORE PREDICTIVE ANALYTICS IN EDTECH CURRENT AND FUTURE TYPE ANALYSIS, 2025–2034, (USD MILLION)
FIGURE 102 SINGAPORE PREDICTIVE ANALYTICS IN EDTECH CURRENT AND FUTURE END USER ANALYSIS, 2025–2034, (USD MILLION)
FIGURE 103 THAILAND PREDICTIVE ANALYTICS IN EDTECH CURRENT AND FUTURE TYPE ANALYSIS, 2025–2034, (USD MILLION)
FIGURE 104 THAILAND PREDICTIVE ANALYTICS IN EDTECH CURRENT AND FUTURE END USER ANALYSIS, 2025–2034, (USD MILLION)
FIGURE 105 TAIWAN PREDICTIVE ANALYTICS IN EDTECH CURRENT AND FUTURE TYPE ANALYSIS, 2025–2034, (USD MILLION)
FIGURE 106 TAIWAN PREDICTIVE ANALYTICS IN EDTECH CURRENT AND FUTURE END USER ANALYSIS, 2025–2034, (USD MILLION)
FIGURE 107 MALAYSIA PREDICTIVE ANALYTICS IN EDTECH CURRENT AND FUTURE TYPE ANALYSIS, 2025–2034, (USD MILLION)
FIGURE 108 MALAYSIA PREDICTIVE ANALYTICS IN EDTECH CURRENT AND FUTURE END USER ANALYSIS, 2025–2034, (USD MILLION)
FIGURE 109 REST OF SEA AND SOUTH ASIA PREDICTIVE ANALYTICS IN EDTECH CURRENT AND FUTURE TYPE ANALYSIS, 2025–2034, (USD MILLION)
FIGURE 110 REST OF SEA AND SOUTH ASIA PREDICTIVE ANALYTICS IN EDTECH CURRENT AND FUTURE END USER ANALYSIS, 2025–2034, (USD MILLION)
FIGURE 111 MIDDLE EAST AND AFRICA PREDICTIVE ANALYTICS IN EDTECH CURRENT AND FUTURE MARKET VOLUME SHARE REGIONAL ANALYSIS, 2025–2034, (USD MILLION)
FIGURE 112 GCC COUNTRIES PREDICTIVE ANALYTICS IN EDTECH CURRENT AND FUTURE TYPE ANALYSIS, 2025–2034, (USD MILLION)
FIGURE 113 GCC COUNTRIES PREDICTIVE ANALYTICS IN EDTECH CURRENT AND FUTURE END USER ANALYSIS, 2025–2034, (USD MILLION)
FIGURE 114 SAUDI ARABIA PREDICTIVE ANALYTICS IN EDTECH CURRENT AND FUTURE TYPE ANALYSIS, 2025–2034, (USD MILLION)
FIGURE 115 SAUDI ARABIA PREDICTIVE ANALYTICS IN EDTECH CURRENT AND FUTURE END USER ANALYSIS, 2025–2034, (USD MILLION)
FIGURE 116 UAE PREDICTIVE ANALYTICS IN EDTECH CURRENT AND FUTURE TYPE ANALYSIS, 2025–2034, (USD MILLION)
FIGURE 117 UAE PREDICTIVE ANALYTICS IN EDTECH CURRENT AND FUTURE END USER ANALYSIS, 2025–2034, (USD MILLION)
FIGURE 118 BAHRAIN PREDICTIVE ANALYTICS IN EDTECH CURRENT AND FUTURE TYPE ANALYSIS, 2025–2034, (USD MILLION)
FIGURE 119 BAHRAIN PREDICTIVE ANALYTICS IN EDTECH CURRENT AND FUTURE END USER ANALYSIS, 2025–2034, (USD MILLION)
FIGURE 120 KUWAIT PREDICTIVE ANALYTICS IN EDTECH CURRENT AND FUTURE TYPE ANALYSIS, 2025–2034, (USD MILLION)
FIGURE 121 KUWAIT PREDICTIVE ANALYTICS IN EDTECH CURRENT AND FUTURE END USER ANALYSIS, 2025–2034, (USD MILLION)
FIGURE 122 OMAN PREDICTIVE ANALYTICS IN EDTECH CURRENT AND FUTURE TYPE ANALYSIS, 2025–2034, (USD MILLION)
FIGURE 123 OMAN PREDICTIVE ANALYTICS IN EDTECH CURRENT AND FUTURE END USER ANALYSIS, 2025–2034, (USD MILLION)
FIGURE 124 QATAR PREDICTIVE ANALYTICS IN EDTECH CURRENT AND FUTURE TYPE ANALYSIS, 2025–2034, (USD MILLION)
FIGURE 125 QATAR PREDICTIVE ANALYTICS IN EDTECH CURRENT AND FUTURE END USER ANALYSIS, 2025–2034, (USD MILLION)
FIGURE 126 EGYPT PREDICTIVE ANALYTICS IN EDTECH CURRENT AND FUTURE TYPE ANALYSIS, 2025–2034, (USD MILLION)
FIGURE 127 EGYPT PREDICTIVE ANALYTICS IN EDTECH CURRENT AND FUTURE END USER ANALYSIS, 2025–2034, (USD MILLION)
FIGURE 128 NIGERIA PREDICTIVE ANALYTICS IN EDTECH CURRENT AND FUTURE TYPE ANALYSIS, 2025–2034, (USD MILLION)
FIGURE 129 NIGERIA PREDICTIVE ANALYTICS IN EDTECH CURRENT AND FUTURE END USER ANALYSIS, 2025–2034, (USD MILLION)
FIGURE 130 SOUTH AFRICA PREDICTIVE ANALYTICS IN EDTECH CURRENT AND FUTURE TYPE ANALYSIS, 2025–2034, (USD MILLION)
FIGURE 131 SOUTH AFRICA PREDICTIVE ANALYTICS IN EDTECH CURRENT AND FUTURE END USER ANALYSIS, 2025–2034, (USD MILLION)
FIGURE 132 ISRAEL PREDICTIVE ANALYTICS IN EDTECH CURRENT AND FUTURE TYPE ANALYSIS, 2025–2034, (USD MILLION)
FIGURE 133 ISRAEL PREDICTIVE ANALYTICS IN EDTECH CURRENT AND FUTURE END USER ANALYSIS, 2025–2034, (USD MILLION)
FIGURE 134 REST OF MEA PREDICTIVE ANALYTICS IN EDTECH CURRENT AND FUTURE TYPE ANALYSIS, 2025–2034, (USD MILLION)
FIGURE 135 REST OF MEA PREDICTIVE ANALYTICS IN EDTECH CURRENT AND FUTURE END USER ANALYSIS, 2025–2034, (USD MILLION)
FIGURE 136 U. S. MARKET SHARE ANALYSIS BY TYPE (2024)
FIGURE 137 U. S. MARKET SHARE ANALYSIS BY END USER (2024)
FIGURE 138 CANADA MARKET SHARE ANALYSIS BY TYPE (2024)
FIGURE 139 CANADA MARKET SHARE ANALYSIS BY END USER (2024)
FIGURE 140 MEXICO MARKET SHARE ANALYSIS BY TYPE (2024)
FIGURE 141 MEXICO MARKET SHARE ANALYSIS BY END USER (2024)
FIGURE 142 CHINA MARKET SHARE ANALYSIS BY TYPE (2024)
FIGURE 143 CHINA MARKET SHARE ANALYSIS BY END USER (2024)
FIGURE 144 JAPAN MARKET SHARE ANALYSIS BY TYPE (2024)
FIGURE 145 JAPAN MARKET SHARE ANALYSIS BY END USER (2024)
FIGURE 146 INDIA MARKET SHARE ANALYSIS BY TYPE (2024)
FIGURE 147 INDIA MARKET SHARE ANALYSIS BY END USER (2024)
FIGURE 148 SOUTH KOREA MARKET SHARE ANALYSIS BY TYPE (2024)
FIGURE 149 SOUTH KOREA MARKET SHARE ANALYSIS BY END USER (2024)
FIGURE 150 SAUDI ARABIA MARKET SHARE ANALYSIS BY TYPE (2024)
FIGURE 151 SAUDI ARABIA MARKET SHARE ANALYSIS BY END USER (2024)
FIGURE 152 UAE MARKET SHARE ANALYSIS BY TYPE (2024)
FIGURE 153 UAE MARKET SHARE ANALYSIS BY END USER (2024)
FIGURE 154 EGYPT MARKET SHARE ANALYSIS BY TYPE (2024)
FIGURE 155 EGYPT MARKET SHARE ANALYSIS BY END USER (2024)
FIGURE 156 NIGERIA MARKET SHARE ANALYSIS BY TYPE (2024)
FIGURE 157 NIGERIA MARKET SHARE ANALYSIS BY END USER (2024)
FIGURE 158 SOUTH AFRICA MARKET SHARE ANALYSIS BY TYPE (2024)
FIGURE 159 SOUTH AFRICA MARKET SHARE ANALYSIS BY END USER (2024)
FIGURE 160 GERMANY MARKET SHARE ANALYSIS BY TYPE (2024)
FIGURE 161 GERMANY MARKET SHARE ANALYSIS BY END USER (2024)
FIGURE 162 FRANCE MARKET SHARE ANALYSIS BY TYPE (2024)
FIGURE 163 FRANCE MARKET SHARE ANALYSIS BY END USER (2024)
FIGURE 164 UK MARKET SHARE ANALYSIS BY TYPE (2024)
FIGURE 165 UK MARKET SHARE ANALYSIS BY END USER (2024)
FIGURE 166 SPAIN MARKET SHARE ANALYSIS BY TYPE (2024)
FIGURE 167 SPAIN MARKET SHARE ANALYSIS BY END USER (2024)
FIGURE 168 ITALY MARKET SHARE ANALYSIS BY TYPE (2024)
FIGURE 169 ITALY MARKET SHARE ANALYSIS BY END USER (2024)
FIGURE 170 BRAZIL MARKET SHARE ANALYSIS BY TYPE (2024)
FIGURE 171 BRAZIL MARKET SHARE ANALYSIS BY END USER (2024)
FIGURE 172 ARGENTINA MARKET SHARE ANALYSIS BY TYPE (2024)
FIGURE 173 ARGENTINA MARKET SHARE ANALYSIS BY END USER (2024)
FIGURE 174 COLUMBIA MARKET SHARE ANALYSIS BY TYPE (2024)
FIGURE 175 COLUMBIA MARKET SHARE ANALYSIS BY END USER (2024)
FIGURE 176 GLOBAL PREDICTIVE ANALYTICS IN EDTECH CURRENT AND FUTURE MARKET KEY COUNTRY LEVEL ANALYSIS, 2024–2034, (USD MILLION)
FIGURE 177 FINANCIAL OVERVIEW:
Key Player Analysis
IBM Corporation: IBM Corporation remains a global leader in the predictive analytics in EdTech market due to its advanced data analytics, artificial intelligence, and cloud infrastructure capabilities. Through its IBM Watson Education platform, the company provides predictive learning tools that apply machine learning to assess student performance and generate actionable insights for educators. IBM’s Education Cloud framework has been adopted by a growing number of universities and government-led digital transformation initiatives to manage curriculum optimization and personalized instruction. In 2025, IBM’s focus on AI-powered analytics and edge computing continues to strengthen its position, with education partnerships expanding across North America and the Asia Pacific. The company’s emphasis on data governance and security compliance underpins its competitive differentiation, making it a preferred partner for institutions seeking analytics solutions aligned with global data privacy standards.
Microsoft Corporation: Microsoft Corporation holds a strong position as a technology enabler and integration partner in the predictive analytics in EdTech landscape. Its Azure cloud platform supports predictive analytics tools embedded in Microsoft Education and Power BI solutions, allowing institutions to track attendance, assess student progress, and manage academic performance dashboards. Microsoft’s strategic advantage lies in its institutional ecosystem integration, linking Microsoft 365, Teams for Education, and LinkedIn Learning with analytics for seamless data flow. In 2025, the company continues to expand its partnerships with educational ministries and EdTech providers across Europe and Latin America, driving adoption of cloud-based analytics systems. Sustained investments in AI and machine learning research, coupled with strong compatibility across devices and enterprise networks, have helped Microsoft maintain steady double-digit growth in education-sector revenues since 2022.
Google LLC: Google LLC stands as an innovator in the predictive analytics in EdTech segment, combining its expertise in AI, cloud computing, and big data analytics under the Google Cloud for Education umbrella. The company’s tools leverage real-time data analytics and adaptive insights through products such as Google Classroom and BigQuery. Its education-based AI services use predictive algorithms to detect student engagement patterns and improve learning design. In 2025, Google’s strategy emphasizes strengthening its education partnerships in emerging markets, particularly across India and Southeast Asia, where online education adoption is expanding rapidly. The integration of Workspace for Education with Google Cloud analytics creates a unified digital environment for managing institutional performance metrics. Competitive pricing and open-source AI accessibility continue to distinguish Google from traditional enterprise vendors, contributing to sustained adoption among both K–12 and higher education segments.
Oracle Corporation: Oracle Corporation functions as a key challenger in the global predictive analytics in EdTech market, leveraging its data management, AI, and cloud infrastructure to support academic transformation. Oracle’s Higher Education Cloud platform combines predictive analytics, student lifecycle management, and institutional performance tracking to help universities make data-driven decisions. In 2025, Oracle continues to focus on developing modular applications that integrate analytics with student information systems and digital curricula, positioning itself as a comprehensive vendor for educational digital infrastructure. The company’s regional growth is most notable in North America and the Middle East, where universities are adopting end-to-end analytics to manage academic operations. Oracle’s competitive strength lies in its deep expertise in enterprise data security and integration across hybrid IT environments, enabling large institutions to manage predictive models at scale with high reliability and transparency.
Market Key Players
Oracle Corporation
Instructure, Inc.
SAS Institute Inc.
IBM Corporation
Blackboard Inc.
Salesforce
Google LLC
D2L Corporation
Microsoft Corporation
Other Major Players
Driver
Personalized Learning Accelerates Adoption of Predictive Analytics
The growth of personalized learning frameworks is a key driver for the development of predictive analytics in the EdTech market as of 2025. Educational institutions are increasingly using analytics platforms to customize instruction. They rely on real-time insights into student progress, engagement, and learning behaviors. These systems help educators identify individual learning patterns and adjust content delivery, pacing, and assessment methods. This leads to measurable improvements in academic outcomes and student retention.
Adaptive Learning Platforms Show Measurable Performance Gains
Adaptive learning systems from leading providers like DreamBox Learning and Knewton have reported improvements in student performance metrics of up to 20%. This success is achieved through continuous feedback loops and predictive modeling. As education systems move towards individualized digital learning environments, predictive analytics is becoming essential for curriculum design, instructional planning, and long-term academic strategies at scale.
Restraint
Data Privacy and Cybersecurity Risks Limit Institutional Adoption
Concerns about data protection and cybersecurity continue to restrict market growth. Educational institutions handle large amounts of sensitive personal, behavioral, and academic information. This makes them attractive targets for cyber threats. In 2025, global audits show that nearly 80% of EdTech vendors collect personally identifiable student data, often without strong consent and governance structures. This increases the risk for institutions.
The lack of strong data governance limits adoption, especially in regions with strict regulations like GDPR and COPPA. Institutions and solution providers must invest in encryption, anonymization, and compliance systems to reduce legal and reputational risks. These additional costs and complexities can delay deployment timelines and hinder short-term market growth, particularly for smaller or resource-limited education systems.
Opportunity
Early Identification of At-Risk Students Promotes High-Impact Use Cases
Early detection and intervention for at-risk students present significant growth opportunities in the EdTech analytics landscape. Educational institutions are using predictive models to analyze attendance, digital engagement, and academic performance. This helps to forecast dropout risks or learning gaps. This proactive approach allows for timely academic and behavioral support that improves student success.
Programs like the predictive student success system at Georgia State University have reduced dropout rates by over 20%. This shows a strong return on investment for analytics-driven interventions. As global education systems shift to outcomes-based accountability, investment in predictive analytics for student retention and performance improvement is expected to increase. The at-risk student analytics segment is projected to grow at a compound annual growth rate exceeding 25% from 2025 to 2034.
As of 2025, real-time analytics and AI insights are changing how educational data is used in institutions. Modern predictive analytics platforms incorporate machine learning and natural language processing to assess student engagement through written communication, discussion participation, and assessment behavior. This enables more detailed and timely insights into learning progress.
Companies like Civitas Learning and IBM Watson Education are developing solutions that combine academic and behavioral data for precise forecasting and personalized course suggestions. Integrating these tools into cloud-based learning management systems offers educators instant performance dashboards. This boosts responsiveness and operational efficiency. The move to AI-assisted, real-time decision-making is changing how performance is measured and is setting new standards across the global EdTech landscape.
Recent Developments
Dec 2024 - Pearson: Pearson released its End of Year AI Report showing AI sessions in MyLab and Mastering rose 95% from fall 2023 to fall 2024; earlier in 2024 it expanded AI study tools internationally across multiple titles to reach tens of thousands of students. The adoption signal strengthens the case for embedding predictive learning analytics across Pearson’s platforms to drive retention and outcomes.
Jan 2025 - PowerSchool: PowerSchool introduced Risk Analysis, a K-12 early warning system with district-specific machine-learning models and probability scores to identify students at risk; the company supports over 50 million students globally. This deepens PowerSchool’s role as a core platform for predictive student success and MTSS decisioning in K-12 districts.
Jan 2025 - UK Department for Education: At Bett 2025, the Education Secretary announced £1 million funding to 16 developers for AI-supported marking and feedback and introduced AI safety expectations for schools. The policy and funding signal accelerates supplier alignment on safe, analytics-ready AI that you can deploy with clearer guidance in the UK market.
Apr 2025 - Anthology: Anthology released Reach 2025.1 with faster CRM–Student data syncs, including group updates every 15 minutes and improved duplicate prevention to support timely, proactive outreach. The upgrade tightens the data fabric required for predictive engagement, enrollment, and retention use cases across the student lifecycle.
Jul 2025 - Anthology: At Anthology Together 2025, the company highlighted an AI-embedded suite across the student journey and unveiled Ava, a virtual assistant, alongside data and migration tools such as Illuminate aimed at streamlining analytics operations. The integrated roadmap positions Anthology to deliver predictive insights at scale across recruitment, learning, and advancement.