Predictive & Personalized Medicine Market Size | 9.4% CAGR
Global Predictive & Personalized Medicine Market Size, Share & Analysis By Product (Personalized Medicine Therapeutics, Personalized Medicine Diagnostics, Personalized Medical Care, Personalized Nutrition & Wellness), By Application (Oncology, Infectious disease, Neurology or Psychiatry, Cardiovascular), By End-User (Diagnostic Centers, Hospitals & Clinics) Industry Regions & Key Players – Precision Healthcare Trends, Clinical Outcomes & Forecast 2025–2034
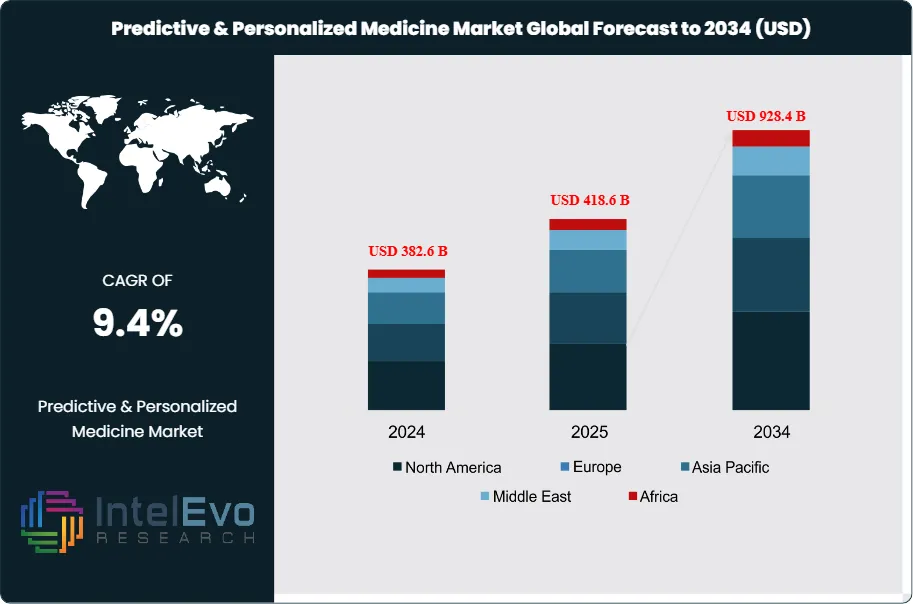
The Predictive & Personalized Medicine Market is valued at approximately USD 382.6 billion in 2024 and is projected to reach nearly USD 928.4 billion by 2034, growing at a strong CAGR of about 9.4% from 2025–2034. This expansion is fueled by rapid adoption of genomic profiling, AI-driven diagnostics, liquid biopsies, and targeted therapeutics across global healthcare systems. As hospitals shift from reactive treatment to precision-based prevention, demand for personalized care pathways is rising sharply. With biopharma companies accelerating investments in biomarker-based drug development and governments supporting national genomics programs, the sector is gaining massive visibility across healthcare, biotech, and innovation platforms.
This growth trajectory reflects a fundamental transformation in healthcare delivery, driven by the increasing adoption of tailored therapeutic approaches that integrate genomics, data analytics, and precision diagnostics. Over the past decade, personalized medicine has moved from concept to practice, with a marked acceleration in the deployment of genomic profiling tools, companion diagnostics, and patient-specific therapies. In particular, oncology, neurology, and rare disease treatments have witnessed significant breakthroughs powered by predictive analytics and individualized intervention models.
Key drivers fueling this market expansion include rising patient demand for more accurate, efficient, and minimally invasive treatments, coupled with an upsurge in chronic disease prevalence globally. On the supply side, advancements in next-generation sequencing (NGS), biomarker discovery, and bioinformatics are enabling more refined patient stratification and faster drug development cycles. Furthermore, healthcare systems are increasingly embracing value-based care, wherein personalized medicine plays a pivotal role in improving clinical outcomes and reducing long-term treatment costs.
Nonetheless, market growth faces notable challenges, such as high implementation costs, regulatory complexities, and data privacy concerns. Ensuring interoperability among healthcare platforms and securing patient genomic data remain critical hurdles for widespread adoption. In addition, disparities in access across emerging economies may limit the global scalability of personalized medical interventions.
Technological innovations continue to reshape the landscape, particularly through AI-driven diagnostic platforms, machine learning-based risk prediction models, and CRISPR gene-editing technologies. These tools are enhancing early disease detection, therapy customization, and real-time treatment monitoring, positioning predictive and personalized medicine as a cornerstone of next-generation healthcare.
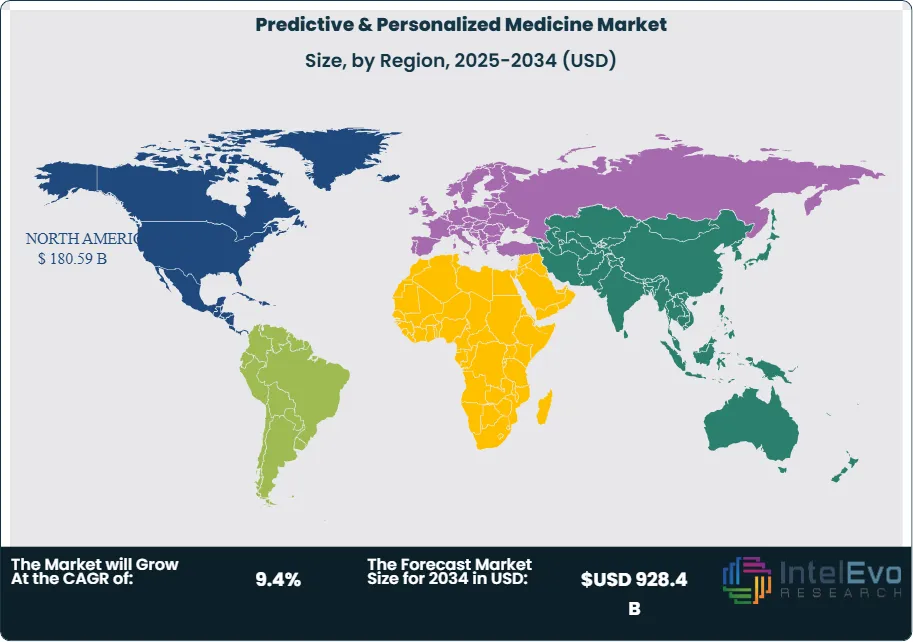
Regionally, North America dominates the market due to its robust R&D infrastructure, favorable reimbursement frameworks, and strong presence of biopharmaceutical giants. Europe follows closely, while Asia-Pacific emerges as the fastest-growing region, propelled by increasing healthcare investments in China, India, and Japan. Investors are closely watching biotechnology hubs, academic-industry collaborations, and digital health startups that promise scalable, cost-efficient personalized care solutions.
Key Takeaways
Market Growth: The global Predictive & Personalized Medicine market was valued at USD 382.6 billion in 2024 and is projected to reach USD 928.4 billion by 2034, expanding at a CAGR of9.4% driven by rising demand for precision diagnostics and individualized therapies.
Product Type: The personalized nutrition & wellness segment captured the largest share in 2023, supported by strong consumer adoption of DNA-based diet planning, wearable health monitoring, and lifestyle-driven preventive healthcare solutions.
Application: Oncology accounted for the leading application segment, propelled by the widespread use of genomic profiling and companion diagnostics in cancer treatment, with personalized oncology therapies representing one of the fastest-growing therapeutic areas.
End Use: Hospitals & clinics generated the highest revenue share, owing to high procedural volumes, integration of genomic testing into routine care, and expanding use of AI-driven diagnostic tools in clinical workflows.
Driver: Rapid advances in next-generation sequencing (NGS) and biomarker discovery have significantly reduced turnaround times and costs, enabling faster drug development cycles and more refined patient stratification.
Restraint: High implementation costs and data privacy concerns remain barriers to adoption, particularly in emerging markets where healthcare infrastructure and regulatory frameworks are less developed.
Opportunity: The Asia-Pacific region is the fastest-growing market, with healthcare investments in China, India, and Japan projected to accelerate adoption, positioning the region for double-digit CAGR growth through 2032.
Trend: Integration of AI-powered diagnostics, machine learning-based risk prediction models, and CRISPR gene-editing technologies is reshaping personalized medicine, with leading biopharma players forming cross-sector partnerships to scale innovation.
Regional Analysis: North America led the market with a 47.2% share in 2022, supported by strong R&D infrastructure and reimbursement policies, while Europe follows closely. Asia-Pacific is emerging as the fastest-growing region, driven by biotechnology hubs and digital health adoption.
Type Analysis
The personalized nutrition & wellness segment continues to command the largest share of the predictive and personalized medicine market as of 2025. Growing consumer demand for lifestyle-focused interventions, combined with advances in genomics and digital health monitoring, has positioned this category as a key revenue driver. DNA-based diet plans, microbiome analysis, and wearable-enabled health tracking are increasingly being integrated into mainstream healthcare and preventive medicine, creating strong market momentum.
Looking forward, personalized medicine therapeutics is expected to capture an expanding proportion of overall market revenues. The segment is benefiting from significant advancements in targeted cancer treatments, immunotherapies, and companion diagnostics. Regulatory approvals such as the FDA’s clearance of Gallium 68 PSMA-11 for prostate cancer PET imaging highlight the sector’s rapid progress. With major pharmaceutical players investing heavily in biomarker-driven drug development and precision oncology pipelines, therapeutics are projected to lead the market in value generation over the next decade.
Application Analysis
Oncology remains the dominant application area, accounting for the highest share of market revenues in 2025. The global burden of cancer, coupled with a surge in genomic profiling, liquid biopsy adoption, and nuclear medicine imaging, is fueling demand. Oncology-related diagnostic procedures, particularly PET and molecular imaging, represent some of the most frequently performed personalized medicine applications worldwide.
Beyond oncology, applications in infectious diseases, neurology, and cardiovascular care are gaining traction. The COVID-19 pandemic accelerated adoption of personalized diagnostic tools, particularly in infectious disease management, while neurology and psychiatry are seeing increased focus on predictive analytics for conditions such as Alzheimer’s and depression. A strong pipeline of targeted therapies and companion diagnostics across multiple disease areas is expected to diversify application demand and reduce the historical dominance of oncology over the long term.
End-Use Analysis
Hospitals and clinics are projected to remain the largest end-use segment, supported by their role in managing high procedural volumes, integrating genomic sequencing into patient care, and adopting AI-powered diagnostic systems. With healthcare providers shifting toward value-based care models, hospitals are increasingly embedding precision medicine into treatment pathways, improving both patient outcomes and cost efficiency.
Diagnostic centers are expected to record the fastest CAGR through 2032. Growth is being fueled by the rapid expansion of imaging and molecular diagnostic facilities, particularly in Europe and Asia-Pacific. The surge in outpatient testing, coupled with advancements in NGS-based diagnostics, has made diagnostic centers pivotal to the scaling of personalized medicine. As payers and health systems push for cost-effective diagnostic solutions, specialized diagnostic providers are expected to gain strategic importance in the market ecosystem.
Regional Analysis
North America leads the global market, holding nearly half of total revenues in 2025, driven by robust R&D infrastructure, favorable reimbursement policies, and strong penetration of personalized oncology therapies. The United States in particular benefits from a mature biopharmaceutical ecosystem and extensive clinical adoption of predictive diagnostics. Strategic collaborations between industry and academic institutions further reinforce the region’s leadership.
Europe follows as the second-largest market, supported by strong regulatory frameworks for companion diagnostics and growing investments in genomic research across Germany, the U.K., and France. Meanwhile, Asia-Pacific is emerging as the fastest-growing region, with healthcare investments in China, India, and Japan accelerating adoption of personalized medicine technologies. Government initiatives in genomics, rising prevalence of chronic diseases, and the scaling of biotechnology hubs are positioning the region for double-digit CAGR growth through 2032.
In contrast, Latin America and the Middle East & Africa present gradual but steady adoption opportunities. While high treatment costs and limited infrastructure remain barriers, increasing private investment in diagnostic capabilities and expanding access to advanced therapeutics are expected to drive incremental growth in these emerging markets.
By Product (Personalized Medicine Therapeutics, Personalized Medicine Diagnostics, Personalized Medical Care, Personalized Nutrition & Wellness), By Application (Oncology, Infectious disease, Neurology or Psychiatry, Cardiovascular, Other Applications), By End-User (Diagnostic Centers, Hospitals & Clinics, Other End-Users)
Research Methodology
Primary Research- 100 Interviews of Stakeholders
Secondary Research
Desk Research
Regional scope
North America (United States, Canada, Mexico)
Latin America (Brazil, Argentina, Columbia)
East Asia And Pacific (China, Japan, South Korea, Australia, Cambodia, Fiji, Indonesia)
Sea And South Asia (India, Singapore, Thailand, Taiwan, Malaysia)
Eastern Europe (Poland, Russia, Czech Republic, Romania)
Western Europe (Germany, U.K., France, Spain, Itlay)
Middle East & Africa (GCC Countries, Egypt, Nigeria, South Africa, Israel)
Customization for segments, region/country-level will be provided. Moreover, additional customization can be done based on the requirements.
Pricing and Purchase Options
Avail customized purchase options to meet your exact research needs. We have three licenses to opt for: Single User License, Multi-User License (Up to 5 Users), Corporate Use License (Unlimited User and Printable PDF).
TABLE OF CONTENTS
1. EXECUTIVE SUMMARY
1.1. MARKET SNAPSHOT
1.2. KEY FINDINGS & INSIGHTS
1.3. ANALYST RECOMMENDATIONS
1.4. FUTURE OUTLOOK
2. RESEARCH METHODOLOGY
2.1. MARKET DEFINITION & SCOPE
2.2. RESEARCH OBJECTIVES: PRIMARY & SECONDARY DATA SOURCES
2.3. DATA COLLECTION SOURCES
2.3.1. COVERAGE OF 100+ PRIMARY RESEARCH/CONSULTATION CALLS WITH INDUSTRY STAKEHOLDERS
FIGURE 17 NORTH AMERICA PREDICTIVE & PERSONALIZED MEDICINE CURRENT AND FUTURE TYPE ANALYSIS, 2025–2034, (USD MILLION)
FIGURE 18 NORTH AMERICA PREDICTIVE & PERSONALIZED MEDICINE CURRENT AND FUTURE END USER ANALYSIS, 2025–2034, (USD MILLION)
FIGURE 19 MARKET SHARE BY COUNTRY
FIGURE 20 LATIN AMERICA PREDICTIVE & PERSONALIZED MEDICINE CURRENT AND FUTURE TYPE ANALYSIS, 2025–2034, (USD MILLION)
FIGURE 21 LATIN AMERICA PREDICTIVE & PERSONALIZED MEDICINE CURRENT AND FUTURE END USER ANALYSIS, 2025–2034, (USD MILLION)
FIGURE 22 MARKET SHARE BY COUNTRY
FIGURE 23 EASTERN EUROPE PREDICTIVE & PERSONALIZED MEDICINE CURRENT AND FUTURE TYPE ANALYSIS, 2025–2034, (USD MILLION)
FIGURE 24 EASTERN EUROPE PREDICTIVE & PERSONALIZED MEDICINE CURRENT AND FUTURE END USER ANALYSIS, 2025–2034, (USD MILLION)
FIGURE 25 MARKET SHARE BY COUNTRY
FIGURE 26 WESTERN EUROPE PREDICTIVE & PERSONALIZED MEDICINE CURRENT AND FUTURE TYPE ANALYSIS, 2025–2034, (USD MILLION)
FIGURE 27 WESTERN EUROPE PREDICTIVE & PERSONALIZED MEDICINE CURRENT AND FUTURE END USER ANALYSIS, 2025–2034, (USD MILLION)
FIGURE 28 MARKET SHARE BY COUNTRY
FIGURE 29 EAST ASIA AND PACIFIC PREDICTIVE & PERSONALIZED MEDICINE CURRENT AND FUTURE TYPE ANALYSIS, 2025–2034, (USD MILLION)
FIGURE 30 EAST ASIA AND PACIFIC PREDICTIVE & PERSONALIZED MEDICINE CURRENT AND FUTURE END USER ANALYSIS, 2025–2034, (USD MILLION)
FIGURE 31 MARKET SHARE BY COUNTRY
FIGURE 32 SEA AND SOUTH ASIA PREDICTIVE & PERSONALIZED MEDICINE CURRENT AND FUTURE TYPE ANALYSIS, 2025–2034, (USD MILLION)
FIGURE 33 SEA AND SOUTH ASIA PREDICTIVE & PERSONALIZED MEDICINE CURRENT AND FUTURE END USER ANALYSIS, 2025–2034, (USD MILLION)
FIGURE 34 MARKET SHARE BY COUNTRY
FIGURE 35 MIDDLE EAST AND AFRICA PREDICTIVE & PERSONALIZED MEDICINE CURRENT AND FUTURE TYPE ANALYSIS, 2025–2034, (USD MILLION)
FIGURE 36 MIDDLE EAST AND AFRICA PREDICTIVE & PERSONALIZED MEDICINE CURRENT AND FUTURE END USER ANALYSIS, 2025–2034, (USD MILLION)
FIGURE 37 NORTH AMERICA PREDICTIVE & PERSONALIZED MEDICINE CURRENT AND FUTURE MARKET VOLUME SHARE REGIONAL ANALYSIS, 2025–2034, (USD MILLION)
FIGURE 38 U.S. PREDICTIVE & PERSONALIZED MEDICINE CURRENT AND FUTURE TYPE ANALYSIS, 2025–2034, (USD MILLION)
FIGURE 39 U.S. PREDICTIVE & PERSONALIZED MEDICINE CURRENT AND FUTURE END USER ANALYSIS, 2025–2034, (USD MILLION)
FIGURE 40 CANADA PREDICTIVE & PERSONALIZED MEDICINE CURRENT AND FUTURE TYPE ANALYSIS, 2025–2034, (USD MILLION)
FIGURE 41 CANADA PREDICTIVE & PERSONALIZED MEDICINE CURRENT AND FUTURE END USER ANALYSIS, 2025–2034, (USD MILLION)
FIGURE 42 LATIN AMERICA PREDICTIVE & PERSONALIZED MEDICINE CURRENT AND FUTURE MARKET VOLUME SHARE REGIONAL ANALYSIS, 2025–2034, (USD MILLION)
FIGURE 43 MEXICO PREDICTIVE & PERSONALIZED MEDICINE CURRENT AND FUTURE TYPE ANALYSIS, 2025–2034, (USD MILLION)
FIGURE 44 MEXICO PREDICTIVE & PERSONALIZED MEDICINE CURRENT AND FUTURE END USER ANALYSIS, 2025–2034, (USD MILLION)
FIGURE 45 BRAZIL PREDICTIVE & PERSONALIZED MEDICINE CURRENT AND FUTURE TYPE ANALYSIS, 2025–2034, (USD MILLION)
FIGURE 46 BRAZIL PREDICTIVE & PERSONALIZED MEDICINE CURRENT AND FUTURE END USER ANALYSIS, 2025–2034, (USD MILLION)
FIGURE 47 ARGENTINA PREDICTIVE & PERSONALIZED MEDICINE CURRENT AND FUTURE TYPE ANALYSIS, 2025–2034, (USD MILLION)
FIGURE 48 ARGENTINA PREDICTIVE & PERSONALIZED MEDICINE CURRENT AND FUTURE END USER ANALYSIS, 2025–2034, (USD MILLION)
FIGURE 49 COLUMBIA PREDICTIVE & PERSONALIZED MEDICINE CURRENT AND FUTURE TYPE ANALYSIS, 2025–2034, (USD MILLION)
FIGURE 50 COLUMBIA PREDICTIVE & PERSONALIZED MEDICINE CURRENT AND FUTURE END USER ANALYSIS, 2025–2034, (USD MILLION)
FIGURE 51 REST OF LATIN AMERICA PREDICTIVE & PERSONALIZED MEDICINE CURRENT AND FUTURE TYPE ANALYSIS, 2025–2034, (USD MILLION)
FIGURE 52 REST OF LATIN AMERICA PREDICTIVE & PERSONALIZED MEDICINE CURRENT AND FUTURE END USER ANALYSIS, 2025–2034, (USD MILLION)
FIGURE 53 EASTERN EUROPE PREDICTIVE & PERSONALIZED MEDICINE CURRENT AND FUTURE MARKET VOLUME SHARE REGIONAL ANALYSIS, 2025–2034, (USD MILLION)
FIGURE 54 POLAND PREDICTIVE & PERSONALIZED MEDICINE CURRENT AND FUTURE TYPE ANALYSIS, 2025–2034, (USD MILLION)
FIGURE 55 POLAND PREDICTIVE & PERSONALIZED MEDICINE CURRENT AND FUTURE END USER ANALYSIS, 2025–2034, (USD MILLION)
FIGURE 56 RUSSIA PREDICTIVE & PERSONALIZED MEDICINE CURRENT AND FUTURE TYPE ANALYSIS, 2025–2034, (USD MILLION)
FIGURE 57 RUSSIA PREDICTIVE & PERSONALIZED MEDICINE CURRENT AND FUTURE END USER ANALYSIS, 2025–2034, (USD MILLION)
FIGURE 58 CZECH REPUBLIC PREDICTIVE & PERSONALIZED MEDICINE CURRENT AND FUTURE TYPE ANALYSIS, 2025–2034, (USD MILLION)
FIGURE 59 CZECH REPUBLIC PREDICTIVE & PERSONALIZED MEDICINE CURRENT AND FUTURE END USER ANALYSIS, 2025–2034, (USD MILLION)
FIGURE 60 ROMANIA PREDICTIVE & PERSONALIZED MEDICINE CURRENT AND FUTURE TYPE ANALYSIS, 2025–2034, (USD MILLION)
FIGURE 61 ROMANIA PREDICTIVE & PERSONALIZED MEDICINE CURRENT AND FUTURE END USER ANALYSIS, 2025–2034, (USD MILLION)
FIGURE 62 REST OF EASTERN EUROPE PREDICTIVE & PERSONALIZED MEDICINE CURRENT AND FUTURE TYPE ANALYSIS, 2025–2034, (USD MILLION)
FIGURE 63 REST OF EASTERN EUROPE PREDICTIVE & PERSONALIZED MEDICINE CURRENT AND FUTURE END USER ANALYSIS, 2025–2034, (USD MILLION)
FIGURE 64 WESTERN EUROPE PREDICTIVE & PERSONALIZED MEDICINE CURRENT AND FUTURE MARKET VOLUME SHARE REGIONAL ANALYSIS, 2025–2034, (USD MILLION)
FIGURE 65 GERMANY PREDICTIVE & PERSONALIZED MEDICINE CURRENT AND FUTURE TYPE ANALYSIS, 2025–2034, (USD MILLION)
FIGURE 66 GERMANY PREDICTIVE & PERSONALIZED MEDICINE CURRENT AND FUTURE END USER ANALYSIS, 2025–2034, (USD MILLION)
FIGURE 67 FRANCE PREDICTIVE & PERSONALIZED MEDICINE CURRENT AND FUTURE TYPE ANALYSIS, 2025–2034, (USD MILLION)
FIGURE 68 FRANCE PREDICTIVE & PERSONALIZED MEDICINE CURRENT AND FUTURE END USER ANALYSIS, 2025–2034, (USD MILLION)
FIGURE 69 UK PREDICTIVE & PERSONALIZED MEDICINE CURRENT AND FUTURE TYPE ANALYSIS, 2025–2034, (USD MILLION)
FIGURE 70 UK PREDICTIVE & PERSONALIZED MEDICINE CURRENT AND FUTURE END USER ANALYSIS, 2025–2034, (USD MILLION)
FIGURE 71 SPAIN PREDICTIVE & PERSONALIZED MEDICINE CURRENT AND FUTURE TYPE ANALYSIS, 2025–2034, (USD MILLION)
FIGURE 72 SPAIN PREDICTIVE & PERSONALIZED MEDICINE CURRENT AND FUTURE END USER ANALYSIS, 2025–2034, (USD MILLION)
FIGURE 73 ITALY PREDICTIVE & PERSONALIZED MEDICINE CURRENT AND FUTURE TYPE ANALYSIS, 2025–2034, (USD MILLION)
FIGURE 74 ITALY PREDICTIVE & PERSONALIZED MEDICINE CURRENT AND FUTURE END USER ANALYSIS, 2025–2034, (USD MILLION)
FIGURE 75 REST OF WESTERN EUROPE PREDICTIVE & PERSONALIZED MEDICINE CURRENT AND FUTURE TYPE ANALYSIS, 2025–2034, (USD MILLION)
FIGURE 76 REST OF WESTERN EUROPE PREDICTIVE & PERSONALIZED MEDICINE CURRENT AND FUTURE END USER ANALYSIS, 2025–2034, (USD MILLION)
FIGURE 77 EAST ASIA AND PACIFIC PREDICTIVE & PERSONALIZED MEDICINE CURRENT AND FUTURE MARKET VOLUME SHARE REGIONAL ANALYSIS, 2025–2034, (USD MILLION)
FIGURE 78 CHINA PREDICTIVE & PERSONALIZED MEDICINE CURRENT AND FUTURE TYPE ANALYSIS, 2025–2034, (USD MILLION)
FIGURE 79 CHINA PREDICTIVE & PERSONALIZED MEDICINE CURRENT AND FUTURE END USER ANALYSIS, 2025–2034, (USD MILLION)
FIGURE 80 JAPAN PREDICTIVE & PERSONALIZED MEDICINE CURRENT AND FUTURE TYPE ANALYSIS, 2025–2034, (USD MILLION)
FIGURE 81 JAPAN PREDICTIVE & PERSONALIZED MEDICINE CURRENT AND FUTURE END USER ANALYSIS, 2025–2034, (USD MILLION)
FIGURE 82 AUSTRALIA PREDICTIVE & PERSONALIZED MEDICINE CURRENT AND FUTURE TYPE ANALYSIS, 2025–2034, (USD MILLION)
FIGURE 83 AUSTRALIA PREDICTIVE & PERSONALIZED MEDICINE CURRENT AND FUTURE END USER ANALYSIS, 2025–2034, (USD MILLION)
FIGURE 84 CAMBODIA PREDICTIVE & PERSONALIZED MEDICINE CURRENT AND FUTURE TYPE ANALYSIS, 2025–2034, (USD MILLION)
FIGURE 85 CAMBODIA PREDICTIVE & PERSONALIZED MEDICINE CURRENT AND FUTURE END USER ANALYSIS, 2025–2034, (USD MILLION)
FIGURE 86 FIJI PREDICTIVE & PERSONALIZED MEDICINE CURRENT AND FUTURE TYPE ANALYSIS, 2025–2034, (USD MILLION)
FIGURE 87 FIJI PREDICTIVE & PERSONALIZED MEDICINE CURRENT AND FUTURE END USER ANALYSIS, 2025–2034, (USD MILLION)
FIGURE 88 INDONESIA PREDICTIVE & PERSONALIZED MEDICINE CURRENT AND FUTURE TYPE ANALYSIS, 2025–2034, (USD MILLION)
FIGURE 89 INDONESIA PREDICTIVE & PERSONALIZED MEDICINE CURRENT AND FUTURE END USER ANALYSIS, 2025–2034, (USD MILLION)
FIGURE 90 SOUTH KOREA PREDICTIVE & PERSONALIZED MEDICINE CURRENT AND FUTURE TYPE ANALYSIS, 2025–2034, (USD MILLION)
FIGURE 91 SOUTH KOREA PREDICTIVE & PERSONALIZED MEDICINE CURRENT AND FUTURE END USER ANALYSIS, 2025–2034, (USD MILLION)
FIGURE 92 REST OF EAST ASIA AND PACIFIC PREDICTIVE & PERSONALIZED MEDICINE CURRENT AND FUTURE TYPE ANALYSIS, 2025–2034, (USD MILLION)
FIGURE 93 REST OF EAST ASIA AND PACIFIC PREDICTIVE & PERSONALIZED MEDICINE CURRENT AND FUTURE END USER ANALYSIS, 2025–2034, (USD MILLION)
FIGURE 94 SEA AND SOUTH ASIA PREDICTIVE & PERSONALIZED MEDICINE CURRENT AND FUTURE MARKET VOLUME SHARE REGIONAL ANALYSIS, 2025–2034, (USD MILLION)
FIGURE 95 BANGLADESH PREDICTIVE & PERSONALIZED MEDICINE CURRENT AND FUTURE TYPE ANALYSIS, 2025–2034, (USD MILLION)
FIGURE 96 BANGLADESH PREDICTIVE & PERSONALIZED MEDICINE CURRENT AND FUTURE END USER ANALYSIS, 2025–2034, (USD MILLION)
FIGURE 97 NEW ZEALAND PREDICTIVE & PERSONALIZED MEDICINE CURRENT AND FUTURE TYPE ANALYSIS, 2025–2034, (USD MILLION)
FIGURE 98 NEW ZEALAND PREDICTIVE & PERSONALIZED MEDICINE CURRENT AND FUTURE END USER ANALYSIS, 2025–2034, (USD MILLION)
FIGURE 99 INDIA PREDICTIVE & PERSONALIZED MEDICINE CURRENT AND FUTURE TYPE ANALYSIS, 2025–2034, (USD MILLION)
FIGURE 100 INDIA PREDICTIVE & PERSONALIZED MEDICINE CURRENT AND FUTURE END USER ANALYSIS, 2025–2034, (USD MILLION)
FIGURE 101 SINGAPORE PREDICTIVE & PERSONALIZED MEDICINE CURRENT AND FUTURE TYPE ANALYSIS, 2025–2034, (USD MILLION)
FIGURE 102 SINGAPORE PREDICTIVE & PERSONALIZED MEDICINE CURRENT AND FUTURE END USER ANALYSIS, 2025–2034, (USD MILLION)
FIGURE 103 THAILAND PREDICTIVE & PERSONALIZED MEDICINE CURRENT AND FUTURE TYPE ANALYSIS, 2025–2034, (USD MILLION)
FIGURE 104 THAILAND PREDICTIVE & PERSONALIZED MEDICINE CURRENT AND FUTURE END USER ANALYSIS, 2025–2034, (USD MILLION)
FIGURE 105 TAIWAN PREDICTIVE & PERSONALIZED MEDICINE CURRENT AND FUTURE TYPE ANALYSIS, 2025–2034, (USD MILLION)
FIGURE 106 TAIWAN PREDICTIVE & PERSONALIZED MEDICINE CURRENT AND FUTURE END USER ANALYSIS, 2025–2034, (USD MILLION)
FIGURE 107 MALAYSIA PREDICTIVE & PERSONALIZED MEDICINE CURRENT AND FUTURE TYPE ANALYSIS, 2025–2034, (USD MILLION)
FIGURE 108 MALAYSIA PREDICTIVE & PERSONALIZED MEDICINE CURRENT AND FUTURE END USER ANALYSIS, 2025–2034, (USD MILLION)
FIGURE 109 REST OF SEA AND SOUTH ASIA PREDICTIVE & PERSONALIZED MEDICINE CURRENT AND FUTURE TYPE ANALYSIS, 2025–2034, (USD MILLION)
FIGURE 110 REST OF SEA AND SOUTH ASIA PREDICTIVE & PERSONALIZED MEDICINE CURRENT AND FUTURE END USER ANALYSIS, 2025–2034, (USD MILLION)
FIGURE 111 MIDDLE EAST AND AFRICA PREDICTIVE & PERSONALIZED MEDICINE CURRENT AND FUTURE MARKET VOLUME SHARE REGIONAL ANALYSIS, 2025–2034, (USD MILLION)
FIGURE 112 GCC COUNTRIES PREDICTIVE & PERSONALIZED MEDICINE CURRENT AND FUTURE TYPE ANALYSIS, 2025–2034, (USD MILLION)
FIGURE 113 GCC COUNTRIES PREDICTIVE & PERSONALIZED MEDICINE CURRENT AND FUTURE END USER ANALYSIS, 2025–2034, (USD MILLION)
FIGURE 114 SAUDI ARABIA PREDICTIVE & PERSONALIZED MEDICINE CURRENT AND FUTURE TYPE ANALYSIS, 2025–2034, (USD MILLION)
FIGURE 115 SAUDI ARABIA PREDICTIVE & PERSONALIZED MEDICINE CURRENT AND FUTURE END USER ANALYSIS, 2025–2034, (USD MILLION)
FIGURE 116 UAE PREDICTIVE & PERSONALIZED MEDICINE CURRENT AND FUTURE TYPE ANALYSIS, 2025–2034, (USD MILLION)
FIGURE 117 UAE PREDICTIVE & PERSONALIZED MEDICINE CURRENT AND FUTURE END USER ANALYSIS, 2025–2034, (USD MILLION)
FIGURE 118 BAHRAIN PREDICTIVE & PERSONALIZED MEDICINE CURRENT AND FUTURE TYPE ANALYSIS, 2025–2034, (USD MILLION)
FIGURE 119 BAHRAIN PREDICTIVE & PERSONALIZED MEDICINE CURRENT AND FUTURE END USER ANALYSIS, 2025–2034, (USD MILLION)
FIGURE 120 KUWAIT PREDICTIVE & PERSONALIZED MEDICINE CURRENT AND FUTURE TYPE ANALYSIS, 2025–2034, (USD MILLION)
FIGURE 121 KUWAIT PREDICTIVE & PERSONALIZED MEDICINE CURRENT AND FUTURE END USER ANALYSIS, 2025–2034, (USD MILLION)
FIGURE 122 OMAN PREDICTIVE & PERSONALIZED MEDICINE CURRENT AND FUTURE TYPE ANALYSIS, 2025–2034, (USD MILLION)
FIGURE 123 OMAN PREDICTIVE & PERSONALIZED MEDICINE CURRENT AND FUTURE END USER ANALYSIS, 2025–2034, (USD MILLION)
FIGURE 124 QATAR PREDICTIVE & PERSONALIZED MEDICINE CURRENT AND FUTURE TYPE ANALYSIS, 2025–2034, (USD MILLION)
FIGURE 125 QATAR PREDICTIVE & PERSONALIZED MEDICINE CURRENT AND FUTURE END USER ANALYSIS, 2025–2034, (USD MILLION)
FIGURE 126 EGYPT PREDICTIVE & PERSONALIZED MEDICINE CURRENT AND FUTURE TYPE ANALYSIS, 2025–2034, (USD MILLION)
FIGURE 127 EGYPT PREDICTIVE & PERSONALIZED MEDICINE CURRENT AND FUTURE END USER ANALYSIS, 2025–2034, (USD MILLION)
FIGURE 128 NIGERIA PREDICTIVE & PERSONALIZED MEDICINE CURRENT AND FUTURE TYPE ANALYSIS, 2025–2034, (USD MILLION)
FIGURE 129 NIGERIA PREDICTIVE & PERSONALIZED MEDICINE CURRENT AND FUTURE END USER ANALYSIS, 2025–2034, (USD MILLION)
FIGURE 130 SOUTH AFRICA PREDICTIVE & PERSONALIZED MEDICINE CURRENT AND FUTURE TYPE ANALYSIS, 2025–2034, (USD MILLION)
FIGURE 131 SOUTH AFRICA PREDICTIVE & PERSONALIZED MEDICINE CURRENT AND FUTURE END USER ANALYSIS, 2025–2034, (USD MILLION)
FIGURE 132 ISRAEL PREDICTIVE & PERSONALIZED MEDICINE CURRENT AND FUTURE TYPE ANALYSIS, 2025–2034, (USD MILLION)
FIGURE 133 ISRAEL PREDICTIVE & PERSONALIZED MEDICINE CURRENT AND FUTURE END USER ANALYSIS, 2025–2034, (USD MILLION)
FIGURE 134 REST OF MEA PREDICTIVE & PERSONALIZED MEDICINE CURRENT AND FUTURE TYPE ANALYSIS, 2025–2034, (USD MILLION)
FIGURE 135 REST OF MEA PREDICTIVE & PERSONALIZED MEDICINE CURRENT AND FUTURE END USER ANALYSIS, 2025–2034, (USD MILLION)
FIGURE 136 U. S. MARKET SHARE ANALYSIS BY TYPE (2024)
FIGURE 137 U. S. MARKET SHARE ANALYSIS BY END USER (2024)
FIGURE 138 CANADA MARKET SHARE ANALYSIS BY TYPE (2024)
FIGURE 139 CANADA MARKET SHARE ANALYSIS BY END USER (2024)
FIGURE 140 MEXICO MARKET SHARE ANALYSIS BY TYPE (2024)
FIGURE 141 MEXICO MARKET SHARE ANALYSIS BY END USER (2024)
FIGURE 142 CHINA MARKET SHARE ANALYSIS BY TYPE (2024)
FIGURE 143 CHINA MARKET SHARE ANALYSIS BY END USER (2024)
FIGURE 144 JAPAN MARKET SHARE ANALYSIS BY TYPE (2024)
FIGURE 145 JAPAN MARKET SHARE ANALYSIS BY END USER (2024)
FIGURE 146 INDIA MARKET SHARE ANALYSIS BY TYPE (2024)
FIGURE 147 INDIA MARKET SHARE ANALYSIS BY END USER (2024)
FIGURE 148 SOUTH KOREA MARKET SHARE ANALYSIS BY TYPE (2024)
FIGURE 149 SOUTH KOREA MARKET SHARE ANALYSIS BY END USER (2024)
FIGURE 150 SAUDI ARABIA MARKET SHARE ANALYSIS BY TYPE (2024)
FIGURE 151 SAUDI ARABIA MARKET SHARE ANALYSIS BY END USER (2024)
FIGURE 152 UAE MARKET SHARE ANALYSIS BY TYPE (2024)
FIGURE 153 UAE MARKET SHARE ANALYSIS BY END USER (2024)
FIGURE 154 EGYPT MARKET SHARE ANALYSIS BY TYPE (2024)
FIGURE 155 EGYPT MARKET SHARE ANALYSIS BY END USER (2024)
FIGURE 156 NIGERIA MARKET SHARE ANALYSIS BY TYPE (2024)
FIGURE 157 NIGERIA MARKET SHARE ANALYSIS BY END USER (2024)
FIGURE 158 SOUTH AFRICA MARKET SHARE ANALYSIS BY TYPE (2024)
FIGURE 159 SOUTH AFRICA MARKET SHARE ANALYSIS BY END USER (2024)
FIGURE 160 GERMANY MARKET SHARE ANALYSIS BY TYPE (2024)
FIGURE 161 GERMANY MARKET SHARE ANALYSIS BY END USER (2024)
FIGURE 162 FRANCE MARKET SHARE ANALYSIS BY TYPE (2024)
FIGURE 163 FRANCE MARKET SHARE ANALYSIS BY END USER (2024)
FIGURE 164 UK MARKET SHARE ANALYSIS BY TYPE (2024)
FIGURE 165 UK MARKET SHARE ANALYSIS BY END USER (2024)
FIGURE 166 SPAIN MARKET SHARE ANALYSIS BY TYPE (2024)
FIGURE 167 SPAIN MARKET SHARE ANALYSIS BY END USER (2024)
FIGURE 168 ITALY MARKET SHARE ANALYSIS BY TYPE (2024)
FIGURE 169 ITALY MARKET SHARE ANALYSIS BY END USER (2024)
FIGURE 170 BRAZIL MARKET SHARE ANALYSIS BY TYPE (2024)
FIGURE 171 BRAZIL MARKET SHARE ANALYSIS BY END USER (2024)
FIGURE 172 ARGENTINA MARKET SHARE ANALYSIS BY TYPE (2024)
FIGURE 173 ARGENTINA MARKET SHARE ANALYSIS BY END USER (2024)
FIGURE 174 COLUMBIA MARKET SHARE ANALYSIS BY TYPE (2024)
FIGURE 175 COLUMBIA MARKET SHARE ANALYSIS BY END USER (2024)
FIGURE 176 GLOBAL PREDICTIVE & PERSONALIZED MEDICINE CURRENT AND FUTURE MARKET KEY COUNTRY LEVEL ANALYSIS, 2024–2034, (USD MILLION)
FIGURE 177 FINANCIAL OVERVIEW:
Key Player Analysis
GE Healthcare: GE Healthcare positions itself as a market leader in precision diagnostics, leveraging its global scale and advanced imaging portfolio. The company has been at the forefront of integrating AI-powered PET/CT and MRI scanners, enabling clinicians to capture real-time insights into oncology, cardiology, and neurological conditions. Its diagnostic platforms are increasingly paired with personalized treatment pathways, strengthening its role in predictive medicine.
Strategically, GE Healthcare has invested heavily in workflow automation and digital twin technologies, aligning with the broader healthcare digitalization trend. Recent collaborations with hospital networks and biotech firms emphasize data-driven clinical decision-making. By combining imaging excellence with predictive analytics, GE is reinforcing its position as a critical enabler of patient-specific treatment planning, particularly in high-growth regions such as Asia-Pacific.
Exact Sciences Corporation: Exact Sciences Corporation has emerged as a disruptor in the personalized medicine space, with a strong foothold in molecular diagnostics and oncology screening solutions. Its flagship product portfolio, including Cologuard for colorectal cancer detection and a growing pipeline of liquid biopsy tests, has significantly expanded the company’s global reach. In 2024, the firm reported double-digit revenue growth, fueled by rising adoption of non-invasive, DNA-based screening tools.
The company continues to strengthen its competitive positioning through R&D in multi-cancer early detection platforms and strategic acquisitions of biotech startups specializing in genomic assays. Its differentiator lies in delivering accessible, cost-efficient solutions that bridge the gap between population-scale screening and individualized treatment. By democratizing access to predictive oncology diagnostics, Exact Sciences is shaping early cancer detection as a mainstream healthcare practice by 2030.
Decode Genetics, Inc.: Decode Genetics, a subsidiary of Amgen, is widely regarded as an innovator in the predictive medicine ecosystem. Leveraging Iceland’s comprehensive genetic database, the company has developed a unique capability in population-wide genomics and rare disease mapping. Its work in linking genetic markers to disease predisposition has not only advanced personalized treatment models but also provided Amgen with a competitive edge in targeted drug development.
Decode’s differentiator lies in its unparalleled longitudinal genetic data, which underpins predictive algorithms for conditions such as Alzheimer’s, cardiovascular disease, and rare genetic disorders. Strategic collaborations with academic institutions and biotech companies continue to enhance its R&D pipeline. By turning population-level insights into individualized therapies, Decode Genetics exemplifies how data-intensive research can transform healthcare delivery and accelerate precision drug pipelines in the next decade.
Danaher Corporation: Danaher Corporation stands as a global leader in life sciences and diagnostics, with a diversified portfolio spanning genomics, molecular diagnostics, and bioprocessing. Through its subsidiaries such as Cepheid and Beckman Coulter, Danaher has established strong market penetration in clinical diagnostics, while its acquisition of Cytiva reinforced leadership in biopharmaceutical manufacturing solutions. By 2025, these platforms are deeply embedded in personalized medicine workflows, particularly in oncology and infectious disease diagnostics.
Danaher’s strategy is defined by continuous portfolio optimization and aggressive M&A activity, allowing it to capture growth across multiple segments of predictive and personalized healthcare. Its commitment to AI-enabled diagnostic automation and integrated bioinformatics differentiates it from competitors, enabling faster turnaround times and scalable solutions for healthcare providers. With a global presence and robust R&D investments, Danaher remains a pivotal player shaping the future of precision medicine infrastructure worldwide.
Market Key Players
Illumina, Inc.
Abbott
QIAGEN
Decode Genetics, Inc.
GE Healthcare
Danaher Corporation
Exact Sciences Corporation
ASURAGEN, INC.
Dako A/S
Other Key Players
Driver:
Chronic Disease Burden Accelerates Shift to Precision Medicine
As of 2025, the rising burden of chronic and rare diseases is accelerating adoption of predictive and personalized medicine. More than 400 million people globally live with rare disorders, many of which lack standardized treatments, making precision-based approaches essential. Advances in genomics, proteomics, and next-generation imaging—such as GE Healthcare’s latest AI-integrated PET/CT scanners—are enabling clinicians to tailor therapies more effectively to patient profiles.
Innovation in Diagnostics & Targeted Therapies Fuels Market Growth
Industry momentum is reinforced by a surge in product innovation, with pharmaceutical and diagnostic companies expanding their pipelines of companion diagnostics and targeted therapeutics. This innovation cycle not only addresses unmet medical needs but also creates new revenue streams for biopharma players, positioning personalized medicine as a central growth pillar for the healthcare sector through 2032.
Restraint:
Low Awareness & Reimbursement Gaps Limit Global Adoption
Despite strong growth drivers, the market faces structural barriers, particularly around awareness and reimbursement gaps. In developing economies, limited patient education and uneven adoption of advanced diagnostics slow penetration rates. Moreover, reimbursement frameworks for genomic testing and personalized therapies remain inconsistent, with many payers hesitant to cover high-cost procedures.
High Upfront Costs Create Access Divide in Emerging Markets
The result is a cost-access imbalance: while predictive diagnostics can significantly reduce long-term treatment expenses, upfront costs remain prohibitive for large segments of the global population. This challenge may restrict adoption in price-sensitive markets, creating a divide between high-income regions—where adoption is accelerating—and emerging economies, where uptake lags behind.
Opportunity:
Asia-Pacific Leads Rapid Expansion in Precision Healthcare
The fastest-growing opportunities lie in Asia-Pacific, where healthcare investments are scaling rapidly across China, India, and Japan. The region is projected to expand at a double-digit CAGR through 2032, fueled by government-led genomic initiatives, rising prevalence of cardiovascular and neurological disorders, and expanding biotechnology ecosystems.
AI-Enabled Diagnostics Unlock New Commercial Pathways
Beyond regional growth, the integration of AI-driven risk prediction models and real-time treatment monitoring tools presents new commercialization pathways. Companies that successfully combine digital health platforms with molecular diagnostics stand to capture a substantial share of the global market, particularly as payers and providers shift toward value-based care models that emphasize early intervention and cost efficiency.
Trend:
Radiopharmaceuticals & Gene Editing Redefine Precision Care
A defining trend shaping the 2025 landscape is the emergence of radiopharmaceutical and gene-editing pipelines as cornerstones of precision medicine. Targeted radionuclide therapies, particularly in oncology, are gaining traction due to their superior efficacy in treating metastatic cancers compared to conventional chemotherapy. For example, clinical adoption of theranostics combining Gallium-68 diagnostics with Lutetium-177 therapies is expanding rapidly across North America and Europe.
Convergence of AI, Imaging & Biotech Drives Next-Gen Therapies
At the same time, CRISPR-based gene editing and AI-enhanced drug discovery are pushing the boundaries of individualized therapy. This convergence of biotechnology, imaging, and digital intelligence is reshaping competitive strategies, with major pharma players entering cross-sector partnerships to accelerate commercialization. Investors are closely tracking companies that can integrate these disruptive technologies, as they are expected to define the next wave of market leadership in predictive and personalized medicine.
Recent Developments
Dec 2024 – GE Healthcare: Announced the launch of its AI-driven PET/CT platform, integrating real-time predictive analytics for oncology and cardiology imaging. The system is expected to reduce diagnostic turnaround times by 30%. This move reinforces GE’s leadership in precision imaging and strengthens its footprint in predictive diagnostics.
Feb 2025 – Exact Sciences Corporation: Completed the acquisition of a liquid biopsy startup valued at over USD 450 million, expanding its multi-cancer early detection pipeline. The acquisition broadens Exact Sciences’ molecular diagnostic portfolio and accelerates its push into non-invasive cancer screening markets.
Apr 2025 – Decode Genetics (Amgen): Partnered with the European Genomics Alliance to integrate Iceland’s population-scale genetic database with multi-country clinical trial networks. This collaboration enhances Decode’s influence in rare disease mapping and positions Amgen to lead in data-driven therapeutic development.
Jul 2025 – Danaher Corporation: Introduced an upgraded NGS-based companion diagnostics platform through its subsidiary Cepheid, enabling same-day genomic profiling for oncology patients. The launch strengthens Danaher’s role in precision oncology workflows and supports hospitals in accelerating personalized treatment decisions.
Sep 2025 – Roche Diagnostics: Announced a global partnership with Microsoft Azure to deploy cloud-based bioinformatics platforms for genomic data processing at scale. The initiative targets 20% faster sequencing analysis for hospitals and research centers worldwide. This partnership enhances Roche’s competitive edge in AI-enabled diagnostics and expands its reach into digital health ecosystems.