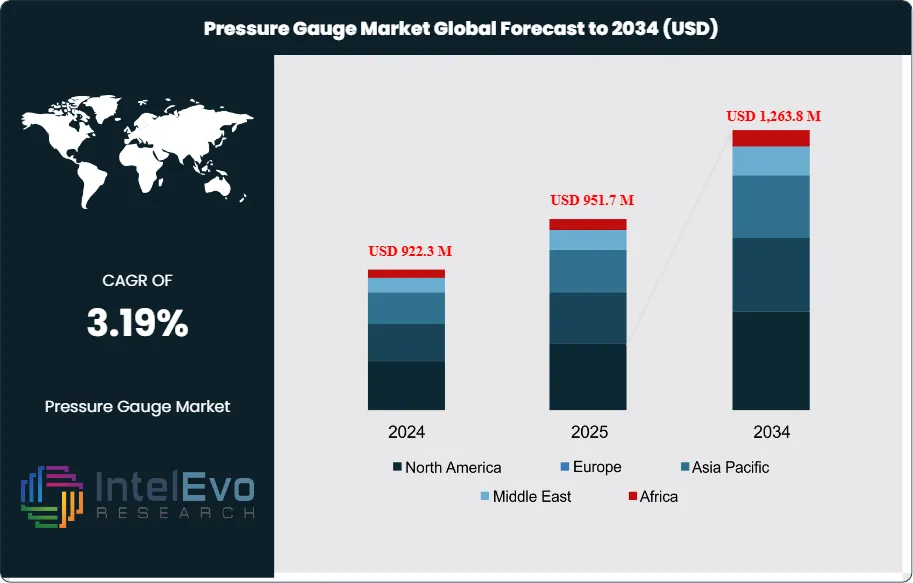
The Pressure Gauge Market was valued at USD 922.3 Million in 2024 and is estimated to reach approximately USD 951.7 Million in 2025. Driven by increasing demand for reliable pressure monitoring across industries such as oil & gas, manufacturing, power generation, and chemical processing, the market is projected to grow from about USD 982.0 Million in 2026 to nearly USD 1,263.8 Million by 2034, registering a compound annual growth rate (CAGR) of around 3.19% during the forecast period from 2026 to 2034.
Pressure gauges remain core to safe, compliant control of fluids and gases across oil and gas, manufacturing, automotive, aerospace, and process industries. Demand is rising as plants tighten tolerances, standardize maintenance, and expand instrumented assets. In 2024, oil and gas accounts for an estimated 28% of global revenue, followed by manufacturing at 24% and automotive and aerospace combined near 18%, with the balance spread across power, chemicals, water, and HVAC. Replacement cycles drive a large share of unit volumes, while new-build capacity supports value growth through higher-spec materials, certifications, and calibration requirements.
Market supply is concentrated among global instrument makers and specialized regional manufacturers, with price competition most visible in analog mechanical gauges. Input costs for stainless steel, specialty alloys, and bourdon-tube components influence margins, while lead times for electronics affect digital variants. Regulatory pressure acts as a structural tailwind. Safety and quality frameworks in oil and gas, chemicals, and pressure systems increasingly require verified accuracy, traceability, and periodic recalibration, which accelerates upgrades from older gauges to tighter-tolerance models. Key risks include capex cyclicality in heavy industry, counterfeit or low-grade imports that increase failure rates, and downtime exposure from calibration backlogs.
Technology is shifting the value pool toward digital and smart gauges. Digital formats are estimated at 22% of 2024 revenue and could approach 35% by 2034 as sites adopt IoT connectivity, automated diagnostics, and AI-assisted anomaly detection for early leak and overpressure signals. Automation programs also favor gauges that integrate with SCADA and asset-management platforms, reducing manual rounds and improving audit readiness. Energy-sector activity reinforces this trajectory: U.S. natural gas production rose 4% in 2023 to an average 125.0 billion cubic feet per day, and U.S. oil supply exceeded 20 million barrels per day, expanding measurement points across basins and midstream assets. Global crude output rose 5.4% in 2022, with growth centered in the Middle East, North America, and Latin America, supporting sustained instrument demand.
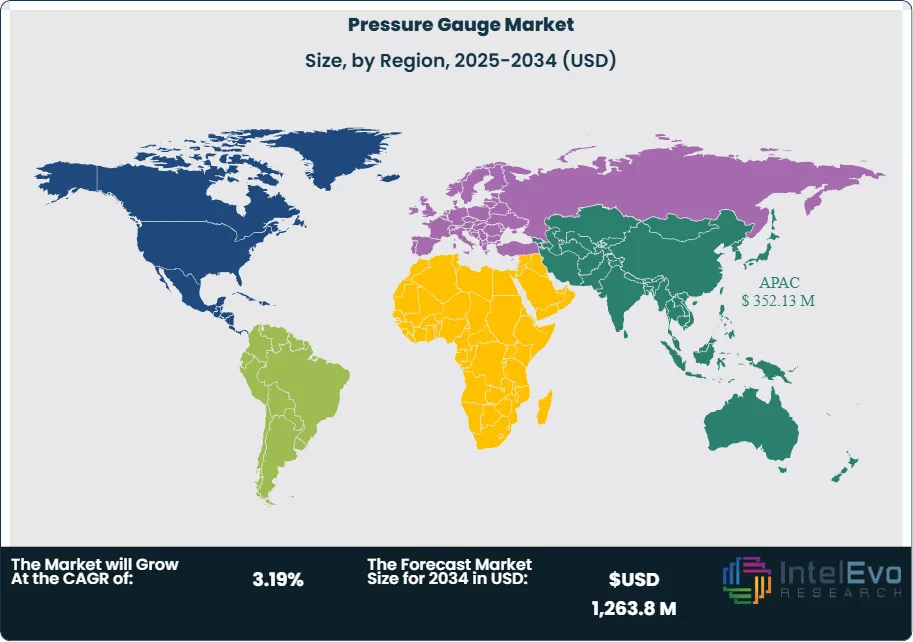
Regionally, Asia-Pacific leads with an estimated 38% share in 2024, supported by factory expansion and infrastructure buildout in China, India, and Southeast Asia. North America holds about 27% on the back of shale, LNG, and industrial retrofits, while Europe represents roughly 23% with strong compliance-driven replacement demand. Investment hotspots include U.S. Appalachia, Permian, and Haynesville, Middle East downstream and gas processing, and Latin American offshore developments, alongside fast-growing renewable applications such as hydrogen, biofuels, and grid-scale thermal systems.
Key Takeaways
Market Growth: The market expands from 0.9 billion USD, 2024 to 1.2 billion USD, 2034, at 3.19% CAGR, 2026-2034. It sustains steady demand across industrial instrumentation at estimated: 1.0 billion USD, 2029.
Segment Dominance : Asia-Pacific leads with 37.0% share, 2024 and anchors volume growth through industrial activity at estimated: 0.3 billion USD, 2024. It supports incremental demand at estimated: 0.1 billion USD, 2030.
Segment Dominance: Digital pressure gauges dominate with 57.0% share, 2024 and capture most upgrade budgets at estimated: 0.5 billion USD, 2024. Piezoresistive technology leads with 33.0% share, 2024 and drives standardized deployments at estimated: 0.3 billion USD, 2024.
Driver: IoT integration accelerates adoption of connected gauges at estimated: 45.0% of new installations, 2030. It improves monitoring frequency and supports asset programs at estimated: 20.0% efficiency uplift, 2030.
Restraint: Price pressure and replacement deferrals constrain premium uptake at estimated: 12.0% budget compression, 2024. Supply variability for electronics increases lead-time risk at estimated: 8.0 weeks, 2024.
Opportunity: Niche diversification and strategic collaborations expand addressable demand at estimated: 0.2 billion USD, 2034. OEM partnerships scale embedded sensing routes at estimated: 15.0% of shipments, 2032.
Trend: The market shifts toward smart, software-enabled gauges with estimated: 35.0% share, 2034. Digitalization strengthens remote diagnostics and predictive service at estimated: 25.0% fewer failures, 2033.
Regional Analysis: Asia-Pacific maintains the lead at 37.0% share, 2024, while North America and Europe scale compliance-driven upgrades at estimated: 28.0% share, 2024 and estimated: 23.0% share, 2024. Emerging industrial hubs lift growth outside mature regions at estimated: 0.4 billion USD, 2034.
By Type
Digital pressure gauges account for the majority of global demand as of 2025, representing approximately 57% of total market revenue. This dominance reflects sustained investment in automation, connected instrumentation, and real-time process visibility across energy, pharmaceuticals, food processing, and advanced manufacturing. Digital gauges deliver higher measurement resolution, onboard diagnostics, and seamless compatibility with control systems, which supports compliance, uptime, and predictive maintenance objectives. Adoption rates continue to rise as plants replace legacy equipment to meet tighter accuracy and reporting requirements.
Analog pressure gauges retain a material presence, accounting for roughly 43% of demand in 2025. These products remain preferred in harsh or remote environments where simplicity, mechanical robustness, and minimal power dependency are required. Utilities, basic manufacturing, and certain field operations continue to specify analog designs due to lower upfront cost and proven reliability. Growth in this segment remains modest and largely replacement-driven, with limited exposure to software-led upgrades.
Looking ahead, digital formats are expected to exceed 65% share by 2030 as IIoT penetration deepens and calibration intervals tighten. Suppliers increasingly prioritize digital portfolios to defend margins and align with long-term instrumentation roadmaps.
By Application
Aerospace and defense represent the largest application segment in 2025, supported by stringent certification standards and mission-critical performance requirements. Pressure gauges play a central role in aircraft systems, propulsion monitoring, hydraulics, and space platforms. Defense modernization programs and expanding commercial aircraft backlogs sustain steady demand, particularly for high-accuracy and temperature-stable designs.
Automotive and healthcare follow as secondary contributors. Automotive demand centers on engine testing, fluid systems, and validation environments rather than high-volume vehicle installation. Healthcare relies on pressure gauges for anesthesia systems, respiratory equipment, and diagnostic devices, where accuracy and regulatory compliance drive specification choices.
Other applications, including oil and gas, chemicals, utilities, and industrial processing, collectively represent a substantial revenue base. These sectors favor gauges that support continuous operation, hazardous-area certification, and remote monitoring as process control systems evolve.
By End-Use
Industrial buildings account for the majority of pressure gauge consumption, exceeding 60% share in 2025. Manufacturing plants, refineries, and power facilities rely on pressure measurement for safety, throughput control, and asset protection. Capital spending cycles and regulatory audits directly influence procurement volumes in this segment.
Commercial buildings represent a smaller but stable share, driven by HVAC systems, fire suppression, and energy management infrastructure. Demand tracks urban construction activity and retrofit programs focused on efficiency and compliance. Residential buildings contribute minimally, limited to specialized plumbing and utility monitoring applications.
Industrial end-use will continue to dominate through 2035, supported by energy transition projects, process electrification, and expansion of automated production facilities.
By Region
Asia Pacific leads the global pressure gauge market with an estimated 37% share in 2025. Rapid industrial expansion, infrastructure spending, and manufacturing scale in China, India, Japan, and Southeast Asia underpin sustained demand. Regional adoption of smart factories further accelerates digital gauge penetration.
North America and Europe remain mature but high-value markets, supported by strict safety standards and ongoing upgrades in oil and gas, aerospace, pharmaceuticals, and healthcare. Together, they account for approximately 45% of global revenue. Latin America and the Middle East & Africa show moderate growth, driven by energy, mining, and construction projects, though investment volatility tempers near-term expansion.
By Output Type (Analog, Digital), By Technology (Piezoresistive Pressure Gauge, Capacitive Pressure Gauge, Electromagnetic Pressure Gauge, Optical Pressure Gauge, Other Technologies), By Application (Aerospace and Defense, Automotive, Healthcare, Other Applications)
Research Methodology
Primary Research- 100 Interviews of Stakeholders
Secondary Research
Desk Research
Regional scope
North America (United States, Canada, Mexico)
Latin America (Brazil, Argentina, Columbia)
East Asia And Pacific (China, Japan, South Korea, Australia, Cambodia, Fiji, Indonesia)
Sea And South Asia (India, Singapore, Thailand, Taiwan, Malaysia)
Eastern Europe (Poland, Russia, Czech Republic, Romania)
Western Europe (Germany, U.K., France, Spain, Itlay)
Middle East & Africa (GCC Countries, Egypt, Nigeria, South Africa, Israel)
Customization for segments, region/country-level will be provided. Moreover, additional customization can be done based on the requirements.
Pricing and Purchase Options
Avail customized purchase options to meet your exact research needs. We have three licenses to opt for: Single User License, Multi-User License (Up to 5 Users), Corporate Use License (Unlimited User and Printable PDF).
TABLE OF CONTENTS
1. EXECUTIVE SUMMARY
1.1. MARKET SNAPSHOT
1.2. KEY FINDINGS & INSIGHTS
1.3. ANALYST RECOMMENDATIONS
1.4. FUTURE OUTLOOK
2. RESEARCH METHODOLOGY
2.1. MARKET DEFINITION & SCOPE
2.2. RESEARCH OBJECTIVES: PRIMARY & SECONDARY DATA SOURCES
2.3. DATA COLLECTION SOURCES
2.3.1. COVERAGE OF 100+ PRIMARY RESEARCH/CONSULTATION CALLS WITH INDUSTRY STAKEHOLDERS
FIGURE 17 NORTH AMERICA PRESSURE GAUGE CURRENT AND FUTURE TYPE ANALYSIS, 2025–2034, (USD MILLION)
FIGURE 18 NORTH AMERICA PRESSURE GAUGE CURRENT AND FUTURE END USER ANALYSIS, 2025–2034, (USD MILLION)
FIGURE 19 MARKET SHARE BY COUNTRY
FIGURE 20 LATIN AMERICA PRESSURE GAUGE CURRENT AND FUTURE TYPE ANALYSIS, 2025–2034, (USD MILLION)
FIGURE 21 LATIN AMERICA PRESSURE GAUGE CURRENT AND FUTURE END USER ANALYSIS, 2025–2034, (USD MILLION)
FIGURE 22 MARKET SHARE BY COUNTRY
FIGURE 23 EASTERN EUROPE PRESSURE GAUGE CURRENT AND FUTURE TYPE ANALYSIS, 2025–2034, (USD MILLION)
FIGURE 24 EASTERN EUROPE PRESSURE GAUGE CURRENT AND FUTURE END USER ANALYSIS, 2025–2034, (USD MILLION)
FIGURE 25 MARKET SHARE BY COUNTRY
FIGURE 26 WESTERN EUROPE PRESSURE GAUGE CURRENT AND FUTURE TYPE ANALYSIS, 2025–2034, (USD MILLION)
FIGURE 27 WESTERN EUROPE PRESSURE GAUGE CURRENT AND FUTURE END USER ANALYSIS, 2025–2034, (USD MILLION)
FIGURE 28 MARKET SHARE BY COUNTRY
FIGURE 29 EAST ASIA AND PACIFIC PRESSURE GAUGE CURRENT AND FUTURE TYPE ANALYSIS, 2025–2034, (USD MILLION)
FIGURE 30 EAST ASIA AND PACIFIC PRESSURE GAUGE CURRENT AND FUTURE END USER ANALYSIS, 2025–2034, (USD MILLION)
FIGURE 31 MARKET SHARE BY COUNTRY
FIGURE 32 SEA AND SOUTH ASIA PRESSURE GAUGE CURRENT AND FUTURE TYPE ANALYSIS, 2025–2034, (USD MILLION)
FIGURE 33 SEA AND SOUTH ASIA PRESSURE GAUGE CURRENT AND FUTURE END USER ANALYSIS, 2025–2034, (USD MILLION)
FIGURE 34 MARKET SHARE BY COUNTRY
FIGURE 35 MIDDLE EAST AND AFRICA PRESSURE GAUGE CURRENT AND FUTURE TYPE ANALYSIS, 2025–2034, (USD MILLION)
FIGURE 36 MIDDLE EAST AND AFRICA PRESSURE GAUGE CURRENT AND FUTURE END USER ANALYSIS, 2025–2034, (USD MILLION)
FIGURE 37 NORTH AMERICA PRESSURE GAUGE CURRENT AND FUTURE MARKET VOLUME SHARE REGIONAL ANALYSIS, 2025–2034, (USD MILLION)
FIGURE 38 U.S. PRESSURE GAUGE CURRENT AND FUTURE TYPE ANALYSIS, 2025–2034, (USD MILLION)
FIGURE 39 U.S. PRESSURE GAUGE CURRENT AND FUTURE END USER ANALYSIS, 2025–2034, (USD MILLION)
FIGURE 40 CANADA PRESSURE GAUGE CURRENT AND FUTURE TYPE ANALYSIS, 2025–2034, (USD MILLION)
FIGURE 41 CANADA PRESSURE GAUGE CURRENT AND FUTURE END USER ANALYSIS, 2025–2034, (USD MILLION)
FIGURE 42 LATIN AMERICA PRESSURE GAUGE CURRENT AND FUTURE MARKET VOLUME SHARE REGIONAL ANALYSIS, 2025–2034, (USD MILLION)
FIGURE 43 MEXICO PRESSURE GAUGE CURRENT AND FUTURE TYPE ANALYSIS, 2025–2034, (USD MILLION)
FIGURE 44 MEXICO PRESSURE GAUGE CURRENT AND FUTURE END USER ANALYSIS, 2025–2034, (USD MILLION)
FIGURE 45 BRAZIL PRESSURE GAUGE CURRENT AND FUTURE TYPE ANALYSIS, 2025–2034, (USD MILLION)
FIGURE 46 BRAZIL PRESSURE GAUGE CURRENT AND FUTURE END USER ANALYSIS, 2025–2034, (USD MILLION)
FIGURE 47 ARGENTINA PRESSURE GAUGE CURRENT AND FUTURE TYPE ANALYSIS, 2025–2034, (USD MILLION)
FIGURE 48 ARGENTINA PRESSURE GAUGE CURRENT AND FUTURE END USER ANALYSIS, 2025–2034, (USD MILLION)
FIGURE 49 COLUMBIA PRESSURE GAUGE CURRENT AND FUTURE TYPE ANALYSIS, 2025–2034, (USD MILLION)
FIGURE 50 COLUMBIA PRESSURE GAUGE CURRENT AND FUTURE END USER ANALYSIS, 2025–2034, (USD MILLION)
FIGURE 51 REST OF LATIN AMERICA PRESSURE GAUGE CURRENT AND FUTURE TYPE ANALYSIS, 2025–2034, (USD MILLION)
FIGURE 52 REST OF LATIN AMERICA PRESSURE GAUGE CURRENT AND FUTURE END USER ANALYSIS, 2025–2034, (USD MILLION)
FIGURE 53 EASTERN EUROPE PRESSURE GAUGE CURRENT AND FUTURE MARKET VOLUME SHARE REGIONAL ANALYSIS, 2025–2034, (USD MILLION)
FIGURE 54 POLAND PRESSURE GAUGE CURRENT AND FUTURE TYPE ANALYSIS, 2025–2034, (USD MILLION)
FIGURE 55 POLAND PRESSURE GAUGE CURRENT AND FUTURE END USER ANALYSIS, 2025–2034, (USD MILLION)
FIGURE 56 RUSSIA PRESSURE GAUGE CURRENT AND FUTURE TYPE ANALYSIS, 2025–2034, (USD MILLION)
FIGURE 57 RUSSIA PRESSURE GAUGE CURRENT AND FUTURE END USER ANALYSIS, 2025–2034, (USD MILLION)
FIGURE 58 CZECH REPUBLIC PRESSURE GAUGE CURRENT AND FUTURE TYPE ANALYSIS, 2025–2034, (USD MILLION)
FIGURE 59 CZECH REPUBLIC PRESSURE GAUGE CURRENT AND FUTURE END USER ANALYSIS, 2025–2034, (USD MILLION)
FIGURE 60 ROMANIA PRESSURE GAUGE CURRENT AND FUTURE TYPE ANALYSIS, 2025–2034, (USD MILLION)
FIGURE 61 ROMANIA PRESSURE GAUGE CURRENT AND FUTURE END USER ANALYSIS, 2025–2034, (USD MILLION)
FIGURE 62 REST OF EASTERN EUROPE PRESSURE GAUGE CURRENT AND FUTURE TYPE ANALYSIS, 2025–2034, (USD MILLION)
FIGURE 63 REST OF EASTERN EUROPE PRESSURE GAUGE CURRENT AND FUTURE END USER ANALYSIS, 2025–2034, (USD MILLION)
FIGURE 64 WESTERN EUROPE PRESSURE GAUGE CURRENT AND FUTURE MARKET VOLUME SHARE REGIONAL ANALYSIS, 2025–2034, (USD MILLION)
FIGURE 65 GERMANY PRESSURE GAUGE CURRENT AND FUTURE TYPE ANALYSIS, 2025–2034, (USD MILLION)
FIGURE 66 GERMANY PRESSURE GAUGE CURRENT AND FUTURE END USER ANALYSIS, 2025–2034, (USD MILLION)
FIGURE 67 FRANCE PRESSURE GAUGE CURRENT AND FUTURE TYPE ANALYSIS, 2025–2034, (USD MILLION)
FIGURE 68 FRANCE PRESSURE GAUGE CURRENT AND FUTURE END USER ANALYSIS, 2025–2034, (USD MILLION)
FIGURE 69 UK PRESSURE GAUGE CURRENT AND FUTURE TYPE ANALYSIS, 2025–2034, (USD MILLION)
FIGURE 70 UK PRESSURE GAUGE CURRENT AND FUTURE END USER ANALYSIS, 2025–2034, (USD MILLION)
FIGURE 71 SPAIN PRESSURE GAUGE CURRENT AND FUTURE TYPE ANALYSIS, 2025–2034, (USD MILLION)
FIGURE 72 SPAIN PRESSURE GAUGE CURRENT AND FUTURE END USER ANALYSIS, 2025–2034, (USD MILLION)
FIGURE 73 ITALY PRESSURE GAUGE CURRENT AND FUTURE TYPE ANALYSIS, 2025–2034, (USD MILLION)
FIGURE 74 ITALY PRESSURE GAUGE CURRENT AND FUTURE END USER ANALYSIS, 2025–2034, (USD MILLION)
FIGURE 75 REST OF WESTERN EUROPE PRESSURE GAUGE CURRENT AND FUTURE TYPE ANALYSIS, 2025–2034, (USD MILLION)
FIGURE 76 REST OF WESTERN EUROPE PRESSURE GAUGE CURRENT AND FUTURE END USER ANALYSIS, 2025–2034, (USD MILLION)
FIGURE 77 EAST ASIA AND PACIFIC PRESSURE GAUGE CURRENT AND FUTURE MARKET VOLUME SHARE REGIONAL ANALYSIS, 2025–2034, (USD MILLION)
FIGURE 78 CHINA PRESSURE GAUGE CURRENT AND FUTURE TYPE ANALYSIS, 2025–2034, (USD MILLION)
FIGURE 79 CHINA PRESSURE GAUGE CURRENT AND FUTURE END USER ANALYSIS, 2025–2034, (USD MILLION)
FIGURE 80 JAPAN PRESSURE GAUGE CURRENT AND FUTURE TYPE ANALYSIS, 2025–2034, (USD MILLION)
FIGURE 81 JAPAN PRESSURE GAUGE CURRENT AND FUTURE END USER ANALYSIS, 2025–2034, (USD MILLION)
FIGURE 82 AUSTRALIA PRESSURE GAUGE CURRENT AND FUTURE TYPE ANALYSIS, 2025–2034, (USD MILLION)
FIGURE 83 AUSTRALIA PRESSURE GAUGE CURRENT AND FUTURE END USER ANALYSIS, 2025–2034, (USD MILLION)
FIGURE 84 CAMBODIA PRESSURE GAUGE CURRENT AND FUTURE TYPE ANALYSIS, 2025–2034, (USD MILLION)
FIGURE 85 CAMBODIA PRESSURE GAUGE CURRENT AND FUTURE END USER ANALYSIS, 2025–2034, (USD MILLION)
FIGURE 86 FIJI PRESSURE GAUGE CURRENT AND FUTURE TYPE ANALYSIS, 2025–2034, (USD MILLION)
FIGURE 87 FIJI PRESSURE GAUGE CURRENT AND FUTURE END USER ANALYSIS, 2025–2034, (USD MILLION)
FIGURE 88 INDONESIA PRESSURE GAUGE CURRENT AND FUTURE TYPE ANALYSIS, 2025–2034, (USD MILLION)
FIGURE 89 INDONESIA PRESSURE GAUGE CURRENT AND FUTURE END USER ANALYSIS, 2025–2034, (USD MILLION)
FIGURE 90 SOUTH KOREA PRESSURE GAUGE CURRENT AND FUTURE TYPE ANALYSIS, 2025–2034, (USD MILLION)
FIGURE 91 SOUTH KOREA PRESSURE GAUGE CURRENT AND FUTURE END USER ANALYSIS, 2025–2034, (USD MILLION)
FIGURE 92 REST OF EAST ASIA AND PACIFIC PRESSURE GAUGE CURRENT AND FUTURE TYPE ANALYSIS, 2025–2034, (USD MILLION)
FIGURE 93 REST OF EAST ASIA AND PACIFIC PRESSURE GAUGE CURRENT AND FUTURE END USER ANALYSIS, 2025–2034, (USD MILLION)
FIGURE 94 SEA AND SOUTH ASIA PRESSURE GAUGE CURRENT AND FUTURE MARKET VOLUME SHARE REGIONAL ANALYSIS, 2025–2034, (USD MILLION)
FIGURE 95 BANGLADESH PRESSURE GAUGE CURRENT AND FUTURE TYPE ANALYSIS, 2025–2034, (USD MILLION)
FIGURE 96 BANGLADESH PRESSURE GAUGE CURRENT AND FUTURE END USER ANALYSIS, 2025–2034, (USD MILLION)
FIGURE 97 NEW ZEALAND PRESSURE GAUGE CURRENT AND FUTURE TYPE ANALYSIS, 2025–2034, (USD MILLION)
FIGURE 98 NEW ZEALAND PRESSURE GAUGE CURRENT AND FUTURE END USER ANALYSIS, 2025–2034, (USD MILLION)
FIGURE 99 INDIA PRESSURE GAUGE CURRENT AND FUTURE TYPE ANALYSIS, 2025–2034, (USD MILLION)
FIGURE 100 INDIA PRESSURE GAUGE CURRENT AND FUTURE END USER ANALYSIS, 2025–2034, (USD MILLION)
FIGURE 101 SINGAPORE PRESSURE GAUGE CURRENT AND FUTURE TYPE ANALYSIS, 2025–2034, (USD MILLION)
FIGURE 102 SINGAPORE PRESSURE GAUGE CURRENT AND FUTURE END USER ANALYSIS, 2025–2034, (USD MILLION)
FIGURE 103 THAILAND PRESSURE GAUGE CURRENT AND FUTURE TYPE ANALYSIS, 2025–2034, (USD MILLION)
FIGURE 104 THAILAND PRESSURE GAUGE CURRENT AND FUTURE END USER ANALYSIS, 2025–2034, (USD MILLION)
FIGURE 105 TAIWAN PRESSURE GAUGE CURRENT AND FUTURE TYPE ANALYSIS, 2025–2034, (USD MILLION)
FIGURE 106 TAIWAN PRESSURE GAUGE CURRENT AND FUTURE END USER ANALYSIS, 2025–2034, (USD MILLION)
FIGURE 107 MALAYSIA PRESSURE GAUGE CURRENT AND FUTURE TYPE ANALYSIS, 2025–2034, (USD MILLION)
FIGURE 108 MALAYSIA PRESSURE GAUGE CURRENT AND FUTURE END USER ANALYSIS, 2025–2034, (USD MILLION)
FIGURE 109 REST OF SEA AND SOUTH ASIA PRESSURE GAUGE CURRENT AND FUTURE TYPE ANALYSIS, 2025–2034, (USD MILLION)
FIGURE 110 REST OF SEA AND SOUTH ASIA PRESSURE GAUGE CURRENT AND FUTURE END USER ANALYSIS, 2025–2034, (USD MILLION)
FIGURE 111 MIDDLE EAST AND AFRICA PRESSURE GAUGE CURRENT AND FUTURE MARKET VOLUME SHARE REGIONAL ANALYSIS, 2025–2034, (USD MILLION)
FIGURE 112 GCC COUNTRIES PRESSURE GAUGE CURRENT AND FUTURE TYPE ANALYSIS, 2025–2034, (USD MILLION)
FIGURE 113 GCC COUNTRIES PRESSURE GAUGE CURRENT AND FUTURE END USER ANALYSIS, 2025–2034, (USD MILLION)
FIGURE 114 SAUDI ARABIA PRESSURE GAUGE CURRENT AND FUTURE TYPE ANALYSIS, 2025–2034, (USD MILLION)
FIGURE 115 SAUDI ARABIA PRESSURE GAUGE CURRENT AND FUTURE END USER ANALYSIS, 2025–2034, (USD MILLION)
FIGURE 116 UAE PRESSURE GAUGE CURRENT AND FUTURE TYPE ANALYSIS, 2025–2034, (USD MILLION)
FIGURE 117 UAE PRESSURE GAUGE CURRENT AND FUTURE END USER ANALYSIS, 2025–2034, (USD MILLION)
FIGURE 118 BAHRAIN PRESSURE GAUGE CURRENT AND FUTURE TYPE ANALYSIS, 2025–2034, (USD MILLION)
FIGURE 119 BAHRAIN PRESSURE GAUGE CURRENT AND FUTURE END USER ANALYSIS, 2025–2034, (USD MILLION)
FIGURE 120 KUWAIT PRESSURE GAUGE CURRENT AND FUTURE TYPE ANALYSIS, 2025–2034, (USD MILLION)
FIGURE 121 KUWAIT PRESSURE GAUGE CURRENT AND FUTURE END USER ANALYSIS, 2025–2034, (USD MILLION)
FIGURE 122 OMAN PRESSURE GAUGE CURRENT AND FUTURE TYPE ANALYSIS, 2025–2034, (USD MILLION)
FIGURE 123 OMAN PRESSURE GAUGE CURRENT AND FUTURE END USER ANALYSIS, 2025–2034, (USD MILLION)
FIGURE 124 QATAR PRESSURE GAUGE CURRENT AND FUTURE TYPE ANALYSIS, 2025–2034, (USD MILLION)
FIGURE 125 QATAR PRESSURE GAUGE CURRENT AND FUTURE END USER ANALYSIS, 2025–2034, (USD MILLION)
FIGURE 126 EGYPT PRESSURE GAUGE CURRENT AND FUTURE TYPE ANALYSIS, 2025–2034, (USD MILLION)
FIGURE 127 EGYPT PRESSURE GAUGE CURRENT AND FUTURE END USER ANALYSIS, 2025–2034, (USD MILLION)
FIGURE 128 NIGERIA PRESSURE GAUGE CURRENT AND FUTURE TYPE ANALYSIS, 2025–2034, (USD MILLION)
FIGURE 129 NIGERIA PRESSURE GAUGE CURRENT AND FUTURE END USER ANALYSIS, 2025–2034, (USD MILLION)
FIGURE 130 SOUTH AFRICA PRESSURE GAUGE CURRENT AND FUTURE TYPE ANALYSIS, 2025–2034, (USD MILLION)
FIGURE 131 SOUTH AFRICA PRESSURE GAUGE CURRENT AND FUTURE END USER ANALYSIS, 2025–2034, (USD MILLION)
FIGURE 132 ISRAEL PRESSURE GAUGE CURRENT AND FUTURE TYPE ANALYSIS, 2025–2034, (USD MILLION)
FIGURE 133 ISRAEL PRESSURE GAUGE CURRENT AND FUTURE END USER ANALYSIS, 2025–2034, (USD MILLION)
FIGURE 134 REST OF MEA PRESSURE GAUGE CURRENT AND FUTURE TYPE ANALYSIS, 2025–2034, (USD MILLION)
FIGURE 135 REST OF MEA PRESSURE GAUGE CURRENT AND FUTURE END USER ANALYSIS, 2025–2034, (USD MILLION)
FIGURE 136 U. S. MARKET SHARE ANALYSIS BY TYPE (2025)
FIGURE 137 U. S. MARKET SHARE ANALYSIS BY END USER (2025)
FIGURE 138 CANADA MARKET SHARE ANALYSIS BY TYPE (2025)
FIGURE 139 CANADA MARKET SHARE ANALYSIS BY END USER (2025)
FIGURE 140 MEXICO MARKET SHARE ANALYSIS BY TYPE (2025)
FIGURE 141 MEXICO MARKET SHARE ANALYSIS BY END USER (2025)
FIGURE 142 CHINA MARKET SHARE ANALYSIS BY TYPE (2025)
FIGURE 143 CHINA MARKET SHARE ANALYSIS BY END USER (2025)
FIGURE 144 JAPAN MARKET SHARE ANALYSIS BY TYPE (2025)
FIGURE 145 JAPAN MARKET SHARE ANALYSIS BY END USER (2025)
FIGURE 146 INDIA MARKET SHARE ANALYSIS BY TYPE (2025)
FIGURE 147 INDIA MARKET SHARE ANALYSIS BY END USER (2025)
FIGURE 148 SOUTH KOREA MARKET SHARE ANALYSIS BY TYPE (2025)
FIGURE 149 SOUTH KOREA MARKET SHARE ANALYSIS BY END USER (2025)
FIGURE 150 SAUDI ARABIA MARKET SHARE ANALYSIS BY TYPE (2025)
FIGURE 151 SAUDI ARABIA MARKET SHARE ANALYSIS BY END USER (2025)
FIGURE 152 UAE MARKET SHARE ANALYSIS BY TYPE (2025)
FIGURE 153 UAE MARKET SHARE ANALYSIS BY END USER (2025)
FIGURE 154 EGYPT MARKET SHARE ANALYSIS BY TYPE (2025)
FIGURE 155 EGYPT MARKET SHARE ANALYSIS BY END USER (2025)
FIGURE 156 NIGERIA MARKET SHARE ANALYSIS BY TYPE (2025)
FIGURE 157 NIGERIA MARKET SHARE ANALYSIS BY END USER (2025)
FIGURE 158 SOUTH AFRICA MARKET SHARE ANALYSIS BY TYPE (2025)
FIGURE 159 SOUTH AFRICA MARKET SHARE ANALYSIS BY END USER (2025)
FIGURE 160 GERMANY MARKET SHARE ANALYSIS BY TYPE (2025)
FIGURE 161 GERMANY MARKET SHARE ANALYSIS BY END USER (2025)
FIGURE 162 FRANCE MARKET SHARE ANALYSIS BY TYPE (2025)
FIGURE 163 FRANCE MARKET SHARE ANALYSIS BY END USER (2025)
FIGURE 164 UK MARKET SHARE ANALYSIS BY TYPE (2025)
FIGURE 165 UK MARKET SHARE ANALYSIS BY END USER (2025)
FIGURE 166 SPAIN MARKET SHARE ANALYSIS BY TYPE (2025)
FIGURE 167 SPAIN MARKET SHARE ANALYSIS BY END USER (2025)
FIGURE 168 ITALY MARKET SHARE ANALYSIS BY TYPE (2025)
FIGURE 169 ITALY MARKET SHARE ANALYSIS BY END USER (2025)
FIGURE 170 BRAZIL MARKET SHARE ANALYSIS BY TYPE (2025)
FIGURE 171 BRAZIL MARKET SHARE ANALYSIS BY END USER (2025)
FIGURE 172 ARGENTINA MARKET SHARE ANALYSIS BY TYPE (2025)
FIGURE 173 ARGENTINA MARKET SHARE ANALYSIS BY END USER (2025)
FIGURE 174 COLUMBIA MARKET SHARE ANALYSIS BY TYPE (2025)
FIGURE 175 COLUMBIA MARKET SHARE ANALYSIS BY END USER (2025)
FIGURE 176 GLOBAL PRESSURE GAUGE CURRENT AND FUTURE MARKET KEY COUNTRY LEVEL ANALYSIS, 2025–2034, (USD MILLION)
FIGURE 177 FINANCIAL OVERVIEW:
Key Player Analysis
Industrial Quick Search, Inc.: Industrial Quick Search, Inc. operates as a niche player with strong visibility in distribution-led pressure gauge sales. The company focuses on rapid sourcing and catalog-driven access to industrial components, including analog and digital pressure gauges used across manufacturing, utilities, and maintenance operations. Its platform-driven model emphasizes availability, short lead times, and competitive pricing rather than proprietary manufacturing. In 2025, this positioning supports steady demand from small and mid-sized industrial buyers that prioritize procurement speed and cost control.
Strategically, the company continues to expand supplier coverage and digital catalog depth to capture fragmented demand. Its differentiation lies in breadth of inventory, cross-brand comparability, and regional fulfillment efficiency rather than technology leadership. While it holds a limited share of total global market value, estimated below 3 percent in 2025, it remains relevant as a transactional channel partner in mature industrial markets, particularly in North America.
Crane Company: Crane Company holds a strong leadership position in the pressure gauge and broader flow control market. Through its engineered products portfolio, the company supplies high-performance pressure measurement solutions to energy, chemical processing, aerospace, and industrial infrastructure sectors. Pressure gauges form part of a wider instrumentation and control offering, enabling bundled sales into large-scale projects. In 2025, Crane benefits from exposure to regulated industries that demand certified, high-reliability components.
The company continues to prioritize disciplined capital allocation, targeted acquisitions, and operational efficiency. Recent investments in digital instrumentation, advanced materials, and manufacturing automation support margin stability and product consistency. Crane’s differentiation rests on deep customer relationships, long project cycles, and strong aftermarket service revenue. With industrial segment revenues growing in the low single digits annually, Crane remains well positioned to capture long-term replacement and retrofit demand.
Meggitt PLC: Meggitt PLC operates as a technology-driven leader in high-spec pressure measurement, particularly within aerospace and defense applications. The company supplies pressure sensing and monitoring systems used in aircraft engines, fuel systems, and critical flight components. In 2025, aerospace and defense account for a significant share of its pressure-related revenue, supported by aircraft fleet expansion and sustained defense spending in North America and Europe.
Strategically, Meggitt invests heavily in R&D focused on sensor accuracy, durability, and performance under extreme conditions. Its pressure gauge and sensing solutions differentiate through certification depth, thermal stability, and long service life. The company also benefits from long-term supply agreements with major aircraft manufacturers, which provide revenue visibility. While its exposure to commercial aviation cycles introduces volatility, Meggitt’s specialization and engineering depth sustain its position as a preferred supplier in mission-critical environments.
As of 2025, demand for pressure gauges continues to rise as core industries expand capacity and tighten control standards. Automotive manufacturers increase pressure measurement points as fuel systems, thermal management, and testing protocols grow more complex. Oil and gas operators deploy gauges across upstream, midstream, and downstream assets to manage high-pressure operations and comply with safety audits. Healthcare facilities also increase usage as medical gas delivery, ventilators, and diagnostic equipment require stable and verifiable pressure control. These sectors together account for more than 60 percent of global pressure gauge revenue in 2025.
Regulatory Compliance and Equipment Protection Boosting Adoption
You also face stronger expectations around operational continuity and asset protection. Plant managers prioritize pressure monitoring to reduce unplanned shutdowns and equipment damage. Regulatory agencies enforce stricter inspection and calibration schedules, which drives replacement demand. As a result, baseline demand remains resilient even during moderate industrial slowdowns, supporting a steady market expansion near a 3.0 to 3.5 percent CAGR through 2030.
Restraint:
Price Competition and Margin Pressure in Industrial Supply Chains
Profitability remains under pressure across industrial supply chains in 2025. You operate in a price-sensitive B2B environment where large buyers negotiate aggressively and standard analog gauges face commoditization. Gross margins for mid-tier manufacturers often remain below 15 percent, which limits capital available for product development and automation upgrades. This constraint slows the pace at which new features reach the market.
Capital Spending Cycles Impacting Instrumentation Purchases
Macroeconomic uncertainty also weighs on capital spending decisions. When energy prices fluctuate or manufacturing output softens, customers defer non-essential equipment purchases. In recent cycles, industrial capex contractions of 8 to 10 percent have translated directly into lower order volumes for instrumentation suppliers. You must manage inventory and pricing carefully to protect cash flow during these periods.
Opportunity:
IoT-Enabled Pressure Gauges Creating Digital Growth Opportunities
Digital integration creates a clear growth path beyond 2025. IoT-enabled pressure gauges support remote monitoring, predictive service, and centralized data access. Adoption of connected gauges is projected to exceed 40 percent of new installations by 2030, compared with less than 25 percent in 2025. This shift opens recurring revenue potential through software, calibration services, and system integration.
You can also expand into specialized applications with higher technical requirements. Aerospace testing, pharmaceutical processing, hydrogen infrastructure, and semiconductor manufacturing demand customized pressure solutions. These niche segments typically deliver margins 20 to 30 percent higher than standard industrial gauges. Targeted product design and application-specific certifications strengthen long-term customer relationships and stabilize revenue.
Trend:
Advanced Materials Enhancing Gauge Durability and Performance
Material engineering and remote visibility shape product development strategies in 2025 and beyond. Manufacturers increasingly specify corrosion-resistant alloys, ceramics, and engineered polymers to extend service life in aggressive environments. These materials reduce replacement frequency and support higher operating temperatures and pressures.
Wireless Monitoring Transforming Pressure Measurement Systems
Remote monitoring adoption continues to accelerate. Wireless-enabled gauges transmit live pressure data, alarms, and maintenance indicators directly to control rooms or mobile devices. Facilities using remote monitoring report downtime reductions of up to 25 percent and improved compliance documentation. You benefit from faster response times and better system oversight as distributed operations become the norm across energy, industrial, and healthcare assets.
Recent Developments
Dec 2024 – WIKA Group: WIKA announced the expansion of its digital pressure gauge portfolio with integrated wireless monitoring for oil and gas and chemical plants. The launch targeted over 30 percent of its industrial customer base and aimed to lift digital product revenue by an estimated USD 45 million annually. This move strengthened WIKA’s position in connected instrumentation and reinforced its role in safety-critical industries.
Feb 2025 – Emerson Electric Co.: Emerson introduced an upgraded smart pressure gauge platform with embedded diagnostics for predictive maintenance across process industries. Early enterprise pilots covered more than 12,000 measurement points globally and reduced unplanned downtime by nearly 18 percent. The update deepened Emerson’s penetration in automation-led facilities and increased switching costs for large industrial clients.
Apr 2025 – Ashcroft Inc.: Ashcroft completed a capacity expansion at its North American manufacturing facility, increasing pressure gauge output by approximately 20 percent. The investment, valued at over USD 25 million, focused on aerospace and defense-grade products. This expansion improved supply reliability and supported long-term contracts with defense and aviation customers.
Jul 2025 – Honeywell International Inc.: Honeywell partnered with a global energy major to deploy advanced pressure monitoring systems across LNG and hydrogen infrastructure projects. The deployment is expected to cover more than 15 percent of the partner’s global assets by 2027. The collaboration strengthened Honeywell’s exposure to energy transition projects and positioned it for sustained instrumentation demand.
Sep 2025 – Baumer Group: Baumer launched a compact pressure gauge series designed for medical devices and laboratory automation, targeting precision environments with strict regulatory oversight. Initial adoption reached an estimated 10 percent of new installations in European healthcare equipment manufacturing. The launch expanded Baumer’s footprint in regulated end-use markets with higher margin potential.
Frequently Asked Questions
How big is the Pressure Gauge Market?
Global Pressure Gauge Market valued at USD 922.3M in 2024 is projected to reach USD 1,263.8M by 2034, driven by demand for industrial pressure monitoring in oil & gas, power, and manufacturing sectors.
Who are the major players in the Pressure Gauge Market?
By Output Type (Analog, Digital), By Technology (Piezoresistive Pressure Gauge, Capacitive Pressure Gauge, Electromagnetic Pressure Gauge, Optical Pressure Gauge, Other Technologies), By Application (Aerospace and Defense, Automotive, Healthcare, Other Applications)
How can this market research report help my business make strategic decisions?
Our market research reports provide actionable intelligence, including verified market size data, CAGR projections, competitive benchmarking, and segment-level opportunity analysis. These insights support strategic planning, investment decisions, product development, and market entry strategies for enterprises and startups alike.
How frequently is the data updated?
We continuously monitor industry developments and update our reports to reflect regulatory changes, technological advancements, and macroeconomic shifts. Updated editions ensure you receive the latest market intelligence.