Global Pressure Sensitive Adhesives Market Size, Share, Analysis Report By Chemistry (Silicone, Acrylic, Rubber), Technology (Hot Melt, Water-based, Radiation-Cured, Solvent-based), Application (Labels, Graphics, Tapes), End-Use (Automotive and Transportation, Medical and Healthcare, Electronics, Consumer Goods, Building and Construction, Packaging), Region and Key Players - Industry Segment Overview, Market Dynamics, Competitive Strategies, Trends and Forecast 2025-2034
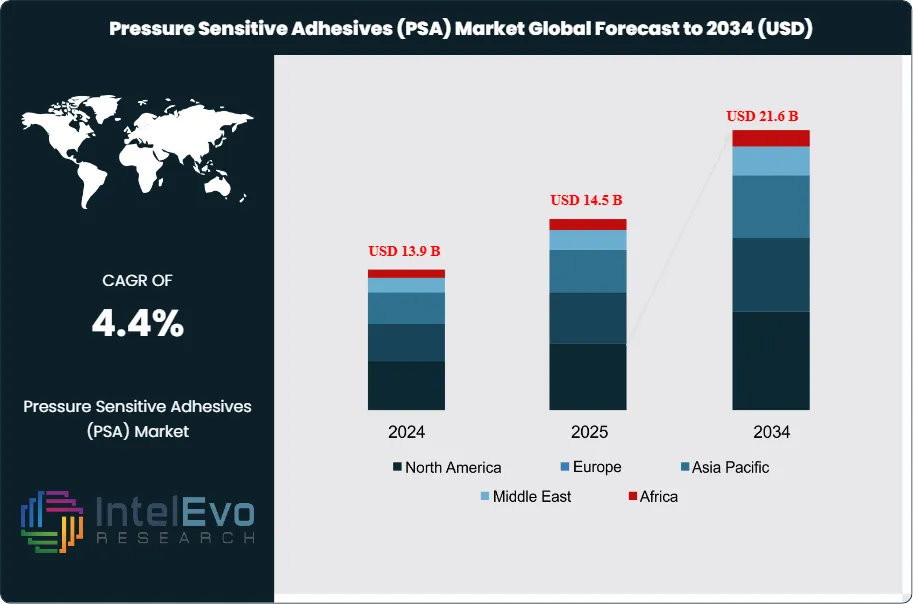
The Pressure Sensitive Adhesives (PSA) Market size is projected to reach approximately USD 21.6 Billion by 2034, up from USD 13.9 Billion in 2024, growing at a CAGR of 4.4% during the forecast period from 2025 to 2034. This growth is driven by the increasing demand for lightweight bonding solutions, eco-friendly adhesive formulations, and high-performance tapes and labels across industries such as automotive, electronics, packaging, and construction. The market is also witnessing strong R&D investments toward bio-based and solvent-free PSA technologies, aligning with global sustainability trends. With expanding applications in medical devices and electric vehicles (EVs), the PSA market is set to play a crucial role in the future of industrial manufacturing and smart materials innovation.
Pressure Sensitive Adhesives (PSAs) are a class of adhesives that form a bond when light pressure is applied to marry the adhesive with the adherend. They do not require water, solvent, or heat activation to exert a strong holding force on various substrates. PSAs are widely used in applications such as labels, tapes, graphics, and protective films across industries including packaging, automotive, electronics, healthcare, and construction.
The rise in e-commerce and demand for convenient packaging solutions have propelled the use of PSAs due to their quick bonding and ease of application. In the automotive sector, PSAs are used for bonding trims, emblems, and insulation materials, contributing to vehicle light weighting efforts. Similarly, the electronics industry employs PSAs for assembling components, providing insulation, and bonding displays. The growing emphasis on sustainability has led to the development of bio-based PSAs derived from renewable resources like starch, soy, and vegetable oils. These adhesives offer comparable performance to traditional PSAs while reducing environmental impact. Advancements in PSA technology, such as the development of nanotechnology-based functional PSAs and UV-curable adhesives, are expanding the application scope of PSAs.
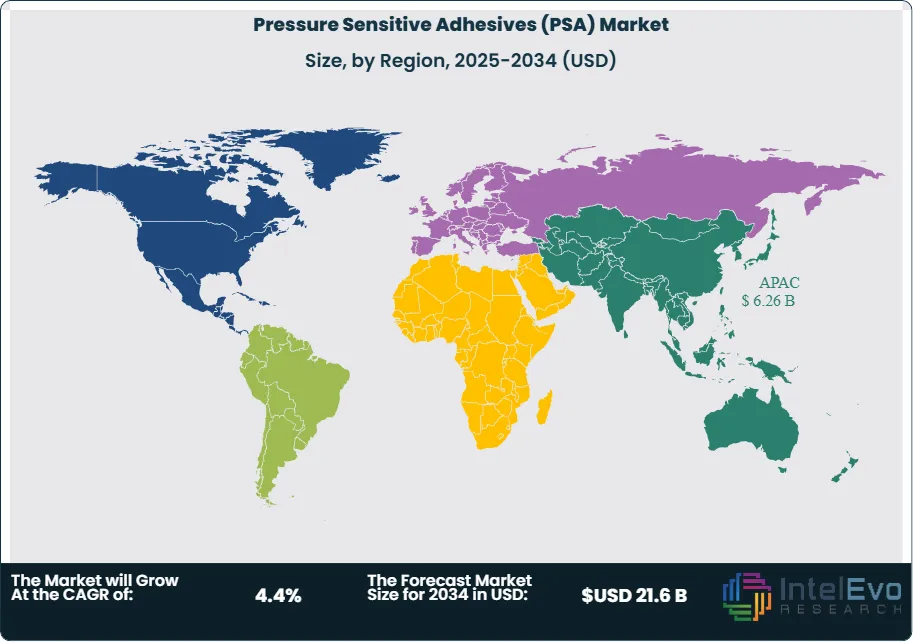
The Asia-Pacific region leads the global PSA market, accounting for the largest share due to its robust industrial base, rapid urbanization, and growing demand in packaging, automotive, and electronics sectors. Countries like China and India are significant contributors, with increasing investments in infrastructure and manufacturing. North America and Europe follow, driven by technological advancements and sustainability initiatives. Emerging markets in Latin America and the Middle East & Africa are expected to witness substantial growth, fueled by rising industrialization and consumer demand.
The COVID-19 pandemic had a mixed impact on the PSA market. While sectors like automotive and construction experienced a downturn due to lockdowns and supply chain disruptions, the packaging and healthcare industries saw increased demand for PSAs. The surge in e-commerce and the need for medical supplies like tapes and labels contributed to the resilience of the PSA market during the pandemic. Post-pandemic, the market is recovering, with growth driven by resumed industrial activities and continued demand in key application areas.
Key Takeaways:
Market Growth: The 3D bioprinting for organ regeneration market is expected to reach USD 21.6 Billion by 2034, growing at a robust CAGR of 4.4%, driven by diverse applications across industries and ongoing technological advancements.
Chemistry Dominance: Acrylic-based PSAs dominate the market due to their excellent balance of adhesion, transparency, and cost-effectiveness. Silicone-based adhesives, while costlier, are projected to see significant growth because of their superior performance in high-temperature and sensitive applications.
Technology Dominance: Water-based PSAs dominate the market due to their eco-friendliness, regulatory compliance, and cost-effectiveness. Meanwhile, hot melt PSAs are expected to witness strong future growth driven by demand in packaging, hygiene, and automotive sectors.
Application Dominance: Labels dominate the pressure sensitive adhesives market due to their extensive use in packaging, logistics, and product identification. Tapes are anticipated to experience strong future growth, especially in construction, automotive, and electronics applications.
End-Use Dominance: Packaging leads the pressure sensitive adhesives market due to its extensive use in labeling, sealing, and product branding across various industries. However, the automotive and transportation segment is projected to witness the fastest growth, fueled by the rising demand for lightweight and high-performance adhesive solutions in modern vehicles.
Driver: The increasing demand from packaging, automotive, and electronics sectors is propelling growth in the pressure sensitive adhesives market. Additionally, the rise in e-commerce and the need for lightweight, easy-to-apply adhesives are enhancing market adoption.
Restraint: Environmental concerns related to solvent-based PSAs and stringent VOC emission regulations hinder market expansion. Moreover, fluctuations in raw material prices affect production costs, impacting small and medium manufacturers.
Opportunity: The push for sustainable and bio-based adhesives offers major growth opportunities. Additionally, the proliferation of flexible electronics and medical devices opens up new application areas for advanced PSAs.
Trend: Technological advancements in hot-melt and UV-curable PSAs are revolutionizing the market. Simultaneously, the adoption of smart labels and tamper-evident packaging in logistics and retail is becoming widespread.
Regional Analysis: The Asia-Pacific region dominates the global pressure sensitive adhesives market due to its strong manufacturing base, rising industrialization, and high demand from packaging, automotive, and electronics sectors. North America and Europe hold significant shares driven by technological advancements and sustainability trends. Meanwhile, the Middle East & Africa and Latin America are projected to show robust future growth due to rising infrastructure and consumer goods demand.
Chemistry Analysis:
Acrylic Leads With more than 50% Market Share In Pressure Sensitive Adhesives Market, Acrylic PSAs are widely used in labels, tapes, and graphics due to their strong adhesion to a variety of substrates, resistance to UV and oxidation, and affordability. These adhesives offer long-lasting bonding for indoor and outdoor use, making them popular across packaging, automotive, and consumer goods industries. Their water-based or solvent-based variants also align with environmental compliance, further strengthening their market presence.
Silicone PSAs, though representing a smaller share due to high costs, are gaining traction in sectors like electronics, aerospace, and healthcare. Their ability to adhere to low-energy surfaces, maintain bond strength in extreme temperatures, and exhibit chemical resistance makes them ideal for demanding environments. As high-tech applications expand, the demand for silicone adhesives is expected to rise.
Technology Analysis:
Water-based PSAs lead the market as they utilize water as a carrier instead of solvents, making them environmentally safe and compliant with stringent VOC regulations. These adhesives offer excellent adhesion, ease of cleanup, and cost-effectiveness, making them highly favored in packaging, graphics, and paper industries. Their versatility and low toxicity have led to widespread adoption, particularly in developed markets like North America and Europe where environmental norms are strict.
Hot melt PSAs are solid at room temperature and become tacky upon heating. They offer fast-setting, high tack strength, and are ideal for high-speed production lines in packaging, hygiene products (like diapers), and automotive assemblies. Their solvent-free nature also aligns with green manufacturing goals, and advancements in polymer blends are enhancing their temperature and moisture resistance—making this segment the fastest growing.
Application Analysis:
Labels represent the largest application segment in the PSA market. Their widespread use in consumer goods, food and beverage, pharmaceuticals, and logistics has solidified their market leadership. Pressure-sensitive labels are favored for their ease of application, clarity, durability, and compatibility with various substrates. The growth of e-commerce, which relies heavily on shipping and product tracking, continues to drive label demand globally. Additionally, compliance labeling in healthcare and chemicals sectors supports steady usage.
Tapes are increasingly used for both industrial and consumer purposes. Their roles in automotive (for attaching trims and emblems), electronics (for insulation and assembly), and construction (sealing and bonding) are expanding rapidly.
End-Use Analysis:
Packaging dominates the PSA market because of its essential role in labeling, sealing, tamper-proofing, and branding. The rise in global e-commerce, FMCG products, pharmaceuticals, and food delivery services has drastically increased the need for efficient, cost-effective, and high-speed adhesive solutions. Pressure sensitive adhesives are preferred for their quick tack, clean removability, and compatibility with a range of packaging materials. These adhesives ensure clear labeling and secure packaging across logistics chains, reducing operational costs and improving brand visibility. Automation in packaging lines also supports the adoption of PSAs for seamless integration.
Automotive and Transportation is the fastest-growing segment in the PSA market. With the global shift towards lightweight vehicle design, electric vehicles (EVs), and fuel-efficient cars, manufacturers are increasingly replacing mechanical fasteners with PSAs.
Region Analysis:
Asia-Pacific Leads With over 45% Market Share In Pressure Sensitive Adhesives Market. Asia-Pacific leads the pressure sensitive adhesives market, primarily due to rapid industrialization, population growth, and high demand from sectors like packaging, automotive, and consumer electronics. Countries like China, India, Japan, and South Korea serve as key production and consumption hubs. The booming e-commerce sector and expansion of manufacturing capacities, particularly in China and India, are pushing the demand for PSAs in labeling, sealing, and assembling.
North America holds a strong market share owing to the presence of major PSA manufacturers, ongoing R&D, and widespread application in automotive, healthcare, and construction. The region benefits from consumer demand for smart packaging, clean labeling, and medical adhesives.
Europe emphasizes eco-friendly and bio-based PSAs, driven by stringent environmental regulations and high adoption in automotive and healthcare segments. Germany, France, and the UK are significant contributors due to their industrial maturity and innovation.
Latin America and Middle East & Africa are emerging markets with increasing demand for packaged goods, medical products, and consumer electronics. Urbanization, rising disposable income, and infrastructure development contribute to the rising adoption of PSAs.
By Type (Acrylic Pressure Sensitive Adhesives, Rubber-Based Pressure Sensitive Adhesives, Silicone Pressure Sensitive Adhesives, Polyurethane-Based Pressure Sensitive Adhesives, Others), By Technology (Water-Based, Solvent-Based, Hot Melt, Radiation Cured (UV-Cured and EB-Cured)), By Application (Tapes, Labels, Graphics and Signage, Medical & Hygiene Products, Automotive Components, Electronics Assembly, Construction & Building Materials, Others), By End-Use Industry (Packaging, Automotive & Transportation, Electronics & Electrical, Construction, Healthcare, Consumer Goods, Others)
Research Methodology
Primary Research- 100 Interviews of Stakeholders
Secondary Research
Desk Research
Regional scope
North America (United States, Canada, Mexico)
Latin America (Brazil, Argentina, Columbia)
East Asia And Pacific (China, Japan, South Korea, Australia, Cambodia, Fiji, Indonesia)
Sea And South Asia (India, Singapore, Thailand, Taiwan, Malaysia)
Eastern Europe (Poland, Russia, Czech Republic, Romania)
Western Europe (Germany, U.K., France, Spain, Itlay)
Middle East & Africa (GCC Countries, Egypt, Nigeria, South Africa, Israel)
Competitive Landscape
Henkel AG and Co. KGaA, Advance Tapes International Limited, H.B. Fuller Company, Eastman Chemical Company, Arkema, 3M, Nitto Denko Corporation, Sika AG, Exxon Mobil Corporation, Ashland Inc., Pidilite Industries Ltd., Illinois Tool Works Inc, Momentive Performance Materials Inc., Tesa SE, Franklin International Inc., Wacker Chemie AG, DuPont de Nemours Inc., Helmitin Adhesives, Avery Dennison Corporation, DIC Corporation
Customization Scope
Customization for segments, region/country-level will be provided. Moreover, additional customization can be done based on the requirements.
Pricing and Purchase Options
Avail customized purchase options to meet your exact research needs. We have three licenses to opt for: Single User License, Multi-User License (Up to 5 Users), Corporate Use License (Unlimited User and Printable PDF).
TABLE OF CONTENTS
1. EXECUTIVE SUMMARY
1.1. MARKET SNAPSHOT
1.2. KEY FINDINGS & INSIGHTS
1.3. ANALYST RECOMMENDATIONS
1.4. FUTURE OUTLOOK
2. RESEARCH METHODOLOGY
2.1. MARKET DEFINITION & SCOPE
2.2. RESEARCH OBJECTIVES: PRIMARY & SECONDARY DATA SOURCES
2.3. DATA COLLECTION SOURCES
2.3.1. COVERAGE OF 100+ PRIMARY RESEARCH/CONSULTATION CALLS WITH INDUSTRY STAKEHOLDERS
FIGURE 17 NORTH AMERICA PRESSURE SENSITIVE ADHESIVES CURRENT AND FUTURE TYPE ANALYSIS, 2025–2034, (USD MILLION)
FIGURE 18 NORTH AMERICA PRESSURE SENSITIVE ADHESIVES CURRENT AND FUTURE END USER ANALYSIS, 2025–2034, (USD MILLION)
FIGURE 19 MARKET SHARE BY COUNTRY
FIGURE 20 LATIN AMERICA PRESSURE SENSITIVE ADHESIVES CURRENT AND FUTURE TYPE ANALYSIS, 2025–2034, (USD MILLION)
FIGURE 21 LATIN AMERICA PRESSURE SENSITIVE ADHESIVES CURRENT AND FUTURE END USER ANALYSIS, 2025–2034, (USD MILLION)
FIGURE 22 MARKET SHARE BY COUNTRY
FIGURE 23 EASTERN EUROPE PRESSURE SENSITIVE ADHESIVES CURRENT AND FUTURE TYPE ANALYSIS, 2025–2034, (USD MILLION)
FIGURE 24 EASTERN EUROPE PRESSURE SENSITIVE ADHESIVES CURRENT AND FUTURE END USER ANALYSIS, 2025–2034, (USD MILLION)
FIGURE 25 MARKET SHARE BY COUNTRY
FIGURE 26 WESTERN EUROPE PRESSURE SENSITIVE ADHESIVES CURRENT AND FUTURE TYPE ANALYSIS, 2025–2034, (USD MILLION)
FIGURE 27 WESTERN EUROPE PRESSURE SENSITIVE ADHESIVES CURRENT AND FUTURE END USER ANALYSIS, 2025–2034, (USD MILLION)
FIGURE 28 MARKET SHARE BY COUNTRY
FIGURE 29 EAST ASIA AND PACIFIC PRESSURE SENSITIVE ADHESIVES CURRENT AND FUTURE TYPE ANALYSIS, 2025–2034, (USD MILLION)
FIGURE 30 EAST ASIA AND PACIFIC PRESSURE SENSITIVE ADHESIVES CURRENT AND FUTURE END USER ANALYSIS, 2025–2034, (USD MILLION)
FIGURE 31 MARKET SHARE BY COUNTRY
FIGURE 32 SEA AND SOUTH ASIA PRESSURE SENSITIVE ADHESIVES CURRENT AND FUTURE TYPE ANALYSIS, 2025–2034, (USD MILLION)
FIGURE 33 SEA AND SOUTH ASIA PRESSURE SENSITIVE ADHESIVES CURRENT AND FUTURE END USER ANALYSIS, 2025–2034, (USD MILLION)
FIGURE 34 MARKET SHARE BY COUNTRY
FIGURE 35 MIDDLE EAST AND AFRICA PRESSURE SENSITIVE ADHESIVES CURRENT AND FUTURE TYPE ANALYSIS, 2025–2034, (USD MILLION)
FIGURE 36 MIDDLE EAST AND AFRICA PRESSURE SENSITIVE ADHESIVES CURRENT AND FUTURE END USER ANALYSIS, 2025–2034, (USD MILLION)
FIGURE 37 NORTH AMERICA PRESSURE SENSITIVE ADHESIVES CURRENT AND FUTURE MARKET VOLUME SHARE REGIONAL ANALYSIS, 2025–2034, (USD MILLION)
FIGURE 38 U.S. PRESSURE SENSITIVE ADHESIVES CURRENT AND FUTURE TYPE ANALYSIS, 2025–2034, (USD MILLION)
FIGURE 39 U.S. PRESSURE SENSITIVE ADHESIVES CURRENT AND FUTURE END USER ANALYSIS, 2025–2034, (USD MILLION)
FIGURE 40 CANADA PRESSURE SENSITIVE ADHESIVES CURRENT AND FUTURE TYPE ANALYSIS, 2025–2034, (USD MILLION)
FIGURE 41 CANADA PRESSURE SENSITIVE ADHESIVES CURRENT AND FUTURE END USER ANALYSIS, 2025–2034, (USD MILLION)
FIGURE 42 LATIN AMERICA PRESSURE SENSITIVE ADHESIVES CURRENT AND FUTURE MARKET VOLUME SHARE REGIONAL ANALYSIS, 2025–2034, (USD MILLION)
FIGURE 43 MEXICO PRESSURE SENSITIVE ADHESIVES CURRENT AND FUTURE TYPE ANALYSIS, 2025–2034, (USD MILLION)
FIGURE 44 MEXICO PRESSURE SENSITIVE ADHESIVES CURRENT AND FUTURE END USER ANALYSIS, 2025–2034, (USD MILLION)
FIGURE 45 BRAZIL PRESSURE SENSITIVE ADHESIVES CURRENT AND FUTURE TYPE ANALYSIS, 2025–2034, (USD MILLION)
FIGURE 46 BRAZIL PRESSURE SENSITIVE ADHESIVES CURRENT AND FUTURE END USER ANALYSIS, 2025–2034, (USD MILLION)
FIGURE 47 ARGENTINA PRESSURE SENSITIVE ADHESIVES CURRENT AND FUTURE TYPE ANALYSIS, 2025–2034, (USD MILLION)
FIGURE 48 ARGENTINA PRESSURE SENSITIVE ADHESIVES CURRENT AND FUTURE END USER ANALYSIS, 2025–2034, (USD MILLION)
FIGURE 49 COLUMBIA PRESSURE SENSITIVE ADHESIVES CURRENT AND FUTURE TYPE ANALYSIS, 2025–2034, (USD MILLION)
FIGURE 50 COLUMBIA PRESSURE SENSITIVE ADHESIVES CURRENT AND FUTURE END USER ANALYSIS, 2025–2034, (USD MILLION)
FIGURE 51 REST OF LATIN AMERICA PRESSURE SENSITIVE ADHESIVES CURRENT AND FUTURE TYPE ANALYSIS, 2025–2034, (USD MILLION)
FIGURE 52 REST OF LATIN AMERICA PRESSURE SENSITIVE ADHESIVES CURRENT AND FUTURE END USER ANALYSIS, 2025–2034, (USD MILLION)
FIGURE 53 EASTERN EUROPE PRESSURE SENSITIVE ADHESIVES CURRENT AND FUTURE MARKET VOLUME SHARE REGIONAL ANALYSIS, 2025–2034, (USD MILLION)
FIGURE 54 POLAND PRESSURE SENSITIVE ADHESIVES CURRENT AND FUTURE TYPE ANALYSIS, 2025–2034, (USD MILLION)
FIGURE 55 POLAND PRESSURE SENSITIVE ADHESIVES CURRENT AND FUTURE END USER ANALYSIS, 2025–2034, (USD MILLION)
FIGURE 56 RUSSIA PRESSURE SENSITIVE ADHESIVES CURRENT AND FUTURE TYPE ANALYSIS, 2025–2034, (USD MILLION)
FIGURE 57 RUSSIA PRESSURE SENSITIVE ADHESIVES CURRENT AND FUTURE END USER ANALYSIS, 2025–2034, (USD MILLION)
FIGURE 58 CZECH REPUBLIC PRESSURE SENSITIVE ADHESIVES CURRENT AND FUTURE TYPE ANALYSIS, 2025–2034, (USD MILLION)
FIGURE 59 CZECH REPUBLIC PRESSURE SENSITIVE ADHESIVES CURRENT AND FUTURE END USER ANALYSIS, 2025–2034, (USD MILLION)
FIGURE 60 ROMANIA PRESSURE SENSITIVE ADHESIVES CURRENT AND FUTURE TYPE ANALYSIS, 2025–2034, (USD MILLION)
FIGURE 61 ROMANIA PRESSURE SENSITIVE ADHESIVES CURRENT AND FUTURE END USER ANALYSIS, 2025–2034, (USD MILLION)
FIGURE 62 REST OF EASTERN EUROPE PRESSURE SENSITIVE ADHESIVES CURRENT AND FUTURE TYPE ANALYSIS, 2025–2034, (USD MILLION)
FIGURE 63 REST OF EASTERN EUROPE PRESSURE SENSITIVE ADHESIVES CURRENT AND FUTURE END USER ANALYSIS, 2025–2034, (USD MILLION)
FIGURE 64 WESTERN EUROPE PRESSURE SENSITIVE ADHESIVES CURRENT AND FUTURE MARKET VOLUME SHARE REGIONAL ANALYSIS, 2025–2034, (USD MILLION)
FIGURE 65 GERMANY PRESSURE SENSITIVE ADHESIVES CURRENT AND FUTURE TYPE ANALYSIS, 2025–2034, (USD MILLION)
FIGURE 66 GERMANY PRESSURE SENSITIVE ADHESIVES CURRENT AND FUTURE END USER ANALYSIS, 2025–2034, (USD MILLION)
FIGURE 67 FRANCE PRESSURE SENSITIVE ADHESIVES CURRENT AND FUTURE TYPE ANALYSIS, 2025–2034, (USD MILLION)
FIGURE 68 FRANCE PRESSURE SENSITIVE ADHESIVES CURRENT AND FUTURE END USER ANALYSIS, 2025–2034, (USD MILLION)
FIGURE 69 UK PRESSURE SENSITIVE ADHESIVES CURRENT AND FUTURE TYPE ANALYSIS, 2025–2034, (USD MILLION)
FIGURE 70 UK PRESSURE SENSITIVE ADHESIVES CURRENT AND FUTURE END USER ANALYSIS, 2025–2034, (USD MILLION)
FIGURE 71 SPAIN PRESSURE SENSITIVE ADHESIVES CURRENT AND FUTURE TYPE ANALYSIS, 2025–2034, (USD MILLION)
FIGURE 72 SPAIN PRESSURE SENSITIVE ADHESIVES CURRENT AND FUTURE END USER ANALYSIS, 2025–2034, (USD MILLION)
FIGURE 73 ITALY PRESSURE SENSITIVE ADHESIVES CURRENT AND FUTURE TYPE ANALYSIS, 2025–2034, (USD MILLION)
FIGURE 74 ITALY PRESSURE SENSITIVE ADHESIVES CURRENT AND FUTURE END USER ANALYSIS, 2025–2034, (USD MILLION)
FIGURE 75 REST OF WESTERN EUROPE PRESSURE SENSITIVE ADHESIVES CURRENT AND FUTURE TYPE ANALYSIS, 2025–2034, (USD MILLION)
FIGURE 76 REST OF WESTERN EUROPE PRESSURE SENSITIVE ADHESIVES CURRENT AND FUTURE END USER ANALYSIS, 2025–2034, (USD MILLION)
FIGURE 77 EAST ASIA AND PACIFIC PRESSURE SENSITIVE ADHESIVES CURRENT AND FUTURE MARKET VOLUME SHARE REGIONAL ANALYSIS, 2025–2034, (USD MILLION)
FIGURE 78 CHINA PRESSURE SENSITIVE ADHESIVES CURRENT AND FUTURE TYPE ANALYSIS, 2025–2034, (USD MILLION)
FIGURE 79 CHINA PRESSURE SENSITIVE ADHESIVES CURRENT AND FUTURE END USER ANALYSIS, 2025–2034, (USD MILLION)
FIGURE 80 JAPAN PRESSURE SENSITIVE ADHESIVES CURRENT AND FUTURE TYPE ANALYSIS, 2025–2034, (USD MILLION)
FIGURE 81 JAPAN PRESSURE SENSITIVE ADHESIVES CURRENT AND FUTURE END USER ANALYSIS, 2025–2034, (USD MILLION)
FIGURE 82 AUSTRALIA PRESSURE SENSITIVE ADHESIVES CURRENT AND FUTURE TYPE ANALYSIS, 2025–2034, (USD MILLION)
FIGURE 83 AUSTRALIA PRESSURE SENSITIVE ADHESIVES CURRENT AND FUTURE END USER ANALYSIS, 2025–2034, (USD MILLION)
FIGURE 84 CAMBODIA PRESSURE SENSITIVE ADHESIVES CURRENT AND FUTURE TYPE ANALYSIS, 2025–2034, (USD MILLION)
FIGURE 85 CAMBODIA PRESSURE SENSITIVE ADHESIVES CURRENT AND FUTURE END USER ANALYSIS, 2025–2034, (USD MILLION)
FIGURE 86 FIJI PRESSURE SENSITIVE ADHESIVES CURRENT AND FUTURE TYPE ANALYSIS, 2025–2034, (USD MILLION)
FIGURE 87 FIJI PRESSURE SENSITIVE ADHESIVES CURRENT AND FUTURE END USER ANALYSIS, 2025–2034, (USD MILLION)
FIGURE 88 INDONESIA PRESSURE SENSITIVE ADHESIVES CURRENT AND FUTURE TYPE ANALYSIS, 2025–2034, (USD MILLION)
FIGURE 89 INDONESIA PRESSURE SENSITIVE ADHESIVES CURRENT AND FUTURE END USER ANALYSIS, 2025–2034, (USD MILLION)
FIGURE 90 SOUTH KOREA PRESSURE SENSITIVE ADHESIVES CURRENT AND FUTURE TYPE ANALYSIS, 2025–2034, (USD MILLION)
FIGURE 91 SOUTH KOREA PRESSURE SENSITIVE ADHESIVES CURRENT AND FUTURE END USER ANALYSIS, 2025–2034, (USD MILLION)
FIGURE 92 REST OF EAST ASIA AND PACIFIC PRESSURE SENSITIVE ADHESIVES CURRENT AND FUTURE TYPE ANALYSIS, 2025–2034, (USD MILLION)
FIGURE 93 REST OF EAST ASIA AND PACIFIC PRESSURE SENSITIVE ADHESIVES CURRENT AND FUTURE END USER ANALYSIS, 2025–2034, (USD MILLION)
FIGURE 94 SEA AND SOUTH ASIA PRESSURE SENSITIVE ADHESIVES CURRENT AND FUTURE MARKET VOLUME SHARE REGIONAL ANALYSIS, 2025–2034, (USD MILLION)
FIGURE 95 BANGLADESH PRESSURE SENSITIVE ADHESIVES CURRENT AND FUTURE TYPE ANALYSIS, 2025–2034, (USD MILLION)
FIGURE 96 BANGLADESH PRESSURE SENSITIVE ADHESIVES CURRENT AND FUTURE END USER ANALYSIS, 2025–2034, (USD MILLION)
FIGURE 97 NEW ZEALAND PRESSURE SENSITIVE ADHESIVES CURRENT AND FUTURE TYPE ANALYSIS, 2025–2034, (USD MILLION)
FIGURE 98 NEW ZEALAND PRESSURE SENSITIVE ADHESIVES CURRENT AND FUTURE END USER ANALYSIS, 2025–2034, (USD MILLION)
FIGURE 99 INDIA PRESSURE SENSITIVE ADHESIVES CURRENT AND FUTURE TYPE ANALYSIS, 2025–2034, (USD MILLION)
FIGURE 100 INDIA PRESSURE SENSITIVE ADHESIVES CURRENT AND FUTURE END USER ANALYSIS, 2025–2034, (USD MILLION)
FIGURE 101 SINGAPORE PRESSURE SENSITIVE ADHESIVES CURRENT AND FUTURE TYPE ANALYSIS, 2025–2034, (USD MILLION)
FIGURE 102 SINGAPORE PRESSURE SENSITIVE ADHESIVES CURRENT AND FUTURE END USER ANALYSIS, 2025–2034, (USD MILLION)
FIGURE 103 THAILAND PRESSURE SENSITIVE ADHESIVES CURRENT AND FUTURE TYPE ANALYSIS, 2025–2034, (USD MILLION)
FIGURE 104 THAILAND PRESSURE SENSITIVE ADHESIVES CURRENT AND FUTURE END USER ANALYSIS, 2025–2034, (USD MILLION)
FIGURE 105 TAIWAN PRESSURE SENSITIVE ADHESIVES CURRENT AND FUTURE TYPE ANALYSIS, 2025–2034, (USD MILLION)
FIGURE 106 TAIWAN PRESSURE SENSITIVE ADHESIVES CURRENT AND FUTURE END USER ANALYSIS, 2025–2034, (USD MILLION)
FIGURE 107 MALAYSIA PRESSURE SENSITIVE ADHESIVES CURRENT AND FUTURE TYPE ANALYSIS, 2025–2034, (USD MILLION)
FIGURE 108 MALAYSIA PRESSURE SENSITIVE ADHESIVES CURRENT AND FUTURE END USER ANALYSIS, 2025–2034, (USD MILLION)
FIGURE 109 REST OF SEA AND SOUTH ASIA PRESSURE SENSITIVE ADHESIVES CURRENT AND FUTURE TYPE ANALYSIS, 2025–2034, (USD MILLION)
FIGURE 110 REST OF SEA AND SOUTH ASIA PRESSURE SENSITIVE ADHESIVES CURRENT AND FUTURE END USER ANALYSIS, 2025–2034, (USD MILLION)
FIGURE 111 MIDDLE EAST AND AFRICA PRESSURE SENSITIVE ADHESIVES CURRENT AND FUTURE MARKET VOLUME SHARE REGIONAL ANALYSIS, 2025–2034, (USD MILLION)
FIGURE 112 GCC COUNTRIES PRESSURE SENSITIVE ADHESIVES CURRENT AND FUTURE TYPE ANALYSIS, 2025–2034, (USD MILLION)
FIGURE 113 GCC COUNTRIES PRESSURE SENSITIVE ADHESIVES CURRENT AND FUTURE END USER ANALYSIS, 2025–2034, (USD MILLION)
FIGURE 114 SAUDI ARABIA PRESSURE SENSITIVE ADHESIVES CURRENT AND FUTURE TYPE ANALYSIS, 2025–2034, (USD MILLION)
FIGURE 115 SAUDI ARABIA PRESSURE SENSITIVE ADHESIVES CURRENT AND FUTURE END USER ANALYSIS, 2025–2034, (USD MILLION)
FIGURE 116 UAE PRESSURE SENSITIVE ADHESIVES CURRENT AND FUTURE TYPE ANALYSIS, 2025–2034, (USD MILLION)
FIGURE 117 UAE PRESSURE SENSITIVE ADHESIVES CURRENT AND FUTURE END USER ANALYSIS, 2025–2034, (USD MILLION)
FIGURE 118 BAHRAIN PRESSURE SENSITIVE ADHESIVES CURRENT AND FUTURE TYPE ANALYSIS, 2025–2034, (USD MILLION)
FIGURE 119 BAHRAIN PRESSURE SENSITIVE ADHESIVES CURRENT AND FUTURE END USER ANALYSIS, 2025–2034, (USD MILLION)
FIGURE 120 KUWAIT PRESSURE SENSITIVE ADHESIVES CURRENT AND FUTURE TYPE ANALYSIS, 2025–2034, (USD MILLION)
FIGURE 121 KUWAIT PRESSURE SENSITIVE ADHESIVES CURRENT AND FUTURE END USER ANALYSIS, 2025–2034, (USD MILLION)
FIGURE 122 OMAN PRESSURE SENSITIVE ADHESIVES CURRENT AND FUTURE TYPE ANALYSIS, 2025–2034, (USD MILLION)
FIGURE 123 OMAN PRESSURE SENSITIVE ADHESIVES CURRENT AND FUTURE END USER ANALYSIS, 2025–2034, (USD MILLION)
FIGURE 124 QATAR PRESSURE SENSITIVE ADHESIVES CURRENT AND FUTURE TYPE ANALYSIS, 2025–2034, (USD MILLION)
FIGURE 125 QATAR PRESSURE SENSITIVE ADHESIVES CURRENT AND FUTURE END USER ANALYSIS, 2025–2034, (USD MILLION)
FIGURE 126 EGYPT PRESSURE SENSITIVE ADHESIVES CURRENT AND FUTURE TYPE ANALYSIS, 2025–2034, (USD MILLION)
FIGURE 127 EGYPT PRESSURE SENSITIVE ADHESIVES CURRENT AND FUTURE END USER ANALYSIS, 2025–2034, (USD MILLION)
FIGURE 128 NIGERIA PRESSURE SENSITIVE ADHESIVES CURRENT AND FUTURE TYPE ANALYSIS, 2025–2034, (USD MILLION)
FIGURE 129 NIGERIA PRESSURE SENSITIVE ADHESIVES CURRENT AND FUTURE END USER ANALYSIS, 2025–2034, (USD MILLION)
FIGURE 130 SOUTH AFRICA PRESSURE SENSITIVE ADHESIVES CURRENT AND FUTURE TYPE ANALYSIS, 2025–2034, (USD MILLION)
FIGURE 131 SOUTH AFRICA PRESSURE SENSITIVE ADHESIVES CURRENT AND FUTURE END USER ANALYSIS, 2025–2034, (USD MILLION)
FIGURE 132 ISRAEL PRESSURE SENSITIVE ADHESIVES CURRENT AND FUTURE TYPE ANALYSIS, 2025–2034, (USD MILLION)
FIGURE 133 ISRAEL PRESSURE SENSITIVE ADHESIVES CURRENT AND FUTURE END USER ANALYSIS, 2025–2034, (USD MILLION)
FIGURE 134 REST OF MEA PRESSURE SENSITIVE ADHESIVES CURRENT AND FUTURE TYPE ANALYSIS, 2025–2034, (USD MILLION)
FIGURE 135 REST OF MEA PRESSURE SENSITIVE ADHESIVES CURRENT AND FUTURE END USER ANALYSIS, 2025–2034, (USD MILLION)
FIGURE 136 U. S. MARKET SHARE ANALYSIS BY TYPE (2024)
FIGURE 137 U. S. MARKET SHARE ANALYSIS BY END USER (2024)
FIGURE 138 CANADA MARKET SHARE ANALYSIS BY TYPE (2024)
FIGURE 139 CANADA MARKET SHARE ANALYSIS BY END USER (2024)
FIGURE 140 MEXICO MARKET SHARE ANALYSIS BY TYPE (2024)
FIGURE 141 MEXICO MARKET SHARE ANALYSIS BY END USER (2024)
FIGURE 142 CHINA MARKET SHARE ANALYSIS BY TYPE (2024)
FIGURE 143 CHINA MARKET SHARE ANALYSIS BY END USER (2024)
FIGURE 144 JAPAN MARKET SHARE ANALYSIS BY TYPE (2024)
FIGURE 145 JAPAN MARKET SHARE ANALYSIS BY END USER (2024)
FIGURE 146 INDIA MARKET SHARE ANALYSIS BY TYPE (2024)
FIGURE 147 INDIA MARKET SHARE ANALYSIS BY END USER (2024)
FIGURE 148 SOUTH KOREA MARKET SHARE ANALYSIS BY TYPE (2024)
FIGURE 149 SOUTH KOREA MARKET SHARE ANALYSIS BY END USER (2024)
FIGURE 150 SAUDI ARABIA MARKET SHARE ANALYSIS BY TYPE (2024)
FIGURE 151 SAUDI ARABIA MARKET SHARE ANALYSIS BY END USER (2024)
FIGURE 152 UAE MARKET SHARE ANALYSIS BY TYPE (2024)
FIGURE 153 UAE MARKET SHARE ANALYSIS BY END USER (2024)
FIGURE 154 EGYPT MARKET SHARE ANALYSIS BY TYPE (2024)
FIGURE 155 EGYPT MARKET SHARE ANALYSIS BY END USER (2024)
FIGURE 156 NIGERIA MARKET SHARE ANALYSIS BY TYPE (2024)
FIGURE 157 NIGERIA MARKET SHARE ANALYSIS BY END USER (2024)
FIGURE 158 SOUTH AFRICA MARKET SHARE ANALYSIS BY TYPE (2024)
FIGURE 159 SOUTH AFRICA MARKET SHARE ANALYSIS BY END USER (2024)
FIGURE 160 GERMANY MARKET SHARE ANALYSIS BY TYPE (2024)
FIGURE 161 GERMANY MARKET SHARE ANALYSIS BY END USER (2024)
FIGURE 162 FRANCE MARKET SHARE ANALYSIS BY TYPE (2024)
FIGURE 163 FRANCE MARKET SHARE ANALYSIS BY END USER (2024)
FIGURE 164 UK MARKET SHARE ANALYSIS BY TYPE (2024)
FIGURE 165 UK MARKET SHARE ANALYSIS BY END USER (2024)
FIGURE 166 SPAIN MARKET SHARE ANALYSIS BY TYPE (2024)
FIGURE 167 SPAIN MARKET SHARE ANALYSIS BY END USER (2024)
FIGURE 168 ITALY MARKET SHARE ANALYSIS BY TYPE (2024)
FIGURE 169 ITALY MARKET SHARE ANALYSIS BY END USER (2024)
FIGURE 170 BRAZIL MARKET SHARE ANALYSIS BY TYPE (2024)
FIGURE 171 BRAZIL MARKET SHARE ANALYSIS BY END USER (2024)
FIGURE 172 ARGENTINA MARKET SHARE ANALYSIS BY TYPE (2024)
FIGURE 173 ARGENTINA MARKET SHARE ANALYSIS BY END USER (2024)
FIGURE 174 COLUMBIA MARKET SHARE ANALYSIS BY TYPE (2024)
FIGURE 175 COLUMBIA MARKET SHARE ANALYSIS BY END USER (2024)
FIGURE 176 GLOBAL PRESSURE SENSITIVE ADHESIVES CURRENT AND FUTURE MARKET KEY COUNTRY LEVEL ANALYSIS, 2024–2034, (USD MILLION)
FIGURE 177 FINANCIAL OVERVIEW:
Key Players Analysis:
Henkel AG & Co. KgaA: Henkel is a global leader in adhesives, with a significant presence in the PSA market. Their extensive product portfolio caters to various industries, including automotive, electronics, and packaging. Henkel's commitment to innovation and sustainability has solidified its position as a key player in the PSA sector.
3M: 3M is renowned for its innovation in the PSA industry, offering a wide range of products used in sectors like healthcare, automotive, and consumer goods. Their strong R&D capabilities have led to the development of high-performance adhesives that meet diverse application needs.
H.B. Fuller Company: H.B. Fuller is a prominent manufacturer of adhesives, including PSAs, serving markets such as packaging, hygiene, and electronics. Their focus on customer-centric solutions and sustainable practices has enhanced their reputation in the PSA market.
Avery Dennison Corporation: Avery Dennison specializes in labeling and packaging materials, with a strong emphasis on PSAs. Their innovative adhesive technologies are widely used in retail, logistics, and healthcare industries, making them a key player in the PSA landscape.
Nitto Denko Corporation: Nitto Denko is a leading Japanese company in the PSA market, known for its advanced adhesive solutions used in electronics, automotive, and medical applications. Their commitment to research and development has driven the creation of high-quality PSA products.
Market Key Players
Henkel AG and Co. KGaA
Advance Tapes International Limited
H.B. Fuller Company
Eastman Chemical Company
Arkema
3M
Nitto Denko Corporation
Sika AG
Exxon Mobil Corporation
Ashland, Inc.
Pidilite Industries Ltd.
Illinois Tool Works Inc
Momentive Performance Materials, Inc.
Tesa SE
Franklin International, Inc.
Wacker Chemie AG
DuPont de Nemours, Inc.
Helmitin Adhesives
Avery Dennison Corporation
DIC Corporation
Driver:
Boom in E-commerce and Packaging Demand
E-commerce has transformed global trade by increasing the demand for secure, efficient packaging solutions. PSAs are ideal for labels, tapes, and corrugated boxes because they offer strong adhesion without the need for heat or water. With the rise in online shopping, especially post-COVID-19, logistics and packaging companies are increasingly relying on PSAs to improve efficiency and reduce waste. This steady packaging growth continues to drive PSA consumption, especially in Asia-Pacific and North America.
Automotive and Electronics Sector Growth
In automotive and consumer electronics, PSAs replace mechanical fasteners and liquid adhesives to enable lightweight assembly, vibration damping, and easy disassembly. Their application in interior trims, wire harnessing, and smartphones reflects their growing industrial role. As vehicle electrification and miniaturization trends accelerate, the demand for high-performance PSAs offering durability, flexibility, and heat resistance is surging.
Restrain:
Regulatory and Environmental Challenges
Solvent-based PSAs release volatile organic compounds (VOCs), which contribute to air pollution and health hazards. Regulatory agencies in Europe and North America have tightened restrictions on VOC emissions, pushing manufacturers toward water-based or hot-melt alternatives. However, these transitions demand high capital investment and R&D, limiting the adaptability of smaller players and slowing market momentum in regulated regions.
Volatility in Raw Material Prices
PSAs are derived from petroleum-based raw materials like rubber, resins, and acrylics. Market instability, geopolitical tensions, and oil price fluctuations directly impact the cost of these components. For manufacturers, especially in developing economies, this unpredictability leads to increased production costs, supply chain issues, and reduced profit margins, creating challenges in sustaining competitive pricing.
Opportunities:
Sustainability and Bio-Based PSA Development
The global movement toward eco-friendly solutions is pushing manufacturers to innovate with bio-based or solvent-free adhesives. Derived from renewable sources like natural rubber and plant-based resins, these PSAs reduce carbon footprint and VOC emissions. Companies that develop recyclable, biodegradable PSAs are likely to gain regulatory support and consumer favor, unlocking potential in eco-conscious industries like food packaging, apparel, and cosmetics.
Emergence of Wearable Tech and Medical Devices
Healthcare and electronics are merging, fueling demand for PSAs in devices like fitness trackers, sensors, and drug delivery patches. These applications require skin-friendly, breathable adhesives that perform under stress and sweat. The PSA market is seeing innovation in low-irritation and high-adhesion formulations designed specifically for medical-grade wearables, representing a promising frontier for expansion.
Trends:
Adoption of Advanced Adhesive Technologies
Modern PSAs now incorporate hot-melt, UV-curable, and silicone-based systems to meet the demands of temperature stability, quick curing, and enhanced shelf life. These innovations reduce application time, energy consumption, and improve bonding strength on difficult surfaces. As industries like aerospace and EV manufacturing adopt advanced materials, there is growing reliance on high-tech PSAs to maintain structural integrity and performance in demanding environments.
Growth of Smart Packaging and Labeling
Retail, pharma, and logistics are increasingly integrating smart labels, RFID tags, and tamper-evident tapes that rely on PSAs for secure application. These smart adhesive solutions help track inventory, prevent fraud, and improve user interaction. With rising regulatory focus on product traceability and anti-counterfeiting measures, especially in pharmaceuticals and food products, PSA demand in intelligent packaging continues to expand rapidly.
Recent Development:
In August 2024 - At LabelExpo 2024 in Chicago, held from September 10–12, Henkel unveiled two new sustainable pressure-sensitive adhesives: Technomelt 4144 RE and Technomelt PS 9625 RE. These adhesives, part of Henkel’s RE product range, are certified by the Tag and Label Manufacturers Institute (TLMI) as compatible with post-consumer recycling processes, underscoring Henkel’s commitment to advancing sustainability in packaging solutions.
In March 2024 - Bostik, the adhesive solutions division of Arkema, has expanded its UV acrylic hot melt pressure sensitive adhesive (UV acrylic HMPSA) manufacturing capabilities in North America, effective April 2024. This investment enables Bostik to increase production of UV acrylic HMPSAs at its regional facilities and introduce a broader range of high-performance adhesives to the market.