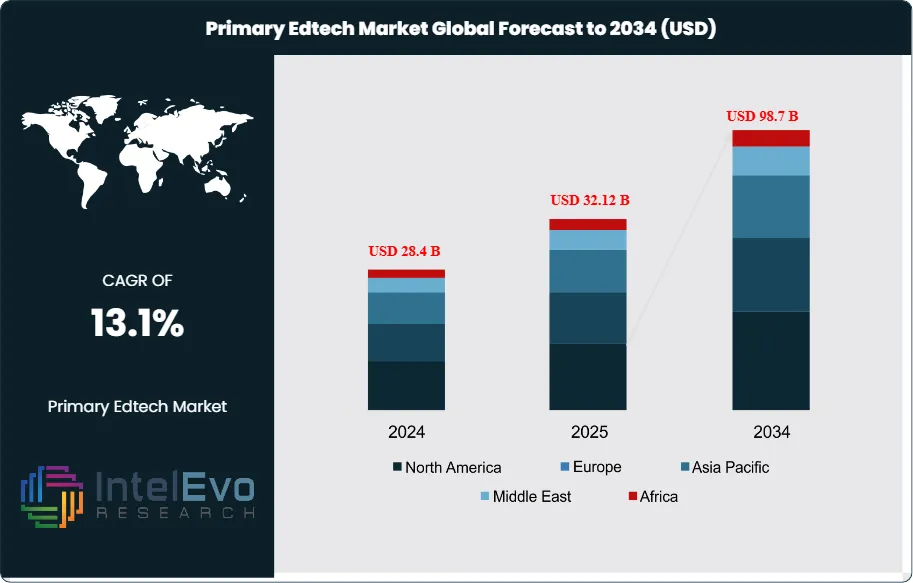
The Primary Edtech Market is projected to reach USD 98.7 Billion by 2034, up from USD 28.4 Billion in 2024, growing at a CAGR of 13.1% during the forecast period from 2024 to 2034. The primary edtech market encompasses a broad spectrum of digital solutions, platforms, and services designed to enhance learning outcomes, engagement, and accessibility for primary (K-6) students.
This market includes interactive learning platforms, digital content, assessment tools, classroom management software, and integrated services for implementation and teacher training. The edtech ecosystem serves diverse educational stakeholders, including schools, teachers, students, parents, and education ministries, enabling personalized learning, real-time progress tracking, and collaborative classroom experiences worldwide.
The market is experiencing robust growth driven by the increasing demand for personalized and blended learning, the integration of advanced technologies such as artificial intelligence, gamification, and adaptive learning, and the need to bridge educational gaps. Key growth catalysts include the expansion of device access, government digital education initiatives, and the proliferation of cloud-based platforms that support remote and hybrid learning. The market also benefits from a growing emphasis on teacher professional development and the adoption of data-driven decision-making in primary education.
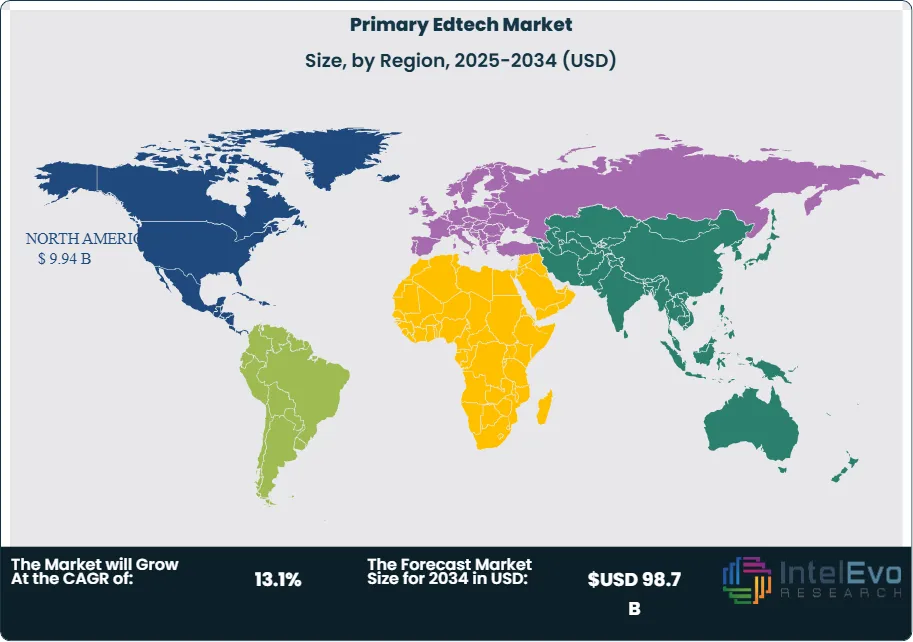
North America maintains its position as the leading regional market for primary edtech, commanding the largest global market share and generating the highest revenues within the sector. This dominance is attributed to early technology adoption, strong investment in digital infrastructure, and supportive education policies. The United States serves as the primary contributor to North America's market leadership, with substantial revenue generation and strong growth projections. Meanwhile, the Asia-Pacific region emerges as the most rapidly expanding market segment, propelled by large student populations, government-led digital learning programs, and increasing internet penetration.
The COVID-19 pandemic accelerated digital transformation in primary education, highlighting the importance of edtech for remote learning, student engagement, and educational continuity. The crisis underscored the value of scalable, accessible digital platforms and prompted schools to invest in robust edtech ecosystems. While initial challenges included device shortages and digital divides, the long-term impact has been positive, with increased recognition of edtech’s role in building resilient, future-ready education systems. Rising concerns about learning loss, equity, and student well-being are influencing product innovation and market competition. Edtech providers are investing in AI-driven analytics, social-emotional learning tools, and inclusive content to address diverse learner needs. Additionally, the growing focus on data privacy and cybersecurity is shaping procurement decisions and platform design.
Key Takeaways
Market Growth: The Primary Edtech Market is expected to reach USD 98.7 Billion by 2034, fueled by growing demand for personalized learning, digital content, and hybrid classroom solutions.
Technology Dominance: Enabling technologies such as AI, gamification, and adaptive learning lead the segment, due to their foundational role in driving engagement and learning outcomes.
Component Dominance: Software platforms dominate, driven by their essential role in content delivery, assessment, and classroom management.
Enterprise Size Dominance: Large education solution providers lead the segment, primarily due to higher investment capacity, global reach, and comprehensive product portfolios.
Verticals Dominance: Public primary schools hold the largest share, owing to broad student bases and government funding for digital transformation.
Driver: Key drivers accelerating growth include the demand for personalized learning and government digital education initiatives, which boost market expansion through improved access and engagement.
Restraint: Growth is hindered by digital divides and budget constraints, which create barriers to adoption and equitable access.
Opportunity: The market is poised for expansion due to opportunities like AI integration, emerging market penetration, and the development of inclusive, multilingual content.
Trend: Emerging trends including hybrid learning models, social-emotional learning, and data-driven instruction are reshaping the market by enabling flexible, holistic education.
Regional Analysis: North America leads owing to early technology adoption and established digital infrastructure. Asia-Pacific shows high promise due to large student populations and government investment.
Technology Analysis:
Enabling technologies such as artificial intelligence, gamification, and adaptive learning form the foundation of the primary edtech market. Artificial intelligence drives the creation of personalized learning paths, delivers real-time feedback, and supports predictive analytics that help teachers identify and address learning gaps early. Gamification techniques, including points, badges, and interactive challenges, significantly boost student engagement and motivation, making learning more enjoyable and effective. Adaptive learning platforms further enhance outcomes by dynamically adjusting content and pacing to suit each student’s unique needs, supporting differentiated instruction in diverse classrooms. The ongoing evolution of cloud computing, mobile applications, and data analytics continues to accelerate innovation and adoption, ensuring that edtech solutions remain accessible, scalable, and impactful across the sector.
Component Analysis:
Software platforms are at the heart of the primary edtech ecosystem, playing a crucial role in delivering digital content, managing classrooms, and assessing student progress. This category encompasses learning management systems (LMS), interactive content platforms, assessment tools, and teacher dashboards, all designed to streamline the educational process for both teachers and students. The dominance of software is driven by the need for solutions that are scalable, flexible, and user-friendly, capable of supporting a wide range of curricula and learning environments. As schools increasingly adopt blended and remote learning models, robust software platforms enable seamless integration of digital resources, real-time communication, and data-driven instruction.
Enterprise Size Analysis:
Large edtech companies and solution providers are the primary drivers of innovation and adoption in the primary edtech market. Their substantial resources allow for significant investment in research and development, enabling them to create comprehensive, integrated solutions that address the complex needs of schools and districts. These organizations are often at the forefront of digital transformation, leveraging technology to deliver scalable platforms, ensure data privacy compliance, and support large-scale deployments. Their global distribution networks and established reputations provide a competitive edge, allowing them to maintain leadership in a rapidly evolving and increasingly competitive industry.
Verticals Analysis:
Public primary schools constitute the largest segment of the primary edtech market, largely due to their broad student populations, access to government funding, and participation in national digital education initiatives. These schools are key adopters of digital textbooks, interactive lessons, formative assessments, and teacher professional development programs. The prominence of public schools in the market is further reinforced by significant investments in digital infrastructure, supportive policy frameworks, and strategic partnerships with edtech providers. These factors collectively drive widespread adoption and integration of technology in primary education, ensuring that digital learning benefits reach the largest possible number of students.
Region Analysis:
North America leads the global primary edtech market, accounting for over 35% of the market share, thanks to its advanced digital infrastructure, early embrace of educational technology, and robust policy support. The United States, in particular, plays a pivotal role by investing heavily in edtech startups, research, and large-scale digital learning initiatives that set industry benchmarks. Asia-Pacific is the fastest-growing region, propelled by its vast student populations, government-led digital learning programs, and rapidly increasing internet and device penetration. Countries like China, India, and Australia are at the forefront of this expansion, with schools rapidly adopting digital platforms and content to enhance learning outcomes. Europe maintains a strong presence in the market, supported by established education systems, high levels of digital literacy, and a strong emphasis on equity and inclusion. The region’s adoption of edtech is shaped by comprehensive regulatory frameworks, the need for multilingual content, and active engagement from leading solution providers, ensuring that technology-driven education is both accessible and inclusive.
Technology (Artificial Intelligence, Gamification, Adaptive Learning, Cloud-Based Platforms, Mobile Apps) Component (Software Platforms, Digital Content, Assessment Tools, Services) Verticals (Public Primary Schools, Private Primary Schools, Homeschooling Networks) Enterprise Size (Small and Medium Edtech Providers, Large Edtech Providers)
Research Methodology
Primary Research- 100 Interviews of Stakeholders
Secondary Research
Desk Research
Regional scope
North America (United States, Canada, Mexico)
Latin America (Brazil, Argentina, Columbia)
East Asia And Pacific (China, Japan, South Korea, Australia, Cambodia, Fiji, Indonesia)
Sea And South Asia (India, Singapore, Thailand, Taiwan, Malaysia)
Eastern Europe (Poland, Russia, Czech Republic, Romania)
Western Europe (Germany, U.K., France, Spain, Itlay)
Middle East & Africa (GCC Countries, Egypt, Nigeria, South Africa, Israel)
Competitive Landscape
Byju’s, Pearson, Kahoot!, Google for Education, Microsoft Education, Edmodo, Seesaw, ClassDojo, Discovery Education, Scholastic, SMART Technologies
Customization Scope
Customization for segments, region/country-level will be provided. Moreover, additional customization can be done based on the requirements.
Pricing and Purchase Options
Avail customized purchase options to meet your exact research needs. We have three licenses to opt for: Single User License, Multi-User License (Up to 5 Users), Corporate Use License (Unlimited User and Printable PDF).
TABLE OF CONTENTS
1. EXECUTIVE SUMMARY
1.1. MARKET SNAPSHOT
1.2. KEY FINDINGS & INSIGHTS
1.3. ANALYST RECOMMENDATIONS
1.4. FUTURE OUTLOOK
2. RESEARCH METHODOLOGY
2.1. MARKET DEFINITION & SCOPE
2.2. RESEARCH OBJECTIVES: PRIMARY & SECONDARY DATA SOURCES
2.3. DATA COLLECTION SOURCES
2.3.1. COVERAGE OF 100+ PRIMARY RESEARCH/CONSULTATION CALLS WITH INDUSTRY STAKEHOLDERS
FIGURE 17 NORTH AMERICA PRIMARY EDTECH CURRENT AND FUTURE TYPE ANALYSIS, 2025–2034, (USD MILLION)
FIGURE 18 NORTH AMERICA PRIMARY EDTECH CURRENT AND FUTURE END USER ANALYSIS, 2025–2034, (USD MILLION)
FIGURE 19 MARKET SHARE BY COUNTRY
FIGURE 20 LATIN AMERICA PRIMARY EDTECH CURRENT AND FUTURE TYPE ANALYSIS, 2025–2034, (USD MILLION)
FIGURE 21 LATIN AMERICA PRIMARY EDTECH CURRENT AND FUTURE END USER ANALYSIS, 2025–2034, (USD MILLION)
FIGURE 22 MARKET SHARE BY COUNTRY
FIGURE 23 EASTERN EUROPE PRIMARY EDTECH CURRENT AND FUTURE TYPE ANALYSIS, 2025–2034, (USD MILLION)
FIGURE 24 EASTERN EUROPE PRIMARY EDTECH CURRENT AND FUTURE END USER ANALYSIS, 2025–2034, (USD MILLION)
FIGURE 25 MARKET SHARE BY COUNTRY
FIGURE 26 WESTERN EUROPE PRIMARY EDTECH CURRENT AND FUTURE TYPE ANALYSIS, 2025–2034, (USD MILLION)
FIGURE 27 WESTERN EUROPE PRIMARY EDTECH CURRENT AND FUTURE END USER ANALYSIS, 2025–2034, (USD MILLION)
FIGURE 28 MARKET SHARE BY COUNTRY
FIGURE 29 EAST ASIA AND PACIFIC PRIMARY EDTECH CURRENT AND FUTURE TYPE ANALYSIS, 2025–2034, (USD MILLION)
FIGURE 30 EAST ASIA AND PACIFIC PRIMARY EDTECH CURRENT AND FUTURE END USER ANALYSIS, 2025–2034, (USD MILLION)
FIGURE 31 MARKET SHARE BY COUNTRY
FIGURE 32 SEA AND SOUTH ASIA PRIMARY EDTECH CURRENT AND FUTURE TYPE ANALYSIS, 2025–2034, (USD MILLION)
FIGURE 33 SEA AND SOUTH ASIA PRIMARY EDTECH CURRENT AND FUTURE END USER ANALYSIS, 2025–2034, (USD MILLION)
FIGURE 34 MARKET SHARE BY COUNTRY
FIGURE 35 MIDDLE EAST AND AFRICA PRIMARY EDTECH CURRENT AND FUTURE TYPE ANALYSIS, 2025–2034, (USD MILLION)
FIGURE 36 MIDDLE EAST AND AFRICA PRIMARY EDTECH CURRENT AND FUTURE END USER ANALYSIS, 2025–2034, (USD MILLION)
FIGURE 37 NORTH AMERICA PRIMARY EDTECH CURRENT AND FUTURE MARKET VOLUME SHARE REGIONAL ANALYSIS, 2025–2034, (USD MILLION)
FIGURE 38 U.S. PRIMARY EDTECH CURRENT AND FUTURE TYPE ANALYSIS, 2025–2034, (USD MILLION)
FIGURE 39 U.S. PRIMARY EDTECH CURRENT AND FUTURE END USER ANALYSIS, 2025–2034, (USD MILLION)
FIGURE 40 CANADA PRIMARY EDTECH CURRENT AND FUTURE TYPE ANALYSIS, 2025–2034, (USD MILLION)
FIGURE 41 CANADA PRIMARY EDTECH CURRENT AND FUTURE END USER ANALYSIS, 2025–2034, (USD MILLION)
FIGURE 42 LATIN AMERICA PRIMARY EDTECH CURRENT AND FUTURE MARKET VOLUME SHARE REGIONAL ANALYSIS, 2025–2034, (USD MILLION)
FIGURE 43 MEXICO PRIMARY EDTECH CURRENT AND FUTURE TYPE ANALYSIS, 2025–2034, (USD MILLION)
FIGURE 44 MEXICO PRIMARY EDTECH CURRENT AND FUTURE END USER ANALYSIS, 2025–2034, (USD MILLION)
FIGURE 45 BRAZIL PRIMARY EDTECH CURRENT AND FUTURE TYPE ANALYSIS, 2025–2034, (USD MILLION)
FIGURE 46 BRAZIL PRIMARY EDTECH CURRENT AND FUTURE END USER ANALYSIS, 2025–2034, (USD MILLION)
FIGURE 47 ARGENTINA PRIMARY EDTECH CURRENT AND FUTURE TYPE ANALYSIS, 2025–2034, (USD MILLION)
FIGURE 48 ARGENTINA PRIMARY EDTECH CURRENT AND FUTURE END USER ANALYSIS, 2025–2034, (USD MILLION)
FIGURE 49 COLUMBIA PRIMARY EDTECH CURRENT AND FUTURE TYPE ANALYSIS, 2025–2034, (USD MILLION)
FIGURE 50 COLUMBIA PRIMARY EDTECH CURRENT AND FUTURE END USER ANALYSIS, 2025–2034, (USD MILLION)
FIGURE 51 REST OF LATIN AMERICA PRIMARY EDTECH CURRENT AND FUTURE TYPE ANALYSIS, 2025–2034, (USD MILLION)
FIGURE 52 REST OF LATIN AMERICA PRIMARY EDTECH CURRENT AND FUTURE END USER ANALYSIS, 2025–2034, (USD MILLION)
FIGURE 53 EASTERN EUROPE PRIMARY EDTECH CURRENT AND FUTURE MARKET VOLUME SHARE REGIONAL ANALYSIS, 2025–2034, (USD MILLION)
FIGURE 54 POLAND PRIMARY EDTECH CURRENT AND FUTURE TYPE ANALYSIS, 2025–2034, (USD MILLION)
FIGURE 55 POLAND PRIMARY EDTECH CURRENT AND FUTURE END USER ANALYSIS, 2025–2034, (USD MILLION)
FIGURE 56 RUSSIA PRIMARY EDTECH CURRENT AND FUTURE TYPE ANALYSIS, 2025–2034, (USD MILLION)
FIGURE 57 RUSSIA PRIMARY EDTECH CURRENT AND FUTURE END USER ANALYSIS, 2025–2034, (USD MILLION)
FIGURE 58 CZECH REPUBLIC PRIMARY EDTECH CURRENT AND FUTURE TYPE ANALYSIS, 2025–2034, (USD MILLION)
FIGURE 59 CZECH REPUBLIC PRIMARY EDTECH CURRENT AND FUTURE END USER ANALYSIS, 2025–2034, (USD MILLION)
FIGURE 60 ROMANIA PRIMARY EDTECH CURRENT AND FUTURE TYPE ANALYSIS, 2025–2034, (USD MILLION)
FIGURE 61 ROMANIA PRIMARY EDTECH CURRENT AND FUTURE END USER ANALYSIS, 2025–2034, (USD MILLION)
FIGURE 62 REST OF EASTERN EUROPE PRIMARY EDTECH CURRENT AND FUTURE TYPE ANALYSIS, 2025–2034, (USD MILLION)
FIGURE 63 REST OF EASTERN EUROPE PRIMARY EDTECH CURRENT AND FUTURE END USER ANALYSIS, 2025–2034, (USD MILLION)
FIGURE 64 WESTERN EUROPE PRIMARY EDTECH CURRENT AND FUTURE MARKET VOLUME SHARE REGIONAL ANALYSIS, 2025–2034, (USD MILLION)
FIGURE 65 GERMANY PRIMARY EDTECH CURRENT AND FUTURE TYPE ANALYSIS, 2025–2034, (USD MILLION)
FIGURE 66 GERMANY PRIMARY EDTECH CURRENT AND FUTURE END USER ANALYSIS, 2025–2034, (USD MILLION)
FIGURE 67 FRANCE PRIMARY EDTECH CURRENT AND FUTURE TYPE ANALYSIS, 2025–2034, (USD MILLION)
FIGURE 68 FRANCE PRIMARY EDTECH CURRENT AND FUTURE END USER ANALYSIS, 2025–2034, (USD MILLION)
FIGURE 69 UK PRIMARY EDTECH CURRENT AND FUTURE TYPE ANALYSIS, 2025–2034, (USD MILLION)
FIGURE 70 UK PRIMARY EDTECH CURRENT AND FUTURE END USER ANALYSIS, 2025–2034, (USD MILLION)
FIGURE 71 SPAIN PRIMARY EDTECH CURRENT AND FUTURE TYPE ANALYSIS, 2025–2034, (USD MILLION)
FIGURE 72 SPAIN PRIMARY EDTECH CURRENT AND FUTURE END USER ANALYSIS, 2025–2034, (USD MILLION)
FIGURE 73 ITALY PRIMARY EDTECH CURRENT AND FUTURE TYPE ANALYSIS, 2025–2034, (USD MILLION)
FIGURE 74 ITALY PRIMARY EDTECH CURRENT AND FUTURE END USER ANALYSIS, 2025–2034, (USD MILLION)
FIGURE 75 REST OF WESTERN EUROPE PRIMARY EDTECH CURRENT AND FUTURE TYPE ANALYSIS, 2025–2034, (USD MILLION)
FIGURE 76 REST OF WESTERN EUROPE PRIMARY EDTECH CURRENT AND FUTURE END USER ANALYSIS, 2025–2034, (USD MILLION)
FIGURE 77 EAST ASIA AND PACIFIC PRIMARY EDTECH CURRENT AND FUTURE MARKET VOLUME SHARE REGIONAL ANALYSIS, 2025–2034, (USD MILLION)
FIGURE 78 CHINA PRIMARY EDTECH CURRENT AND FUTURE TYPE ANALYSIS, 2025–2034, (USD MILLION)
FIGURE 79 CHINA PRIMARY EDTECH CURRENT AND FUTURE END USER ANALYSIS, 2025–2034, (USD MILLION)
FIGURE 80 JAPAN PRIMARY EDTECH CURRENT AND FUTURE TYPE ANALYSIS, 2025–2034, (USD MILLION)
FIGURE 81 JAPAN PRIMARY EDTECH CURRENT AND FUTURE END USER ANALYSIS, 2025–2034, (USD MILLION)
FIGURE 82 AUSTRALIA PRIMARY EDTECH CURRENT AND FUTURE TYPE ANALYSIS, 2025–2034, (USD MILLION)
FIGURE 83 AUSTRALIA PRIMARY EDTECH CURRENT AND FUTURE END USER ANALYSIS, 2025–2034, (USD MILLION)
FIGURE 84 CAMBODIA PRIMARY EDTECH CURRENT AND FUTURE TYPE ANALYSIS, 2025–2034, (USD MILLION)
FIGURE 85 CAMBODIA PRIMARY EDTECH CURRENT AND FUTURE END USER ANALYSIS, 2025–2034, (USD MILLION)
FIGURE 86 FIJI PRIMARY EDTECH CURRENT AND FUTURE TYPE ANALYSIS, 2025–2034, (USD MILLION)
FIGURE 87 FIJI PRIMARY EDTECH CURRENT AND FUTURE END USER ANALYSIS, 2025–2034, (USD MILLION)
FIGURE 88 INDONESIA PRIMARY EDTECH CURRENT AND FUTURE TYPE ANALYSIS, 2025–2034, (USD MILLION)
FIGURE 89 INDONESIA PRIMARY EDTECH CURRENT AND FUTURE END USER ANALYSIS, 2025–2034, (USD MILLION)
FIGURE 90 SOUTH KOREA PRIMARY EDTECH CURRENT AND FUTURE TYPE ANALYSIS, 2025–2034, (USD MILLION)
FIGURE 91 SOUTH KOREA PRIMARY EDTECH CURRENT AND FUTURE END USER ANALYSIS, 2025–2034, (USD MILLION)
FIGURE 92 REST OF EAST ASIA AND PACIFIC PRIMARY EDTECH CURRENT AND FUTURE TYPE ANALYSIS, 2025–2034, (USD MILLION)
FIGURE 93 REST OF EAST ASIA AND PACIFIC PRIMARY EDTECH CURRENT AND FUTURE END USER ANALYSIS, 2025–2034, (USD MILLION)
FIGURE 94 SEA AND SOUTH ASIA PRIMARY EDTECH CURRENT AND FUTURE MARKET VOLUME SHARE REGIONAL ANALYSIS, 2025–2034, (USD MILLION)
FIGURE 95 BANGLADESH PRIMARY EDTECH CURRENT AND FUTURE TYPE ANALYSIS, 2025–2034, (USD MILLION)
FIGURE 96 BANGLADESH PRIMARY EDTECH CURRENT AND FUTURE END USER ANALYSIS, 2025–2034, (USD MILLION)
FIGURE 97 NEW ZEALAND PRIMARY EDTECH CURRENT AND FUTURE TYPE ANALYSIS, 2025–2034, (USD MILLION)
FIGURE 98 NEW ZEALAND PRIMARY EDTECH CURRENT AND FUTURE END USER ANALYSIS, 2025–2034, (USD MILLION)
FIGURE 99 INDIA PRIMARY EDTECH CURRENT AND FUTURE TYPE ANALYSIS, 2025–2034, (USD MILLION)
FIGURE 100 INDIA PRIMARY EDTECH CURRENT AND FUTURE END USER ANALYSIS, 2025–2034, (USD MILLION)
FIGURE 101 SINGAPORE PRIMARY EDTECH CURRENT AND FUTURE TYPE ANALYSIS, 2025–2034, (USD MILLION)
FIGURE 102 SINGAPORE PRIMARY EDTECH CURRENT AND FUTURE END USER ANALYSIS, 2025–2034, (USD MILLION)
FIGURE 103 THAILAND PRIMARY EDTECH CURRENT AND FUTURE TYPE ANALYSIS, 2025–2034, (USD MILLION)
FIGURE 104 THAILAND PRIMARY EDTECH CURRENT AND FUTURE END USER ANALYSIS, 2025–2034, (USD MILLION)
FIGURE 105 TAIWAN PRIMARY EDTECH CURRENT AND FUTURE TYPE ANALYSIS, 2025–2034, (USD MILLION)
FIGURE 106 TAIWAN PRIMARY EDTECH CURRENT AND FUTURE END USER ANALYSIS, 2025–2034, (USD MILLION)
FIGURE 107 MALAYSIA PRIMARY EDTECH CURRENT AND FUTURE TYPE ANALYSIS, 2025–2034, (USD MILLION)
FIGURE 108 MALAYSIA PRIMARY EDTECH CURRENT AND FUTURE END USER ANALYSIS, 2025–2034, (USD MILLION)
FIGURE 109 REST OF SEA AND SOUTH ASIA PRIMARY EDTECH CURRENT AND FUTURE TYPE ANALYSIS, 2025–2034, (USD MILLION)
FIGURE 110 REST OF SEA AND SOUTH ASIA PRIMARY EDTECH CURRENT AND FUTURE END USER ANALYSIS, 2025–2034, (USD MILLION)
FIGURE 111 MIDDLE EAST AND AFRICA PRIMARY EDTECH CURRENT AND FUTURE MARKET VOLUME SHARE REGIONAL ANALYSIS, 2025–2034, (USD MILLION)
FIGURE 112 GCC COUNTRIES PRIMARY EDTECH CURRENT AND FUTURE TYPE ANALYSIS, 2025–2034, (USD MILLION)
FIGURE 113 GCC COUNTRIES PRIMARY EDTECH CURRENT AND FUTURE END USER ANALYSIS, 2025–2034, (USD MILLION)
FIGURE 114 SAUDI ARABIA PRIMARY EDTECH CURRENT AND FUTURE TYPE ANALYSIS, 2025–2034, (USD MILLION)
FIGURE 115 SAUDI ARABIA PRIMARY EDTECH CURRENT AND FUTURE END USER ANALYSIS, 2025–2034, (USD MILLION)
FIGURE 116 UAE PRIMARY EDTECH CURRENT AND FUTURE TYPE ANALYSIS, 2025–2034, (USD MILLION)
FIGURE 117 UAE PRIMARY EDTECH CURRENT AND FUTURE END USER ANALYSIS, 2025–2034, (USD MILLION)
FIGURE 118 BAHRAIN PRIMARY EDTECH CURRENT AND FUTURE TYPE ANALYSIS, 2025–2034, (USD MILLION)
FIGURE 119 BAHRAIN PRIMARY EDTECH CURRENT AND FUTURE END USER ANALYSIS, 2025–2034, (USD MILLION)
FIGURE 120 KUWAIT PRIMARY EDTECH CURRENT AND FUTURE TYPE ANALYSIS, 2025–2034, (USD MILLION)
FIGURE 121 KUWAIT PRIMARY EDTECH CURRENT AND FUTURE END USER ANALYSIS, 2025–2034, (USD MILLION)
FIGURE 122 OMAN PRIMARY EDTECH CURRENT AND FUTURE TYPE ANALYSIS, 2025–2034, (USD MILLION)
FIGURE 123 OMAN PRIMARY EDTECH CURRENT AND FUTURE END USER ANALYSIS, 2025–2034, (USD MILLION)
FIGURE 124 QATAR PRIMARY EDTECH CURRENT AND FUTURE TYPE ANALYSIS, 2025–2034, (USD MILLION)
FIGURE 125 QATAR PRIMARY EDTECH CURRENT AND FUTURE END USER ANALYSIS, 2025–2034, (USD MILLION)
FIGURE 126 EGYPT PRIMARY EDTECH CURRENT AND FUTURE TYPE ANALYSIS, 2025–2034, (USD MILLION)
FIGURE 127 EGYPT PRIMARY EDTECH CURRENT AND FUTURE END USER ANALYSIS, 2025–2034, (USD MILLION)
FIGURE 128 NIGERIA PRIMARY EDTECH CURRENT AND FUTURE TYPE ANALYSIS, 2025–2034, (USD MILLION)
FIGURE 129 NIGERIA PRIMARY EDTECH CURRENT AND FUTURE END USER ANALYSIS, 2025–2034, (USD MILLION)
FIGURE 130 SOUTH AFRICA PRIMARY EDTECH CURRENT AND FUTURE TYPE ANALYSIS, 2025–2034, (USD MILLION)
FIGURE 131 SOUTH AFRICA PRIMARY EDTECH CURRENT AND FUTURE END USER ANALYSIS, 2025–2034, (USD MILLION)
FIGURE 132 ISRAEL PRIMARY EDTECH CURRENT AND FUTURE TYPE ANALYSIS, 2025–2034, (USD MILLION)
FIGURE 133 ISRAEL PRIMARY EDTECH CURRENT AND FUTURE END USER ANALYSIS, 2025–2034, (USD MILLION)
FIGURE 134 REST OF MEA PRIMARY EDTECH CURRENT AND FUTURE TYPE ANALYSIS, 2025–2034, (USD MILLION)
FIGURE 135 REST OF MEA PRIMARY EDTECH CURRENT AND FUTURE END USER ANALYSIS, 2025–2034, (USD MILLION)
FIGURE 136 U. S. MARKET SHARE ANALYSIS BY TYPE (2024)
FIGURE 137 U. S. MARKET SHARE ANALYSIS BY END USER (2024)
FIGURE 138 CANADA MARKET SHARE ANALYSIS BY TYPE (2024)
FIGURE 139 CANADA MARKET SHARE ANALYSIS BY END USER (2024)
FIGURE 140 MEXICO MARKET SHARE ANALYSIS BY TYPE (2024)
FIGURE 141 MEXICO MARKET SHARE ANALYSIS BY END USER (2024)
FIGURE 142 CHINA MARKET SHARE ANALYSIS BY TYPE (2024)
FIGURE 143 CHINA MARKET SHARE ANALYSIS BY END USER (2024)
FIGURE 144 JAPAN MARKET SHARE ANALYSIS BY TYPE (2024)
FIGURE 145 JAPAN MARKET SHARE ANALYSIS BY END USER (2024)
FIGURE 146 INDIA MARKET SHARE ANALYSIS BY TYPE (2024)
FIGURE 147 INDIA MARKET SHARE ANALYSIS BY END USER (2024)
FIGURE 148 SOUTH KOREA MARKET SHARE ANALYSIS BY TYPE (2024)
FIGURE 149 SOUTH KOREA MARKET SHARE ANALYSIS BY END USER (2024)
FIGURE 150 SAUDI ARABIA MARKET SHARE ANALYSIS BY TYPE (2024)
FIGURE 151 SAUDI ARABIA MARKET SHARE ANALYSIS BY END USER (2024)
FIGURE 152 UAE MARKET SHARE ANALYSIS BY TYPE (2024)
FIGURE 153 UAE MARKET SHARE ANALYSIS BY END USER (2024)
FIGURE 154 EGYPT MARKET SHARE ANALYSIS BY TYPE (2024)
FIGURE 155 EGYPT MARKET SHARE ANALYSIS BY END USER (2024)
FIGURE 156 NIGERIA MARKET SHARE ANALYSIS BY TYPE (2024)
FIGURE 157 NIGERIA MARKET SHARE ANALYSIS BY END USER (2024)
FIGURE 158 SOUTH AFRICA MARKET SHARE ANALYSIS BY TYPE (2024)
FIGURE 159 SOUTH AFRICA MARKET SHARE ANALYSIS BY END USER (2024)
FIGURE 160 GERMANY MARKET SHARE ANALYSIS BY TYPE (2024)
FIGURE 161 GERMANY MARKET SHARE ANALYSIS BY END USER (2024)
FIGURE 162 FRANCE MARKET SHARE ANALYSIS BY TYPE (2024)
FIGURE 163 FRANCE MARKET SHARE ANALYSIS BY END USER (2024)
FIGURE 164 UK MARKET SHARE ANALYSIS BY TYPE (2024)
FIGURE 165 UK MARKET SHARE ANALYSIS BY END USER (2024)
FIGURE 166 SPAIN MARKET SHARE ANALYSIS BY TYPE (2024)
FIGURE 167 SPAIN MARKET SHARE ANALYSIS BY END USER (2024)
FIGURE 168 ITALY MARKET SHARE ANALYSIS BY TYPE (2024)
FIGURE 169 ITALY MARKET SHARE ANALYSIS BY END USER (2024)
FIGURE 170 BRAZIL MARKET SHARE ANALYSIS BY TYPE (2024)
FIGURE 171 BRAZIL MARKET SHARE ANALYSIS BY END USER (2024)
FIGURE 172 ARGENTINA MARKET SHARE ANALYSIS BY TYPE (2024)
FIGURE 173 ARGENTINA MARKET SHARE ANALYSIS BY END USER (2024)
FIGURE 174 COLUMBIA MARKET SHARE ANALYSIS BY TYPE (2024)
FIGURE 175 COLUMBIA MARKET SHARE ANALYSIS BY END USER (2024)
FIGURE 176 GLOBAL PRIMARY EDTECH CURRENT AND FUTURE MARKET KEY COUNTRY LEVEL ANALYSIS, 2024–2034, (USD MILLION)
FIGURE 177 FINANCIAL OVERVIEW:
Key Players Analysis
Byju’s: Byju’s stands out as a global frontrunner in the primary edtech sector, renowned for its engaging digital content and adaptive learning platform tailored to young learners. The company’s AI-driven personalization ensures that each student receives lessons and practice activities suited to their individual learning pace and style, making education more effective and enjoyable. Byju’s has established a strong presence in both developed and emerging markets, leveraging interactive video lessons, gamified exercises, and real-time feedback to keep students motivated. Its commitment to continuous product innovation and expansion into new geographies has solidified its reputation as a leader in transforming primary education through technology.
Pearson: Pearson is a major force in the primary edtech landscape, offering a comprehensive portfolio of digital learning solutions, assessment tools, and teacher resources. The company’s global reach and longstanding brand recognition make it a trusted partner for schools and educators worldwide. Pearson’s commitment to research-based content ensures that its products are pedagogically sound and aligned with curriculum standards. Its digital platforms support personalized learning, formative and summative assessment, and professional development for teachers, helping schools deliver high-quality education and improve student outcomes in diverse settings.
Kahoot!: Kahoot! has carved a niche in the edtech market with its focus on gamified learning and formative assessment. The platform provides interactive quizzes, games, and activities that make learning fun and engaging for primary students, fostering greater participation and retention. Kahoot!’s cloud-based technology and intuitive interface allow teachers to easily create, share, and track learning activities, supporting both in-class and remote instruction. Its global user base and emphasis on collaborative, student-centered learning have made Kahoot! a popular choice for educators seeking to boost motivation and measure progress in real time.
Google for Education: Google for Education offers a robust suite of digital tools designed to enhance collaboration, communication, and digital literacy in primary schools. With products like Google Classroom, Chromebooks, and productivity apps, Google empowers teachers and students to work together seamlessly, whether in-person or remotely. The platform’s scalability and integration capabilities make it suitable for schools of all sizes, while its widespread adoption is driven by ease of use, affordability, and continuous updates. Google for Education’s commitment to accessibility and innovation has positioned it as a key enabler of digital transformation in primary education worldwide.
Market Key Players
Byju’s
Pearson
Kahoot!
Google for Education
Microsoft Education
Edmodo
Seesaw
ClassDojo
Discovery Education
Scholastic
SMART Technologies
Driver
Personalized and Student-Centered Digital Learning
The primary edtech market is growing due to high demand for personalized, student-centered learning experiences. Digital platforms let educators adjust instruction to meet the needs of individual students by using adaptive content, real-time feedback, and different learning pathways. These tools help teachers spot learning gaps early, customize lesson pacing, and boost student engagement. This approach leads to better academic outcomes and improved knowledge retention across primary education levels.
At the same time, governments around the world are starting large initiatives to modernize education systems, close digital gaps, and promote 21st-century skills like digital literacy, collaboration, and critical thinking. Public funding for digital infrastructure, teacher training, and curriculum digitization is speeding up edtech adoption, especially in public schools where large-scale implementation can have a broad educational impact.
Restraint
Digital Divide in Access and Infrastructure
Despite the strong growth, the primary edtech market faces challenges with unequal access to devices, internet connection, and digital skills—particularly in low-income and rural areas. Limited technological infrastructure makes it hard to effectively deploy digital learning platforms, reducing how much students and teachers can benefit from edtech solutions, which limits market growth.
Budget Limitations and Funding Uncertainty
Budget issues within school systems also hinder adoption, especially when technology funding is inconsistent or reliant on short-term grants. The high initial costs for devices, software licenses, and maintenance can slow implementation, increasing the risk of educational inequality and delaying the digital transformation in primary education.
Opportunities
AI-Driven Learning and Administrative Automation
The use of artificial intelligence, data analytics, and adaptive learning technologies offers significant growth opportunities for primary edtech providers. AI-powered tools can personalize instruction on a large scale, automate grading and administrative tasks, and provide insights that help educators and school administrators make informed decisions.
Growth Potential in Emerging Education Markets
Emerging markets in Asia-Pacific, Latin America, and Africa present significant opportunities for growth due to increasing student populations, higher public education spending, and greater awareness of the benefits of digital learning. The demand for inclusive, multilingual, and culturally relevant edtech solutions is expected to rise, allowing providers to meet localized learning needs and expand their global presence.
Trends
Expansion of Hybrid Learning Models
Hybrid learning models that mix in-person instruction with digital platforms are becoming common in primary education. These models provide flexibility, maintain continuity during disruptions, and improve access to learning resources. They allow schools to combine traditional teaching methods with technology-supported instruction.
Rise of SEL and Data-Driven Teaching Practices
Social-emotional learning (SEL) tools are becoming more important as schools focus on student well-being along with academic success. At the same time, real-time analytics and formative assessment tools support data-driven teaching, helping teachers track progress, personalize interventions, and enhance educational results in a more organized and measurable way.
Recent Development
In June 2025: Byju’s made a significant leap in primary education technology by launching an AI-powered adaptive learning platform specifically designed for young learners. This platform personalizes lesson paths for each student, using artificial intelligence to assess individual strengths, weaknesses, and learning styles. Real-time feedback mechanisms help students stay engaged and motivated, while also enabling teachers and parents to monitor progress and intervene when necessary. The adaptive approach ensures that every child receives instruction tailored to their unique needs, ultimately improving learning outcomes and fostering a love for learning at an early age.
In May 2025: Pearson introduced a comprehensive suite of digital assessment tools aimed at primary schools, revolutionizing how student progress is measured and supported. These tools facilitate both formative and summative evaluations, allowing teachers to track student understanding continuously and at key milestones. Instant analytics provide educators with actionable insights, enabling timely interventions and personalized support for students who may be struggling. The new suite is designed to integrate seamlessly with existing digital learning environments, making assessment more efficient, data-driven, and aligned with modern pedagogical practices.
In April 2025: Kahoot! expanded its impact in primary education by partnering with a major education ministry to implement gamified learning modules across public primary schools. These interactive modules use game-based elements to make learning more engaging and enjoyable for students, increasing participation and motivation in the classroom. The partnership aims to foster a more dynamic and interactive learning environment, helping teachers capture students’ attention and reinforce key concepts through play. This initiative reflects the growing recognition of gamification as a powerful tool for improving educational outcomes in early education.
In March 2025: Google for Education took a major step toward bridging the digital divide by expanding its Chromebook program to underserved primary schools in the Asia-Pacific region. The initiative provides affordable devices and access to a suite of cloud-based educational resources, empowering schools with limited budgets to implement digital learning. By equipping students and teachers with reliable technology and collaborative tools, Google is helping to level the playing field and ensure that more children have access to quality digital education, regardless of their socioeconomic background.