Process Analytical Technology Market Size | 11.6% CAGR
Global Process Analytical Technology Market Size, Share & Analysis By Technique (Spectroscopy, Chromatography), By End-User (Pharma, Biotech), Industry Outlook, Regulatory Compliance Trends & Forecast 2025–2034
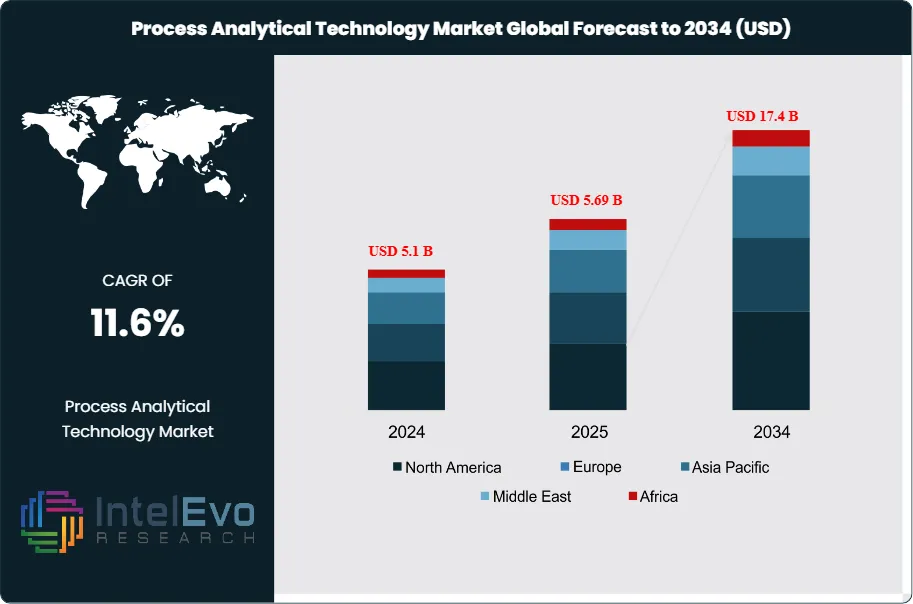
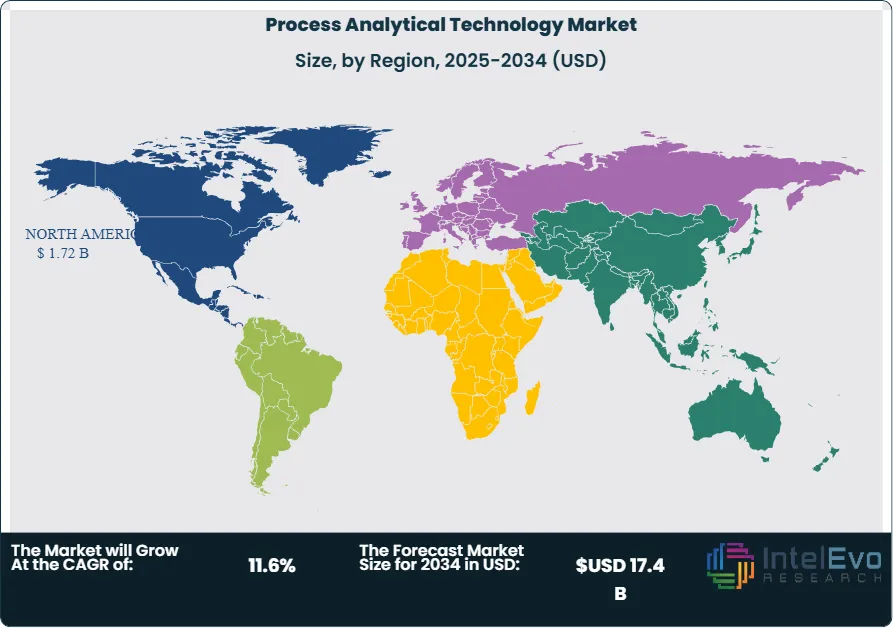
The Process Analytical Technology (PAT) Market is valued at approximately USD 5.1 billion in 2024 and is projected to reach nearly USD 17.4 billion by 2034, expanding at a strong CAGR of about 11.6% from 2025–2034. Growth is being fueled by the pharmaceutical industry’s accelerated shift toward continuous manufacturing, real-time quality assurance, and data-driven process optimization. As regulators such as the U.S. FDA, EMA, and PMDA push for enhanced process visibility and Quality-by-Design (QbD) adoption, PAT tools—ranging from spectroscopy and chromatography to advanced multivariate analytics—are becoming mission-critical. With AI-powered process control, digital twins, and Industry 4.0 integrations gaining momentum, the PAT market is rapidly trending across pharma, biotech, food processing, and specialty chemicals.
The market has evolved significantly in recent years, driven by increasing demand for precision, efficiency, and compliance in industrial production. Originally adopted in pharmaceutical manufacturing to improve product consistency and regulatory compliance, PAT has now expanded across multiple sectors including chemicals, food and beverage, and biotechnology. The shift from batch to continuous manufacturing has further accelerated adoption, as companies seek real-time control over process variables to reduce waste and improve yield.
Demand-side factors are playing a key role in shaping growth. Industries are under mounting pressure to meet stringent quality standards while managing costs. This has elevated the need for real-time analytics and automated control systems. On the supply side, the availability of integrated PAT solutions—combining hardware, software, and analytics—is enabling faster deployment and reducing technical complexity. However, high upfront costs, legacy infrastructure, and regulatory constraints remain challenges to broader implementation, particularly in small and mid-sized enterprises.
Technological advancement is central to the market’s trajectory. The integration of artificial intelligence and machine learning is enabling predictive analytics, while cloud-based platforms are simplifying data access and remote monitoring. Key techniques such as near-infrared (NIR) spectroscopy, Raman spectroscopy, and chromatography are being enhanced through better sensors, faster processors, and smarter algorithms. These developments are shortening feedback loops, reducing downtime, and improving batch consistency.
Regionally, North America holds a leading position due to strong regulatory mandates from the FDA and high investment in pharmaceutical R&D. Europe follows closely, driven by increasing adoption across the biotech and food processing sectors. Asia-Pacific is emerging as a high-growth region, supported by rising manufacturing output and expanding life sciences industries, particularly in China and India. Investors should monitor these markets closely, as infrastructure modernization and policy support are expected to create new opportunities.
The market’s outlook remains strong, with technological readiness, regulatory clarity, and industrial demand aligning to support sustained growth over the forecast period.
Key Takeaways
Market Growth: The global Process Analytical Technology (PAT) market was valued at USD 5.1 billion in 2024 and is projected to reach approximately USD 17.4 billion by 2034, registering a robust CAGR of 11.6% during 2025–2034. Growth is primarily driven by rising demand for real-time process monitoring and quality assurance across manufacturing industries.
Technology: Spectroscopy led the market in 2022, accounting for 43.1% of total revenue. Its dominance is driven by widespread adoption of NIR and Raman spectroscopy for non-destructive, real-time analysis in pharmaceutical and chemical production.
Product Type: Analyzers represented the largest product segment in 2022 with a 32% revenue share, supported by growing use of sensor-based systems for in-process quality monitoring and batch consistency.
Application: Large molecule analysis held the leading share among application types in 2022, reflecting increasing biologics production and the complexity of protein-based drugs requiring advanced monitoring techniques.
Measurement Type: In-line measurement systemscaptured the largest revenue share of 42.5% in 2022. Their integration into production lines enables continuous process monitoring without sample extraction, reducing delays and enhancing efficiency.
End Use: Pharmaceutical manufacturers accounted for 32.5% of market revenue in 2022, as regulatory pressure and demand for consistent product quality drive PAT implementation in drug development and manufacturing.
Driver: Rising regulatory mandates from agencies like the FDA and EMA are compelling pharmaceutical firms to adopt PAT solutions. The need for real-time quality control in continuous manufacturing is accelerating demand.
Restraint: High implementation costs and integration challenges with legacy systems are limiting adoption, particularly among small- and mid-sized manufacturers.
Opportunity: The Asia-Pacific region presents a significant opportunity, supported by expanding pharmaceutical manufacturing in India and China. The region is projected to grow at a double-digit CAGR through 2032.
Trend: Integration of AI and machine learning into PAT systems is gaining traction. Predictive analytics are being deployed to improve process efficiency and minimize deviations in real-time.
Regional Analysis: North America led the global market in 2022 with a 33.8% revenue share, supported by strong R&D investment and early regulatory support. Asia-Pacific is the fastest-growing region, driven by industrial expansion and increasing government focus on manufacturing modernization.
As of 2025, spectroscopy remains the dominant technology in the global process analytical technology (PAT) market, accounting for approximately 43.1% of total revenue. This segment continues to lead due to its ability to deliver real-time insights into the chemical and physical attributes of materials across a range of industries. Technologies such as Fourier-transform infrared (FTIR) and near-infrared (NIR) spectroscopy are widely integrated into pharmaceutical and chemical manufacturing to ensure compliance, consistency, and efficiency. Their non-destructive nature and speed make them particularly well-suited for real-time monitoring in high-throughput production environments.
Chromatography is the second-largest segment and is expected to maintain steady growth, supported by a CAGR of 10.3%. Techniques such as high-performance liquid chromatography (HPLC), gas chromatography (GC), and ion chromatography (IC) are vital for separating and analyzing complex mixtures in biotech and pharma applications. As production processes become more complex, demand for robust analytical methods continues to rise, particularly in biologics and specialty chemicals.
Product & Service Analysis
Within the product and service segmentation, analyzers lead the global market with a 32% revenue share in 2022 and are expected to remain the most commercially valuable segment through 2030. These devices are essential in providing accurate, real-time measurements of process parameters such as pH, temperature, and chemical composition. Widespread use in pharmaceutical, chemical, and petrochemical industries supports their continued relevance.
The sensors and probes segment is projected to expand at a CAGR of 11.3%, driven by increasing integration of IoT-based process monitoring systems. As manufacturers seek greater visibility across production lines, demand for compact, durable, and high-sensitivity probes is growing. This shift is reinforced by trends in automation and continuous manufacturing, which require seamless data capture and control.
Application Analysis
The large molecule segment remains the largest application area within the PAT market. Its growth reflects the increasing complexity of biologic drug manufacturing, where precision monitoring is essential to ensure product efficacy and batch-to-batch consistency. Large molecules, including monoclonal antibodies, peptides, and nucleic acids, require stringent control during fermentation, purification, and formulation processes.
As the global pipeline for biologics expands, manufacturers are investing in PAT systems to reduce variability, lower production costs, and comply with regulatory standards. These technologies help maintain critical quality attributes (CQAs) and enable real-time release testing (RTRT), significantly reducing time-to-market for complex therapies.
Measurement Analysis
In-line measurement systems account for the largest share, capturing 42.5% of market revenue. These systems are integrated directly into production equipment, enabling continuous monitoring and control of key parameters without interrupting operations. This real-time capability supports higher yield, reduced waste, and faster response times to deviations in process performance.
The on-line segment is also expanding, with a projected CAGR of 11.3%. While on-line systems operate slightly downstream from the core process, they still offer significant benefits in terms of timely data acquisition and process control. Both measurement types are increasingly favored in industries shifting from batch to continuous production, particularly in pharma and specialty chemicals.
End-Use Analysis
Pharmaceutical manufacturers lead PAT adoption, holding a 32.5% revenue share as of 2022. Driven by regulatory frameworks such as the FDA’s Process Analytical Technology initiative and the push for continuous manufacturing, pharma companies are integrating PAT to monitor production lines, enhance quality assurance, and reduce operational costs.
The biopharmaceutical sector is the fastest-growing end-use category, supported by the increasing demand for biologics and personalized medicines. PAT tools are essential for managing bioprocesses such as cell culture and protein purification. As the global biologics market grows, PAT systems are becoming integral to ensuring consistent production of high-value therapeutic products.
Regional Analysis
North America remains the largest market, contributing 33.8% of global revenue, underpinned by strong regulatory support, high R&D expenditure, and early adoption of advanced manufacturing technologies. The U.S. leads regional growth, with widespread integration of PAT in both large pharmaceutical firms and emerging biotech players.
Europe follows closely, with Germany, France, and the United Kingdom serving as key markets due to the presence of advanced pharmaceutical infrastructure and supportive regulatory bodies. Asia Pacific is the fastest-growing region, driven by expanding drug manufacturing capacity in China, India, and Japan. Governments in these countries are investing in pharma modernization and encouraging local production, positioning the region as a high-potential PAT market through 2030 and beyond.
By Technology (Spectroscopy (Molecular Spectroscopy, Atomic Spectroscopy), Mass Spectrometry, Chromatography (High-Performance Liquid Chromatography, Gas Chromatography, others), Particle Size Analysis, Others), By Product & Service (Analyzers, Sensors & Probes, Samplers, Software & Services), By Application (Small Molecules, Large Molecules, Manufacturing Applications, Other Applications), By Measurement (Off-line Measurement, In-line Measurement, At-line Measurement, On-line Measurement), By End User (Pharmaceutical Manufacturers, Biopharmaceutical Manufacturers, Contract Research and Manufacturing Organizations, Other End Users)
Research Methodology
Primary Research- 100 Interviews of Stakeholders
Secondary Research
Desk Research
Regional scope
North America (United States, Canada, Mexico)
Latin America (Brazil, Argentina, Columbia)
East Asia And Pacific (China, Japan, South Korea, Australia, Cambodia, Fiji, Indonesia)
Sea And South Asia (India, Singapore, Thailand, Taiwan, Malaysia)
Eastern Europe (Poland, Russia, Czech Republic, Romania)
Western Europe (Germany, U.K., France, Spain, Itlay)
Middle East & Africa (GCC Countries, Egypt, Nigeria, South Africa, Israel)
Competitive Landscape
Agilent Technologies Inc., Mettler-Toledo International Inc., Shimadzu Corporation, Emerson Electric Co., Sartorius AG, Bruker Corporation, Danaher Corporation, Hamilton Company, Repligen Corporation, ABB Ltd., PerkinElmer Inc., Carl Zeiss AG
Customization Scope
Customization for segments, region/country-level will be provided. Moreover, additional customization can be done based on the requirements.
Pricing and Purchase Options
Avail customized purchase options to meet your exact research needs. We have three licenses to opt for: Single User License, Multi-User License (Up to 5 Users), Corporate Use License (Unlimited User and Printable PDF).
TABLE OF CONTENTS
1. EXECUTIVE SUMMARY
1.1. MARKET SNAPSHOT
1.2. KEY FINDINGS & INSIGHTS
1.3. ANALYST RECOMMENDATIONS
1.4. FUTURE OUTLOOK
2. RESEARCH METHODOLOGY
2.1. MARKET DEFINITION & SCOPE
2.2. RESEARCH OBJECTIVES: PRIMARY & SECONDARY DATA SOURCES
2.3. DATA COLLECTION SOURCES
2.3.1. COVERAGE OF 100+ PRIMARY RESEARCH/CONSULTATION CALLS WITH INDUSTRY STAKEHOLDERS
FIGURE 17 NORTH AMERICA PROCESS ANALYTICAL TECHNOLOGY CURRENT AND FUTURE TYPE ANALYSIS, 2025–2034, (USD MILLION)
FIGURE 18 NORTH AMERICA PROCESS ANALYTICAL TECHNOLOGY CURRENT AND FUTURE END USER ANALYSIS, 2025–2034, (USD MILLION)
FIGURE 19 MARKET SHARE BY COUNTRY
FIGURE 20 LATIN AMERICA PROCESS ANALYTICAL TECHNOLOGY CURRENT AND FUTURE TYPE ANALYSIS, 2025–2034, (USD MILLION)
FIGURE 21 LATIN AMERICA PROCESS ANALYTICAL TECHNOLOGY CURRENT AND FUTURE END USER ANALYSIS, 2025–2034, (USD MILLION)
FIGURE 22 MARKET SHARE BY COUNTRY
FIGURE 23 EASTERN EUROPE PROCESS ANALYTICAL TECHNOLOGY CURRENT AND FUTURE TYPE ANALYSIS, 2025–2034, (USD MILLION)
FIGURE 24 EASTERN EUROPE PROCESS ANALYTICAL TECHNOLOGY CURRENT AND FUTURE END USER ANALYSIS, 2025–2034, (USD MILLION)
FIGURE 25 MARKET SHARE BY COUNTRY
FIGURE 26 WESTERN EUROPE PROCESS ANALYTICAL TECHNOLOGY CURRENT AND FUTURE TYPE ANALYSIS, 2025–2034, (USD MILLION)
FIGURE 27 WESTERN EUROPE PROCESS ANALYTICAL TECHNOLOGY CURRENT AND FUTURE END USER ANALYSIS, 2025–2034, (USD MILLION)
FIGURE 28 MARKET SHARE BY COUNTRY
FIGURE 29 EAST ASIA AND PACIFIC PROCESS ANALYTICAL TECHNOLOGY CURRENT AND FUTURE TYPE ANALYSIS, 2025–2034, (USD MILLION)
FIGURE 30 EAST ASIA AND PACIFIC PROCESS ANALYTICAL TECHNOLOGY CURRENT AND FUTURE END USER ANALYSIS, 2025–2034, (USD MILLION)
FIGURE 31 MARKET SHARE BY COUNTRY
FIGURE 32 SEA AND SOUTH ASIA PROCESS ANALYTICAL TECHNOLOGY CURRENT AND FUTURE TYPE ANALYSIS, 2025–2034, (USD MILLION)
FIGURE 33 SEA AND SOUTH ASIA PROCESS ANALYTICAL TECHNOLOGY CURRENT AND FUTURE END USER ANALYSIS, 2025–2034, (USD MILLION)
FIGURE 34 MARKET SHARE BY COUNTRY
FIGURE 35 MIDDLE EAST AND AFRICA PROCESS ANALYTICAL TECHNOLOGY CURRENT AND FUTURE TYPE ANALYSIS, 2025–2034, (USD MILLION)
FIGURE 36 MIDDLE EAST AND AFRICA PROCESS ANALYTICAL TECHNOLOGY CURRENT AND FUTURE END USER ANALYSIS, 2025–2034, (USD MILLION)
FIGURE 37 NORTH AMERICA PROCESS ANALYTICAL TECHNOLOGY CURRENT AND FUTURE MARKET VOLUME SHARE REGIONAL ANALYSIS, 2025–2034, (USD MILLION)
FIGURE 38 U.S. PROCESS ANALYTICAL TECHNOLOGY CURRENT AND FUTURE TYPE ANALYSIS, 2025–2034, (USD MILLION)
FIGURE 39 U.S. PROCESS ANALYTICAL TECHNOLOGY CURRENT AND FUTURE END USER ANALYSIS, 2025–2034, (USD MILLION)
FIGURE 40 CANADA PROCESS ANALYTICAL TECHNOLOGY CURRENT AND FUTURE TYPE ANALYSIS, 2025–2034, (USD MILLION)
FIGURE 41 CANADA PROCESS ANALYTICAL TECHNOLOGY CURRENT AND FUTURE END USER ANALYSIS, 2025–2034, (USD MILLION)
FIGURE 42 LATIN AMERICA PROCESS ANALYTICAL TECHNOLOGY CURRENT AND FUTURE MARKET VOLUME SHARE REGIONAL ANALYSIS, 2025–2034, (USD MILLION)
FIGURE 43 MEXICO PROCESS ANALYTICAL TECHNOLOGY CURRENT AND FUTURE TYPE ANALYSIS, 2025–2034, (USD MILLION)
FIGURE 44 MEXICO PROCESS ANALYTICAL TECHNOLOGY CURRENT AND FUTURE END USER ANALYSIS, 2025–2034, (USD MILLION)
FIGURE 45 BRAZIL PROCESS ANALYTICAL TECHNOLOGY CURRENT AND FUTURE TYPE ANALYSIS, 2025–2034, (USD MILLION)
FIGURE 46 BRAZIL PROCESS ANALYTICAL TECHNOLOGY CURRENT AND FUTURE END USER ANALYSIS, 2025–2034, (USD MILLION)
FIGURE 47 ARGENTINA PROCESS ANALYTICAL TECHNOLOGY CURRENT AND FUTURE TYPE ANALYSIS, 2025–2034, (USD MILLION)
FIGURE 48 ARGENTINA PROCESS ANALYTICAL TECHNOLOGY CURRENT AND FUTURE END USER ANALYSIS, 2025–2034, (USD MILLION)
FIGURE 49 COLUMBIA PROCESS ANALYTICAL TECHNOLOGY CURRENT AND FUTURE TYPE ANALYSIS, 2025–2034, (USD MILLION)
FIGURE 50 COLUMBIA PROCESS ANALYTICAL TECHNOLOGY CURRENT AND FUTURE END USER ANALYSIS, 2025–2034, (USD MILLION)
FIGURE 51 REST OF LATIN AMERICA PROCESS ANALYTICAL TECHNOLOGY CURRENT AND FUTURE TYPE ANALYSIS, 2025–2034, (USD MILLION)
FIGURE 52 REST OF LATIN AMERICA PROCESS ANALYTICAL TECHNOLOGY CURRENT AND FUTURE END USER ANALYSIS, 2025–2034, (USD MILLION)
FIGURE 53 EASTERN EUROPE PROCESS ANALYTICAL TECHNOLOGY CURRENT AND FUTURE MARKET VOLUME SHARE REGIONAL ANALYSIS, 2025–2034, (USD MILLION)
FIGURE 54 POLAND PROCESS ANALYTICAL TECHNOLOGY CURRENT AND FUTURE TYPE ANALYSIS, 2025–2034, (USD MILLION)
FIGURE 55 POLAND PROCESS ANALYTICAL TECHNOLOGY CURRENT AND FUTURE END USER ANALYSIS, 2025–2034, (USD MILLION)
FIGURE 56 RUSSIA PROCESS ANALYTICAL TECHNOLOGY CURRENT AND FUTURE TYPE ANALYSIS, 2025–2034, (USD MILLION)
FIGURE 57 RUSSIA PROCESS ANALYTICAL TECHNOLOGY CURRENT AND FUTURE END USER ANALYSIS, 2025–2034, (USD MILLION)
FIGURE 58 CZECH REPUBLIC PROCESS ANALYTICAL TECHNOLOGY CURRENT AND FUTURE TYPE ANALYSIS, 2025–2034, (USD MILLION)
FIGURE 59 CZECH REPUBLIC PROCESS ANALYTICAL TECHNOLOGY CURRENT AND FUTURE END USER ANALYSIS, 2025–2034, (USD MILLION)
FIGURE 60 ROMANIA PROCESS ANALYTICAL TECHNOLOGY CURRENT AND FUTURE TYPE ANALYSIS, 2025–2034, (USD MILLION)
FIGURE 61 ROMANIA PROCESS ANALYTICAL TECHNOLOGY CURRENT AND FUTURE END USER ANALYSIS, 2025–2034, (USD MILLION)
FIGURE 62 REST OF EASTERN EUROPE PROCESS ANALYTICAL TECHNOLOGY CURRENT AND FUTURE TYPE ANALYSIS, 2025–2034, (USD MILLION)
FIGURE 63 REST OF EASTERN EUROPE PROCESS ANALYTICAL TECHNOLOGY CURRENT AND FUTURE END USER ANALYSIS, 2025–2034, (USD MILLION)
FIGURE 64 WESTERN EUROPE PROCESS ANALYTICAL TECHNOLOGY CURRENT AND FUTURE MARKET VOLUME SHARE REGIONAL ANALYSIS, 2025–2034, (USD MILLION)
FIGURE 65 GERMANY PROCESS ANALYTICAL TECHNOLOGY CURRENT AND FUTURE TYPE ANALYSIS, 2025–2034, (USD MILLION)
FIGURE 66 GERMANY PROCESS ANALYTICAL TECHNOLOGY CURRENT AND FUTURE END USER ANALYSIS, 2025–2034, (USD MILLION)
FIGURE 67 FRANCE PROCESS ANALYTICAL TECHNOLOGY CURRENT AND FUTURE TYPE ANALYSIS, 2025–2034, (USD MILLION)
FIGURE 68 FRANCE PROCESS ANALYTICAL TECHNOLOGY CURRENT AND FUTURE END USER ANALYSIS, 2025–2034, (USD MILLION)
FIGURE 69 UK PROCESS ANALYTICAL TECHNOLOGY CURRENT AND FUTURE TYPE ANALYSIS, 2025–2034, (USD MILLION)
FIGURE 70 UK PROCESS ANALYTICAL TECHNOLOGY CURRENT AND FUTURE END USER ANALYSIS, 2025–2034, (USD MILLION)
FIGURE 71 SPAIN PROCESS ANALYTICAL TECHNOLOGY CURRENT AND FUTURE TYPE ANALYSIS, 2025–2034, (USD MILLION)
FIGURE 72 SPAIN PROCESS ANALYTICAL TECHNOLOGY CURRENT AND FUTURE END USER ANALYSIS, 2025–2034, (USD MILLION)
FIGURE 73 ITALY PROCESS ANALYTICAL TECHNOLOGY CURRENT AND FUTURE TYPE ANALYSIS, 2025–2034, (USD MILLION)
FIGURE 74 ITALY PROCESS ANALYTICAL TECHNOLOGY CURRENT AND FUTURE END USER ANALYSIS, 2025–2034, (USD MILLION)
FIGURE 75 REST OF WESTERN EUROPE PROCESS ANALYTICAL TECHNOLOGY CURRENT AND FUTURE TYPE ANALYSIS, 2025–2034, (USD MILLION)
FIGURE 76 REST OF WESTERN EUROPE PROCESS ANALYTICAL TECHNOLOGY CURRENT AND FUTURE END USER ANALYSIS, 2025–2034, (USD MILLION)
FIGURE 77 EAST ASIA AND PACIFIC PROCESS ANALYTICAL TECHNOLOGY CURRENT AND FUTURE MARKET VOLUME SHARE REGIONAL ANALYSIS, 2025–2034, (USD MILLION)
FIGURE 78 CHINA PROCESS ANALYTICAL TECHNOLOGY CURRENT AND FUTURE TYPE ANALYSIS, 2025–2034, (USD MILLION)
FIGURE 79 CHINA PROCESS ANALYTICAL TECHNOLOGY CURRENT AND FUTURE END USER ANALYSIS, 2025–2034, (USD MILLION)
FIGURE 80 JAPAN PROCESS ANALYTICAL TECHNOLOGY CURRENT AND FUTURE TYPE ANALYSIS, 2025–2034, (USD MILLION)
FIGURE 81 JAPAN PROCESS ANALYTICAL TECHNOLOGY CURRENT AND FUTURE END USER ANALYSIS, 2025–2034, (USD MILLION)
FIGURE 82 AUSTRALIA PROCESS ANALYTICAL TECHNOLOGY CURRENT AND FUTURE TYPE ANALYSIS, 2025–2034, (USD MILLION)
FIGURE 83 AUSTRALIA PROCESS ANALYTICAL TECHNOLOGY CURRENT AND FUTURE END USER ANALYSIS, 2025–2034, (USD MILLION)
FIGURE 84 CAMBODIA PROCESS ANALYTICAL TECHNOLOGY CURRENT AND FUTURE TYPE ANALYSIS, 2025–2034, (USD MILLION)
FIGURE 85 CAMBODIA PROCESS ANALYTICAL TECHNOLOGY CURRENT AND FUTURE END USER ANALYSIS, 2025–2034, (USD MILLION)
FIGURE 86 FIJI PROCESS ANALYTICAL TECHNOLOGY CURRENT AND FUTURE TYPE ANALYSIS, 2025–2034, (USD MILLION)
FIGURE 87 FIJI PROCESS ANALYTICAL TECHNOLOGY CURRENT AND FUTURE END USER ANALYSIS, 2025–2034, (USD MILLION)
FIGURE 88 INDONESIA PROCESS ANALYTICAL TECHNOLOGY CURRENT AND FUTURE TYPE ANALYSIS, 2025–2034, (USD MILLION)
FIGURE 89 INDONESIA PROCESS ANALYTICAL TECHNOLOGY CURRENT AND FUTURE END USER ANALYSIS, 2025–2034, (USD MILLION)
FIGURE 90 SOUTH KOREA PROCESS ANALYTICAL TECHNOLOGY CURRENT AND FUTURE TYPE ANALYSIS, 2025–2034, (USD MILLION)
FIGURE 91 SOUTH KOREA PROCESS ANALYTICAL TECHNOLOGY CURRENT AND FUTURE END USER ANALYSIS, 2025–2034, (USD MILLION)
FIGURE 92 REST OF EAST ASIA AND PACIFIC PROCESS ANALYTICAL TECHNOLOGY CURRENT AND FUTURE TYPE ANALYSIS, 2025–2034, (USD MILLION)
FIGURE 93 REST OF EAST ASIA AND PACIFIC PROCESS ANALYTICAL TECHNOLOGY CURRENT AND FUTURE END USER ANALYSIS, 2025–2034, (USD MILLION)
FIGURE 94 SEA AND SOUTH ASIA PROCESS ANALYTICAL TECHNOLOGY CURRENT AND FUTURE MARKET VOLUME SHARE REGIONAL ANALYSIS, 2025–2034, (USD MILLION)
FIGURE 95 BANGLADESH PROCESS ANALYTICAL TECHNOLOGY CURRENT AND FUTURE TYPE ANALYSIS, 2025–2034, (USD MILLION)
FIGURE 96 BANGLADESH PROCESS ANALYTICAL TECHNOLOGY CURRENT AND FUTURE END USER ANALYSIS, 2025–2034, (USD MILLION)
FIGURE 97 NEW ZEALAND PROCESS ANALYTICAL TECHNOLOGY CURRENT AND FUTURE TYPE ANALYSIS, 2025–2034, (USD MILLION)
FIGURE 98 NEW ZEALAND PROCESS ANALYTICAL TECHNOLOGY CURRENT AND FUTURE END USER ANALYSIS, 2025–2034, (USD MILLION)
FIGURE 99 INDIA PROCESS ANALYTICAL TECHNOLOGY CURRENT AND FUTURE TYPE ANALYSIS, 2025–2034, (USD MILLION)
FIGURE 100 INDIA PROCESS ANALYTICAL TECHNOLOGY CURRENT AND FUTURE END USER ANALYSIS, 2025–2034, (USD MILLION)
FIGURE 101 SINGAPORE PROCESS ANALYTICAL TECHNOLOGY CURRENT AND FUTURE TYPE ANALYSIS, 2025–2034, (USD MILLION)
FIGURE 102 SINGAPORE PROCESS ANALYTICAL TECHNOLOGY CURRENT AND FUTURE END USER ANALYSIS, 2025–2034, (USD MILLION)
FIGURE 103 THAILAND PROCESS ANALYTICAL TECHNOLOGY CURRENT AND FUTURE TYPE ANALYSIS, 2025–2034, (USD MILLION)
FIGURE 104 THAILAND PROCESS ANALYTICAL TECHNOLOGY CURRENT AND FUTURE END USER ANALYSIS, 2025–2034, (USD MILLION)
FIGURE 105 TAIWAN PROCESS ANALYTICAL TECHNOLOGY CURRENT AND FUTURE TYPE ANALYSIS, 2025–2034, (USD MILLION)
FIGURE 106 TAIWAN PROCESS ANALYTICAL TECHNOLOGY CURRENT AND FUTURE END USER ANALYSIS, 2025–2034, (USD MILLION)
FIGURE 107 MALAYSIA PROCESS ANALYTICAL TECHNOLOGY CURRENT AND FUTURE TYPE ANALYSIS, 2025–2034, (USD MILLION)
FIGURE 108 MALAYSIA PROCESS ANALYTICAL TECHNOLOGY CURRENT AND FUTURE END USER ANALYSIS, 2025–2034, (USD MILLION)
FIGURE 109 REST OF SEA AND SOUTH ASIA PROCESS ANALYTICAL TECHNOLOGY CURRENT AND FUTURE TYPE ANALYSIS, 2025–2034, (USD MILLION)
FIGURE 110 REST OF SEA AND SOUTH ASIA PROCESS ANALYTICAL TECHNOLOGY CURRENT AND FUTURE END USER ANALYSIS, 2025–2034, (USD MILLION)
FIGURE 111 MIDDLE EAST AND AFRICA PROCESS ANALYTICAL TECHNOLOGY CURRENT AND FUTURE MARKET VOLUME SHARE REGIONAL ANALYSIS, 2025–2034, (USD MILLION)
FIGURE 112 GCC COUNTRIES PROCESS ANALYTICAL TECHNOLOGY CURRENT AND FUTURE TYPE ANALYSIS, 2025–2034, (USD MILLION)
FIGURE 113 GCC COUNTRIES PROCESS ANALYTICAL TECHNOLOGY CURRENT AND FUTURE END USER ANALYSIS, 2025–2034, (USD MILLION)
FIGURE 114 SAUDI ARABIA PROCESS ANALYTICAL TECHNOLOGY CURRENT AND FUTURE TYPE ANALYSIS, 2025–2034, (USD MILLION)
FIGURE 115 SAUDI ARABIA PROCESS ANALYTICAL TECHNOLOGY CURRENT AND FUTURE END USER ANALYSIS, 2025–2034, (USD MILLION)
FIGURE 116 UAE PROCESS ANALYTICAL TECHNOLOGY CURRENT AND FUTURE TYPE ANALYSIS, 2025–2034, (USD MILLION)
FIGURE 117 UAE PROCESS ANALYTICAL TECHNOLOGY CURRENT AND FUTURE END USER ANALYSIS, 2025–2034, (USD MILLION)
FIGURE 118 BAHRAIN PROCESS ANALYTICAL TECHNOLOGY CURRENT AND FUTURE TYPE ANALYSIS, 2025–2034, (USD MILLION)
FIGURE 119 BAHRAIN PROCESS ANALYTICAL TECHNOLOGY CURRENT AND FUTURE END USER ANALYSIS, 2025–2034, (USD MILLION)
FIGURE 120 KUWAIT PROCESS ANALYTICAL TECHNOLOGY CURRENT AND FUTURE TYPE ANALYSIS, 2025–2034, (USD MILLION)
FIGURE 121 KUWAIT PROCESS ANALYTICAL TECHNOLOGY CURRENT AND FUTURE END USER ANALYSIS, 2025–2034, (USD MILLION)
FIGURE 122 OMAN PROCESS ANALYTICAL TECHNOLOGY CURRENT AND FUTURE TYPE ANALYSIS, 2025–2034, (USD MILLION)
FIGURE 123 OMAN PROCESS ANALYTICAL TECHNOLOGY CURRENT AND FUTURE END USER ANALYSIS, 2025–2034, (USD MILLION)
FIGURE 124 QATAR PROCESS ANALYTICAL TECHNOLOGY CURRENT AND FUTURE TYPE ANALYSIS, 2025–2034, (USD MILLION)
FIGURE 125 QATAR PROCESS ANALYTICAL TECHNOLOGY CURRENT AND FUTURE END USER ANALYSIS, 2025–2034, (USD MILLION)
FIGURE 126 EGYPT PROCESS ANALYTICAL TECHNOLOGY CURRENT AND FUTURE TYPE ANALYSIS, 2025–2034, (USD MILLION)
FIGURE 127 EGYPT PROCESS ANALYTICAL TECHNOLOGY CURRENT AND FUTURE END USER ANALYSIS, 2025–2034, (USD MILLION)
FIGURE 128 NIGERIA PROCESS ANALYTICAL TECHNOLOGY CURRENT AND FUTURE TYPE ANALYSIS, 2025–2034, (USD MILLION)
FIGURE 129 NIGERIA PROCESS ANALYTICAL TECHNOLOGY CURRENT AND FUTURE END USER ANALYSIS, 2025–2034, (USD MILLION)
FIGURE 130 SOUTH AFRICA PROCESS ANALYTICAL TECHNOLOGY CURRENT AND FUTURE TYPE ANALYSIS, 2025–2034, (USD MILLION)
FIGURE 131 SOUTH AFRICA PROCESS ANALYTICAL TECHNOLOGY CURRENT AND FUTURE END USER ANALYSIS, 2025–2034, (USD MILLION)
FIGURE 132 ISRAEL PROCESS ANALYTICAL TECHNOLOGY CURRENT AND FUTURE TYPE ANALYSIS, 2025–2034, (USD MILLION)
FIGURE 133 ISRAEL PROCESS ANALYTICAL TECHNOLOGY CURRENT AND FUTURE END USER ANALYSIS, 2025–2034, (USD MILLION)
FIGURE 134 REST OF MEA PROCESS ANALYTICAL TECHNOLOGY CURRENT AND FUTURE TYPE ANALYSIS, 2025–2034, (USD MILLION)
FIGURE 135 REST OF MEA PROCESS ANALYTICAL TECHNOLOGY CURRENT AND FUTURE END USER ANALYSIS, 2025–2034, (USD MILLION)
FIGURE 136 U. S. MARKET SHARE ANALYSIS BY TYPE (2024)
FIGURE 137 U. S. MARKET SHARE ANALYSIS BY END USER (2024)
FIGURE 138 CANADA MARKET SHARE ANALYSIS BY TYPE (2024)
FIGURE 139 CANADA MARKET SHARE ANALYSIS BY END USER (2024)
FIGURE 140 MEXICO MARKET SHARE ANALYSIS BY TYPE (2024)
FIGURE 141 MEXICO MARKET SHARE ANALYSIS BY END USER (2024)
FIGURE 142 CHINA MARKET SHARE ANALYSIS BY TYPE (2024)
FIGURE 143 CHINA MARKET SHARE ANALYSIS BY END USER (2024)
FIGURE 144 JAPAN MARKET SHARE ANALYSIS BY TYPE (2024)
FIGURE 145 JAPAN MARKET SHARE ANALYSIS BY END USER (2024)
FIGURE 146 INDIA MARKET SHARE ANALYSIS BY TYPE (2024)
FIGURE 147 INDIA MARKET SHARE ANALYSIS BY END USER (2024)
FIGURE 148 SOUTH KOREA MARKET SHARE ANALYSIS BY TYPE (2024)
FIGURE 149 SOUTH KOREA MARKET SHARE ANALYSIS BY END USER (2024)
FIGURE 150 SAUDI ARABIA MARKET SHARE ANALYSIS BY TYPE (2024)
FIGURE 151 SAUDI ARABIA MARKET SHARE ANALYSIS BY END USER (2024)
FIGURE 152 UAE MARKET SHARE ANALYSIS BY TYPE (2024)
FIGURE 153 UAE MARKET SHARE ANALYSIS BY END USER (2024)
FIGURE 154 EGYPT MARKET SHARE ANALYSIS BY TYPE (2024)
FIGURE 155 EGYPT MARKET SHARE ANALYSIS BY END USER (2024)
FIGURE 156 NIGERIA MARKET SHARE ANALYSIS BY TYPE (2024)
FIGURE 157 NIGERIA MARKET SHARE ANALYSIS BY END USER (2024)
FIGURE 158 SOUTH AFRICA MARKET SHARE ANALYSIS BY TYPE (2024)
FIGURE 159 SOUTH AFRICA MARKET SHARE ANALYSIS BY END USER (2024)
FIGURE 160 GERMANY MARKET SHARE ANALYSIS BY TYPE (2024)
FIGURE 161 GERMANY MARKET SHARE ANALYSIS BY END USER (2024)
FIGURE 162 FRANCE MARKET SHARE ANALYSIS BY TYPE (2024)
FIGURE 163 FRANCE MARKET SHARE ANALYSIS BY END USER (2024)
FIGURE 164 UK MARKET SHARE ANALYSIS BY TYPE (2024)
FIGURE 165 UK MARKET SHARE ANALYSIS BY END USER (2024)
FIGURE 166 SPAIN MARKET SHARE ANALYSIS BY TYPE (2024)
FIGURE 167 SPAIN MARKET SHARE ANALYSIS BY END USER (2024)
FIGURE 168 ITALY MARKET SHARE ANALYSIS BY TYPE (2024)
FIGURE 169 ITALY MARKET SHARE ANALYSIS BY END USER (2024)
FIGURE 170 BRAZIL MARKET SHARE ANALYSIS BY TYPE (2024)
FIGURE 171 BRAZIL MARKET SHARE ANALYSIS BY END USER (2024)
FIGURE 172 ARGENTINA MARKET SHARE ANALYSIS BY TYPE (2024)
FIGURE 173 ARGENTINA MARKET SHARE ANALYSIS BY END USER (2024)
FIGURE 174 COLUMBIA MARKET SHARE ANALYSIS BY TYPE (2024)
FIGURE 175 COLUMBIA MARKET SHARE ANALYSIS BY END USER (2024)
FIGURE 176 GLOBAL PROCESS ANALYTICAL TECHNOLOGY CURRENT AND FUTURE MARKET KEY COUNTRY LEVEL ANALYSIS, 2024–2034, (USD MILLION)
FIGURE 177 FINANCIAL OVERVIEW:
Key Player Analysis
PerkinElmer Inc.: PerkinElmer holds a strong position as amarket leader in the global Process Analytical Technology (PAT) market, particularly in the pharmaceutical and life sciences sectors. The company’s product suite includes advanced molecular spectroscopy tools, chromatography systems, and software platforms for real-time analytics. In 2025, PerkinElmer continues to expand its presence through targeted acquisitions in diagnostics and lab automation, enhancing its process monitoring capabilities. The company has integrated AI-powered predictive tools into its PAT systems, allowing users to streamline batch processes and reduce variability in biologic manufacturing. Its established customer base across North America and Europe and a focused expansion into Asia-Pacific markets provide geographic resilience. PerkinElmer’s strong investment in R&D—accounting for nearly 7% of its annual revenue—reinforces its ability to develop application-specific PAT tools that align with evolving regulatory and process demands.
Shimadzu Corporation: Shimadzu is positioned as a technology innovator in the PAT market, with a core strength in analytical instrumentation, particularly gas and liquid chromatography and mass spectrometry systems. The company’s PAT-related solutions are widely adopted in pharmaceutical manufacturing for process validation and quality control. In 2025, Shimadzu is accelerating its strategy by embedding smart sensors and cloud connectivity into its instruments to support remote monitoring and AI-based process optimization. It has formed regional partnerships in India and Southeast Asia to build localized production and distribution networks, targeting mid-sized manufacturers adopting continuous manufacturing models. Shimadzu’s competitive advantage lies in its precision engineering, pricing flexibility, and growing digital analytics ecosystem, which helps manufacturers reduce downtime and improve compliance.
Carl Zeiss AG: Carl Zeiss AG operates as a niche player in the PAT market, with a specialized focus on optical systems and high-precision imaging technologies. The company’s microscopy and spectroscopy solutions are increasingly used for at-line and in-line analysis, particularly in biopharma and advanced material applications. In 2025, Zeiss is leveraging its expertise in photonics and imaging to support PAT implementations in cleanroom environments, where particle monitoring and structural analysis are critical. While its market share remains moderate, Zeiss’s strength lies in high-resolution instruments tailored for complex quality assurance tasks. Strategic investments in nanotechnology and advanced metrology give it a differentiated edge in specific high-specification manufacturing environments.
Mettler-Toledo International Inc.: Mettler-Toledo is a recognized challenger in the global PAT space, supported by its extensive portfolio of sensors, probes, and analytical instruments. The company serves key industries such as pharmaceuticals, food processing, and chemicals, offering robust in-line measurement tools for pH, conductivity, turbidity, and chemical concentration. In 2025, Mettler-Toledo is investing in AI-driven calibration models and predictive maintenance features to enhance process reliability and uptime. Its focus on modular, scalable systems appeals to both large-scale manufacturers and SMEs seeking flexible deployment. With more than 40% of its sales coming from Europe and growing traction in the Asia-Pacific region, the company is expanding its global footprint through distributor partnerships and service-led growth strategies.
Market Key Players
Agilent Technologies Inc.
Mettler-Toledo International Inc.
Shimadzu Corporation
Emerson Electric Co.
Sartorius AG
Bruker Corporation
Danaher Corporation
Hamilton Company
Repligen Corporation
ABB Ltd.
PerkinElmer Inc.
Carl Zeiss AG
Driver
PAT Adoption Accelerates as Real-Time Monitoring Becomes Essential
By 2025, real-time process monitoring has become a key focus for manufacturers aiming for better product consistency, reliability, and cost reduction. Process Analytical Technology (PAT) is vital because it allows continuous tracking of important process parameters and provides tighter control in production. Industries like pharmaceuticals, specialty chemicals, and food production are quickly adopting PAT systems as part of their overall digitalization efforts. By combining PAT with industrial automation and MES/SCADA platforms, companies can cut material waste, use energy more efficiently, and greatly boost batch yields, which leads to clear improvements in operational performance.
Regulatory Support & Rising Pharma R&D Spend Fuel PAT Expansion
The regulatory landscape also supports the adoption of PAT. Agencies like the U.S. FDA, EMA, and PMDA actively promote PAT within Quality-by-Design (QbD) frameworks to improve transparency, traceability, and product safety. As global pharmaceutical R&D spending exceeds USD 250 billion, the need for timely analytical insights becomes more important. Manufacturers are increasingly using PAT technologies to meet higher quality demands, speed up process validation, and ensure compliance in various tightly regulated markets. These influences are making PAT a key factor in the manufacturing of the future.
Restraint
High Costs & Skill Gaps Slow PAT Deployment in Cost-Sensitive Sectors
Even with its obvious advantages, PAT adoption faces challenges due to high initial costs for analytical hardware, calibration tools, software licenses, and automation connections. Smaller manufacturers often struggle to justify these expenses, especially when there is a lack of specialized skills in data analytics, process design, and regulatory compliance. The steep learning curve related to deploying PAT also limits its use, as many companies do not have the qualified staff necessary for training, analysis, and ongoing system improvement.
Integration Challenges & Data Integrity Concerns Limit Scalability
Integration complexity is another issue, particularly for manufacturers with older or partly digital production lines. Legacy systems often need significant customization to connect with PAT tools, which can extend project timelines and increase technical risks. In sectors dealing with sensitive intellectual property, like biopharmaceuticals, worries about data integrity, cybersecurity, and audit readiness can slow down decision-making. Ensuring consistent and validated data flows that comply with global standards is still challenging for companies that lack strong digital governance.
Opportunity
Continuous Manufacturing & Global Expansion Unlock Major Growth Potential
The growing shift from batch to continuous manufacturing, especially in pharmaceuticals, offers significant opportunities for PAT vendors. Continuous processes need real-time monitoring to maintain quality, making PAT essential for modern production lines. Moreover, manufacturing growth in emerging economies across Asia-Pacific, Latin America, and the Middle East is driving demand for PAT solutions as facilities upgrade to meet international regulatory and quality requirements. These regions are ideal for vendors with modular, easy-to-integrate tools.
Affordable Sensors & Cloud-Based PAT Platforms Broaden Market Access
Lower hardware prices and the rise of portable, user-friendly analyzers are making it easier for small and mid-sized companies to adopt PAT. Cloud-based PAT platforms offer centralized analytics, remote access, and simplified workflows, allowing advanced analytics without needing significant infrastructure investments. With the PAT market expected to grow at over 13% CAGR through 2032, vendors that provide scalable, subscription-based, or hybrid deployment options will have a competitive advantage. The combination of affordability and accessibility is quickly expanding the global PAT adoption.
Trend
AI-Driven PAT Systems Transform Process Optimization & Quality Control
Artificial intelligence is changing the capability of PAT systems across various sectors. By using machine learning models, companies can identify issues early, perform predictive maintenance, and adjust process parameters automatically to ensure high product quality. This is especially important in biopharmaceutical manufacturing, where complex processes require high accuracy and quick decisions. AI-enabled PAT tools help remove manual bottlenecks and offer insights that support continuous improvement.
Portable Devices & Cloud Analytics Accelerate Adoption Across Industries
By 2025, portable PAT systems like handheld spectrometers and mobile chromatographic devices are becoming popular for testing in the field and decentralized quality monitoring. Cloud-based analytics platforms are also boosting market growth by enabling real-time data sharing, centralized control, and remote teamwork. As businesses focus on sustainability, energy efficiency, and operational flexibility, these next-generation PAT solutions are key to modernizing manufacturing systems and are essential to Industry 4.0 strategies.
Recent Developments
Dec 2024 – Thermo Fisher Scientific: Thermo Fisher announced the launch of its real-time PAT platform, SpectraSure AI, integrating near-infrared spectroscopy with machine learning for in-line pharmaceutical quality monitoring. The platform is expected to reduce process deviations by up to 40% in continuous manufacturing environments. This move strengthens Thermo Fisher’s position in AI-integrated PAT solutions targeting pharma and biotech clients.
Feb 2025 – Agilent Technologies: Agilent completed the acquisition of a UK-based PAT software company, InProcess Analytics Ltd., in a deal valued at approximately USD 145 million. The acquisition brings advanced multivariate data analysis and cloud-based PAT integration into Agilent’s portfolio. This expands Agilent’s digital analytics offering and enhances its competitiveness in real-time pharma manufacturing.
Apr 2025 – Mettler-Toledo International Inc.: Mettler-Toledo opened a new PAT R&D and training center in Singapore to serve Asia-Pacific clients, targeting regional pharma and specialty chemical manufacturers. The facility is expected to support 20% growth in the company’s APAC PAT revenue over the next two years. This expansion improves Mettler-Toledo’s local support infrastructure and strengthens its regional presence.
Jul 2025 – Sartorius AG: Sartorius entered a strategic partnership with a leading CDMO (Contract Development and Manufacturing Organization) in Germany to deploy its real-time PAT systems across biologics production lines. The rollout will initially cover four production sites, with expansion planned in 2026. The partnership boosts Sartorius’ visibility in biopharma PAT applications and supports broader industry adoption.
Sep 2025 – Shimadzu Corporation: Shimadzu launched a compact, portable gas chromatography system tailored for real-time PAT in chemical and food manufacturing environments. Early pilot testing in Japan showed a 30% reduction in sampling time compared to conventional lab-based systems. The launch diversifies Shimadzu’s product base and targets mid-sized manufacturers focused on efficiency and compliance.