Progressive Web Apps Market Growth & Digital Trends| 32.2% CAGR
Global Progressive Web Apps Market Size, Share & Analysis By Component (Platform, Services), By Enterprise Size (Large Enterprises, SMEs), By Application (Social Media, E-commerce and Retail, Media and Entertainment, Travel and Tourism, BFSI, Healthcare, Education, Others), By Deployment, Industry Outlook, Performance Optimization Trends & Forecast 2025–2034
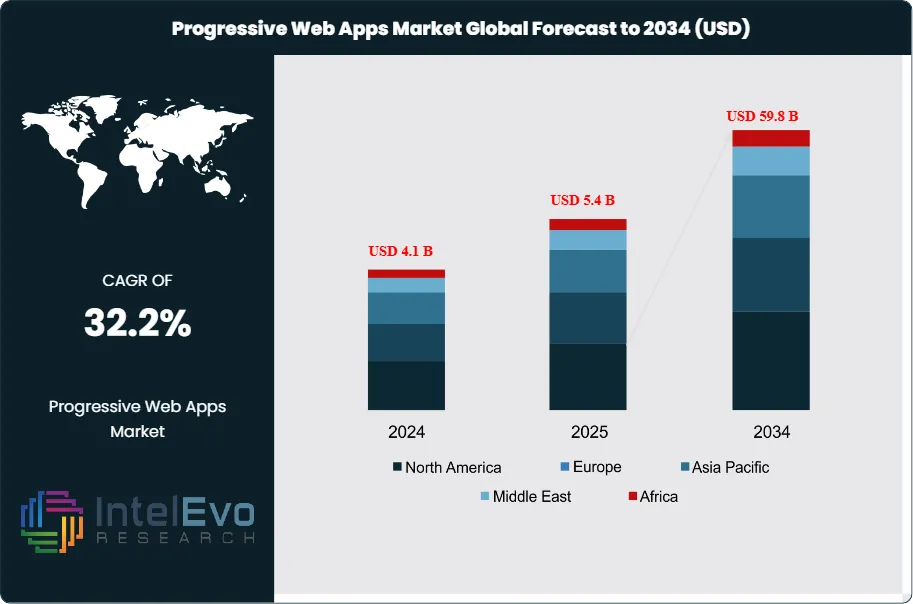
The Progressive Web Apps (PWA) market is valued at USD 4.1 billion in 2024 and is projected to reach approximately USD 59.8 billion by 2034, reflecting a powerful CAGR of about 32.2% during 2025–2034. Growth is accelerating as businesses prioritize low-latency, app-like web experiences without the cost of native app development. PWAs enable faster load times, offline functionality, and seamless cross-device performance—making them a preferred choice for e-commerce, BFSI, media, and enterprise platforms. As mobile-first interaction becomes the global norm, PWAs are reshaping digital transformation strategies and emerging as a dominant force in next-generation web development.
PWAs represent a structural shift in how digital platforms are built and delivered. They combine the accessibility of web pages with the functionality of mobile applications, offering offline access, push notifications, and seamless updates without requiring app store downloads. As smartphone penetration surpasses 50% of the global population and mobile web traffic dominates user behavior, PWAs have become a preferred channel for businesses seeking fast, reliable, and responsive user experiences.
Adoption is accelerating in sectors such as e-commerce, finance, and digital media, where performance and conversion metrics are closely tied to mobile experience. Companies deploying PWAs report a 36% improvement in conversion rates and a 180% increase in user engagement compared to traditional apps. User behavior supports this shift, with 70% of consumers favoring PWAs for their ease of access and 80% choosing to pin them to their home screens. Cost efficiency is another driver.
PWAs reduce development overhead by enabling a single application to run across platforms, removing the need for separate iOS and Android builds. Browser technologies such as service workers and Web App Manifests have made this possible, but inconsistent support across browsers still presents a limitation, particularly for feature-rich applications. While native apps remain the benchmark for high-performance mobile tasks, PWAs are gaining ground in markets where connectivity is unstable or user acquisition budgets are constrained.
Regional growth is strongest in Asia Pacific and Latin America, where mobile-first internet use is widespread and the appetite for lightweight, high-functionality platforms is high. The market remains largely underpenetrated, with only 54,000 active websites globally using PWA frameworks. As browser compatibility improves and enterprise adoption rises, the gap between PWAs and native apps will narrow further. Security is another differentiator. PWAs report 60% fewer vulnerabilities than native alternatives, a factor increasingly prioritized in compliance-focused sectors. As businesses seek scalable, secure, and performance-oriented digital solutions, PWA adoption is expected to expand significantly through 2034.
Key Takeaways
Market Growth: The global Progressive Web Apps (PWA) market is projected to reach USD 59.8 billion by 2034, up from USD 4.1 billion in 2024, registering a CAGR of 32.2% from 2025 to 2034. Growth is driven by rising smartphone penetration, demand for faster mobile experiences, and cost advantages over native app development.
Platform: The Platform segment led the market in 2023 with over 57% share, supported by widespread use of frameworks like Angular, React, and Vue.js that simplify cross-platform development for web and mobile.
Enterprise Size: Large enterprises accounted for more than 54% of global PWA adoption in 2023. Their focus on customer retention, performance optimization, and cost-efficiency made PWAs a strategic choice for digital transformation across retail, banking, and services.
Application: 11applications captured 18.5% of the market in 2023. PWAs in this segment improve load speeds, reduce data usage, and increase user engagement in bandwidth-constrained environments.
Driver: PWA performance advantages are driving adoption. Companies report up to 36% higher conversion rates and a 180% boost in user engagement, supported by features like offline access, push notifications, and faster load times.
Restraint: Limited browser compatibility remains a barrier. Inconsistent support for PWA features across Safari, older Android browsers, and legacy enterprise environments restricts functionality and user experience.
Opportunity: Emerging markets in Asia Pacific and Latin America offer strong potential due to mobile-first internet behavior and lower access to high-end devices. PWAs meet the need for fast, lightweight, and install-free applications in these regions.
Trend: Security is becoming a key differentiator. PWAs show 60% fewer vulnerabilities than native apps, increasing their appeal in regulated sectors such as finance, healthcare, and public services.
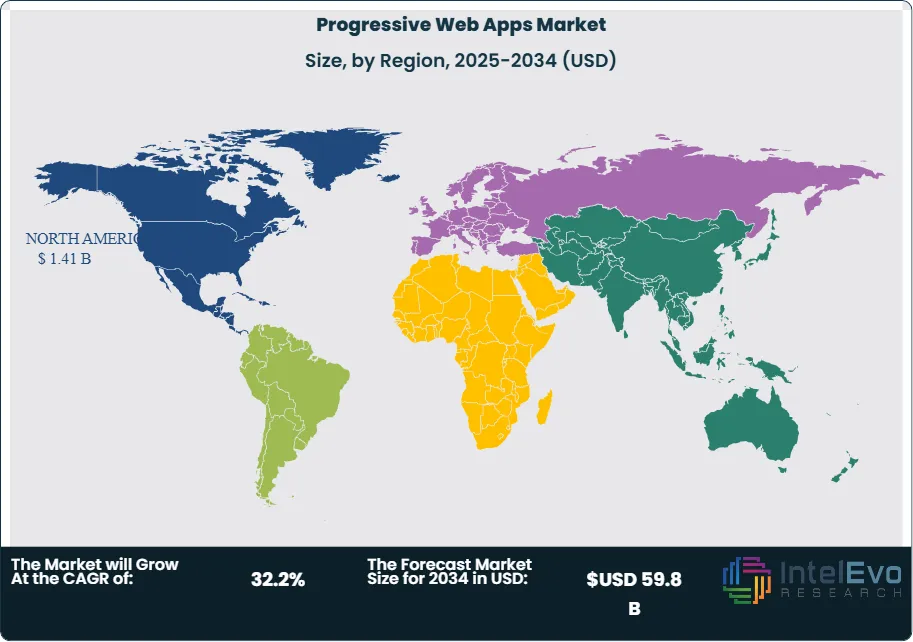
Regional Analysis: North America led the global market in 2023 with over 34.5% share, driven by high digital adoption and enterprise investment in PWA frameworks. Asia Pacific is gaining momentum, supported by mobile-first ecosystems and increasing deployment across e-commerce and service industries.
Component Analysis
As of 2025, platforms remain the dominant force in the global Progressive Web Apps (PWA) market, holding over 57% of the total market share. This is largely due to the demand for development environments that support fast, responsive applications across devices and operating systems. Businesses increasingly rely on platform-based tools to deploy PWAs that deliver consistent performance with offline functionality, push notifications, and quick load times. Open-source tools such as Google Lighthouse and Microsoft’s PWA Builder continue to lower barriers to entry, supporting widespread adoption across development teams.
The shift to cloud infrastructure has further reinforced platform dominance. Cloud-based platforms support continuous integration and delivery, enable faster updates, and reduce operational complexity. For enterprises aiming to accelerate time-to-market while managing digital experiences at scale, platforms offer a flexible and cost-efficient solution. Their modular architecture also allows companies to iterate quickly and align app performance with evolving user expectations.
Enterprise Size Analysis
Large enterprises accounted for more than 54% of global PWA deployment in 2025. Their preference stems from the need to deliver scalable, secure, and high-performing digital solutions across geographies and user segments. With greater financial resources and digital infrastructure, large companies can fully integrate PWA capabilities—offline access, background sync, and push notifications—into complex customer-facing applications. These capabilities are especially valuable in sectors such as banking, retail, and media, where user engagement drives revenue.
PWA adoption among large enterprises also reflects a strategic focus on reducing long-term development and maintenance costs. Unlike native apps, PWAs allow companies to manage a single codebase across platforms, simplifying updates and minimizing user friction. Analytics and real-time performance monitoring are additional advantages, enabling organizations to fine-tune user experiences and gain insights into digital behavior. These factors position PWAs as a core component of enterprise digital transformation initiatives.
Application Analysis
The social media segment led PWA application adoption in 2025, contributing over 18.5% of the market. User experience is central to this sector, and PWAs support faster load times, real-time updates, and offline access—all essential for maintaining engagement in high-traffic environments. As mobile devices remain the primary access point for social platforms, companies are investing in PWAs to reduce latency, increase session times, and support broader geographic reach, including regions with inconsistent internet access.
Beyond social media, sectors such as e-commerce and streaming are also scaling PWA adoption. For example, JD.ID in Indonesia recorded a 53% increase in mobile conversion rates and a 200% rise in installations after switching to a PWA format. Media platforms like Hulu experienced a 27% lift in return visits within months of their transition. These outcomes underscore the technology’s value in improving performance metrics that directly impact revenue, especially in markets with mobile-first audiences.
Regional Analysis
North America held the largest share of the global PWA market in 2025, accounting for over 34.5% of revenue, driven by established digital infrastructure and strong enterprise adoption. Major U.S. tech companies—including Google, Microsoft, and Meta—have embedded PWA support into their platforms, accelerating both developer interest and end-user acceptance. High smartphone penetration and advanced cloud infrastructure further support the region’s lead in PWA deployment.
Asia Pacific, however, presents the most significant growth potential. With rising mobile internet use and expanding e-commerce ecosystems, countries like India, Indonesia, and Vietnam are adopting PWAs as cost-effective alternatives to native apps. Latin America is also emerging as a key region, where local startups and service providers turn to PWAs to improve reach without heavy investment. As browser compatibility continues to improve, adoption will likely spread deeper into healthcare, education, and public sector services across emerging markets.
By Component (Platform, Services), By Enterprise Size (Large Enterprises, SMEs), By Application (Social Media, E-commerce and Retail, Media and Entertainment, Travel and Tourism, BFSI, Healthcare, Education, Others)
Research Methodology
Primary Research- 100 Interviews of Stakeholders
Secondary Research
Desk Research
Regional scope
North America (United States, Canada, Mexico)
Latin America (Brazil, Argentina, Columbia)
East Asia And Pacific (China, Japan, South Korea, Australia, Cambodia, Fiji, Indonesia)
Sea And South Asia (India, Singapore, Thailand, Taiwan, Malaysia)
Eastern Europe (Poland, Russia, Czech Republic, Romania)
Western Europe (Germany, U.K., France, Spain, Itlay)
Middle East & Africa (GCC Countries, Egypt, Nigeria, South Africa, Israel)
Customization for segments, region/country-level will be provided. Moreover, additional customization can be done based on the requirements.
Pricing and Purchase Options
Avail customized purchase options to meet your exact research needs. We have three licenses to opt for: Single User License, Multi-User License (Up to 5 Users), Corporate Use License (Unlimited User and Printable PDF).
TABLE OF CONTENTS
1. EXECUTIVE SUMMARY
1.1. MARKET SNAPSHOT
1.2. KEY FINDINGS & INSIGHTS
1.3. ANALYST RECOMMENDATIONS
1.4. FUTURE OUTLOOK
2. RESEARCH METHODOLOGY
2.1. MARKET DEFINITION & SCOPE
2.2. RESEARCH OBJECTIVES: PRIMARY & SECONDARY DATA SOURCES
2.3. DATA COLLECTION SOURCES
2.3.1. COVERAGE OF 100+ PRIMARY RESEARCH/CONSULTATION CALLS WITH INDUSTRY STAKEHOLDERS
FIGURE 17 NORTH AMERICA PROGRESSIVE WEB APPS CURRENT AND FUTURE TYPE ANALYSIS, 2025–2034, (USD MILLION)
FIGURE 18 NORTH AMERICA PROGRESSIVE WEB APPS CURRENT AND FUTURE END USER ANALYSIS, 2025–2034, (USD MILLION)
FIGURE 19 MARKET SHARE BY COUNTRY
FIGURE 20 LATIN AMERICA PROGRESSIVE WEB APPS CURRENT AND FUTURE TYPE ANALYSIS, 2025–2034, (USD MILLION)
FIGURE 21 LATIN AMERICA PROGRESSIVE WEB APPS CURRENT AND FUTURE END USER ANALYSIS, 2025–2034, (USD MILLION)
FIGURE 22 MARKET SHARE BY COUNTRY
FIGURE 23 EASTERN EUROPE PROGRESSIVE WEB APPS CURRENT AND FUTURE TYPE ANALYSIS, 2025–2034, (USD MILLION)
FIGURE 24 EASTERN EUROPE PROGRESSIVE WEB APPS CURRENT AND FUTURE END USER ANALYSIS, 2025–2034, (USD MILLION)
FIGURE 25 MARKET SHARE BY COUNTRY
FIGURE 26 WESTERN EUROPE PROGRESSIVE WEB APPS CURRENT AND FUTURE TYPE ANALYSIS, 2025–2034, (USD MILLION)
FIGURE 27 WESTERN EUROPE PROGRESSIVE WEB APPS CURRENT AND FUTURE END USER ANALYSIS, 2025–2034, (USD MILLION)
FIGURE 28 MARKET SHARE BY COUNTRY
FIGURE 29 EAST ASIA AND PACIFIC PROGRESSIVE WEB APPS CURRENT AND FUTURE TYPE ANALYSIS, 2025–2034, (USD MILLION)
FIGURE 30 EAST ASIA AND PACIFIC PROGRESSIVE WEB APPS CURRENT AND FUTURE END USER ANALYSIS, 2025–2034, (USD MILLION)
FIGURE 31 MARKET SHARE BY COUNTRY
FIGURE 32 SEA AND SOUTH ASIA PROGRESSIVE WEB APPS CURRENT AND FUTURE TYPE ANALYSIS, 2025–2034, (USD MILLION)
FIGURE 33 SEA AND SOUTH ASIA PROGRESSIVE WEB APPS CURRENT AND FUTURE END USER ANALYSIS, 2025–2034, (USD MILLION)
FIGURE 34 MARKET SHARE BY COUNTRY
FIGURE 35 MIDDLE EAST AND AFRICA PROGRESSIVE WEB APPS CURRENT AND FUTURE TYPE ANALYSIS, 2025–2034, (USD MILLION)
FIGURE 36 MIDDLE EAST AND AFRICA PROGRESSIVE WEB APPS CURRENT AND FUTURE END USER ANALYSIS, 2025–2034, (USD MILLION)
FIGURE 37 NORTH AMERICA PROGRESSIVE WEB APPS CURRENT AND FUTURE MARKET VOLUME SHARE REGIONAL ANALYSIS, 2025–2034, (USD MILLION)
FIGURE 38 U.S. PROGRESSIVE WEB APPS CURRENT AND FUTURE TYPE ANALYSIS, 2025–2034, (USD MILLION)
FIGURE 39 U.S. PROGRESSIVE WEB APPS CURRENT AND FUTURE END USER ANALYSIS, 2025–2034, (USD MILLION)
FIGURE 40 CANADA PROGRESSIVE WEB APPS CURRENT AND FUTURE TYPE ANALYSIS, 2025–2034, (USD MILLION)
FIGURE 41 CANADA PROGRESSIVE WEB APPS CURRENT AND FUTURE END USER ANALYSIS, 2025–2034, (USD MILLION)
FIGURE 42 LATIN AMERICA PROGRESSIVE WEB APPS CURRENT AND FUTURE MARKET VOLUME SHARE REGIONAL ANALYSIS, 2025–2034, (USD MILLION)
FIGURE 43 MEXICO PROGRESSIVE WEB APPS CURRENT AND FUTURE TYPE ANALYSIS, 2025–2034, (USD MILLION)
FIGURE 44 MEXICO PROGRESSIVE WEB APPS CURRENT AND FUTURE END USER ANALYSIS, 2025–2034, (USD MILLION)
FIGURE 45 BRAZIL PROGRESSIVE WEB APPS CURRENT AND FUTURE TYPE ANALYSIS, 2025–2034, (USD MILLION)
FIGURE 46 BRAZIL PROGRESSIVE WEB APPS CURRENT AND FUTURE END USER ANALYSIS, 2025–2034, (USD MILLION)
FIGURE 47 ARGENTINA PROGRESSIVE WEB APPS CURRENT AND FUTURE TYPE ANALYSIS, 2025–2034, (USD MILLION)
FIGURE 48 ARGENTINA PROGRESSIVE WEB APPS CURRENT AND FUTURE END USER ANALYSIS, 2025–2034, (USD MILLION)
FIGURE 49 COLUMBIA PROGRESSIVE WEB APPS CURRENT AND FUTURE TYPE ANALYSIS, 2025–2034, (USD MILLION)
FIGURE 50 COLUMBIA PROGRESSIVE WEB APPS CURRENT AND FUTURE END USER ANALYSIS, 2025–2034, (USD MILLION)
FIGURE 51 REST OF LATIN AMERICA PROGRESSIVE WEB APPS CURRENT AND FUTURE TYPE ANALYSIS, 2025–2034, (USD MILLION)
FIGURE 52 REST OF LATIN AMERICA PROGRESSIVE WEB APPS CURRENT AND FUTURE END USER ANALYSIS, 2025–2034, (USD MILLION)
FIGURE 53 EASTERN EUROPE PROGRESSIVE WEB APPS CURRENT AND FUTURE MARKET VOLUME SHARE REGIONAL ANALYSIS, 2025–2034, (USD MILLION)
FIGURE 54 POLAND PROGRESSIVE WEB APPS CURRENT AND FUTURE TYPE ANALYSIS, 2025–2034, (USD MILLION)
FIGURE 55 POLAND PROGRESSIVE WEB APPS CURRENT AND FUTURE END USER ANALYSIS, 2025–2034, (USD MILLION)
FIGURE 56 RUSSIA PROGRESSIVE WEB APPS CURRENT AND FUTURE TYPE ANALYSIS, 2025–2034, (USD MILLION)
FIGURE 57 RUSSIA PROGRESSIVE WEB APPS CURRENT AND FUTURE END USER ANALYSIS, 2025–2034, (USD MILLION)
FIGURE 58 CZECH REPUBLIC PROGRESSIVE WEB APPS CURRENT AND FUTURE TYPE ANALYSIS, 2025–2034, (USD MILLION)
FIGURE 59 CZECH REPUBLIC PROGRESSIVE WEB APPS CURRENT AND FUTURE END USER ANALYSIS, 2025–2034, (USD MILLION)
FIGURE 60 ROMANIA PROGRESSIVE WEB APPS CURRENT AND FUTURE TYPE ANALYSIS, 2025–2034, (USD MILLION)
FIGURE 61 ROMANIA PROGRESSIVE WEB APPS CURRENT AND FUTURE END USER ANALYSIS, 2025–2034, (USD MILLION)
FIGURE 62 REST OF EASTERN EUROPE PROGRESSIVE WEB APPS CURRENT AND FUTURE TYPE ANALYSIS, 2025–2034, (USD MILLION)
FIGURE 63 REST OF EASTERN EUROPE PROGRESSIVE WEB APPS CURRENT AND FUTURE END USER ANALYSIS, 2025–2034, (USD MILLION)
FIGURE 64 WESTERN EUROPE PROGRESSIVE WEB APPS CURRENT AND FUTURE MARKET VOLUME SHARE REGIONAL ANALYSIS, 2025–2034, (USD MILLION)
FIGURE 65 GERMANY PROGRESSIVE WEB APPS CURRENT AND FUTURE TYPE ANALYSIS, 2025–2034, (USD MILLION)
FIGURE 66 GERMANY PROGRESSIVE WEB APPS CURRENT AND FUTURE END USER ANALYSIS, 2025–2034, (USD MILLION)
FIGURE 67 FRANCE PROGRESSIVE WEB APPS CURRENT AND FUTURE TYPE ANALYSIS, 2025–2034, (USD MILLION)
FIGURE 68 FRANCE PROGRESSIVE WEB APPS CURRENT AND FUTURE END USER ANALYSIS, 2025–2034, (USD MILLION)
FIGURE 69 UK PROGRESSIVE WEB APPS CURRENT AND FUTURE TYPE ANALYSIS, 2025–2034, (USD MILLION)
FIGURE 70 UK PROGRESSIVE WEB APPS CURRENT AND FUTURE END USER ANALYSIS, 2025–2034, (USD MILLION)
FIGURE 71 SPAIN PROGRESSIVE WEB APPS CURRENT AND FUTURE TYPE ANALYSIS, 2025–2034, (USD MILLION)
FIGURE 72 SPAIN PROGRESSIVE WEB APPS CURRENT AND FUTURE END USER ANALYSIS, 2025–2034, (USD MILLION)
FIGURE 73 ITALY PROGRESSIVE WEB APPS CURRENT AND FUTURE TYPE ANALYSIS, 2025–2034, (USD MILLION)
FIGURE 74 ITALY PROGRESSIVE WEB APPS CURRENT AND FUTURE END USER ANALYSIS, 2025–2034, (USD MILLION)
FIGURE 75 REST OF WESTERN EUROPE PROGRESSIVE WEB APPS CURRENT AND FUTURE TYPE ANALYSIS, 2025–2034, (USD MILLION)
FIGURE 76 REST OF WESTERN EUROPE PROGRESSIVE WEB APPS CURRENT AND FUTURE END USER ANALYSIS, 2025–2034, (USD MILLION)
FIGURE 77 EAST ASIA AND PACIFIC PROGRESSIVE WEB APPS CURRENT AND FUTURE MARKET VOLUME SHARE REGIONAL ANALYSIS, 2025–2034, (USD MILLION)
FIGURE 78 CHINA PROGRESSIVE WEB APPS CURRENT AND FUTURE TYPE ANALYSIS, 2025–2034, (USD MILLION)
FIGURE 79 CHINA PROGRESSIVE WEB APPS CURRENT AND FUTURE END USER ANALYSIS, 2025–2034, (USD MILLION)
FIGURE 80 JAPAN PROGRESSIVE WEB APPS CURRENT AND FUTURE TYPE ANALYSIS, 2025–2034, (USD MILLION)
FIGURE 81 JAPAN PROGRESSIVE WEB APPS CURRENT AND FUTURE END USER ANALYSIS, 2025–2034, (USD MILLION)
FIGURE 82 AUSTRALIA PROGRESSIVE WEB APPS CURRENT AND FUTURE TYPE ANALYSIS, 2025–2034, (USD MILLION)
FIGURE 83 AUSTRALIA PROGRESSIVE WEB APPS CURRENT AND FUTURE END USER ANALYSIS, 2025–2034, (USD MILLION)
FIGURE 84 CAMBODIA PROGRESSIVE WEB APPS CURRENT AND FUTURE TYPE ANALYSIS, 2025–2034, (USD MILLION)
FIGURE 85 CAMBODIA PROGRESSIVE WEB APPS CURRENT AND FUTURE END USER ANALYSIS, 2025–2034, (USD MILLION)
FIGURE 86 FIJI PROGRESSIVE WEB APPS CURRENT AND FUTURE TYPE ANALYSIS, 2025–2034, (USD MILLION)
FIGURE 87 FIJI PROGRESSIVE WEB APPS CURRENT AND FUTURE END USER ANALYSIS, 2025–2034, (USD MILLION)
FIGURE 88 INDONESIA PROGRESSIVE WEB APPS CURRENT AND FUTURE TYPE ANALYSIS, 2025–2034, (USD MILLION)
FIGURE 89 INDONESIA PROGRESSIVE WEB APPS CURRENT AND FUTURE END USER ANALYSIS, 2025–2034, (USD MILLION)
FIGURE 90 SOUTH KOREA PROGRESSIVE WEB APPS CURRENT AND FUTURE TYPE ANALYSIS, 2025–2034, (USD MILLION)
FIGURE 91 SOUTH KOREA PROGRESSIVE WEB APPS CURRENT AND FUTURE END USER ANALYSIS, 2025–2034, (USD MILLION)
FIGURE 92 REST OF EAST ASIA AND PACIFIC PROGRESSIVE WEB APPS CURRENT AND FUTURE TYPE ANALYSIS, 2025–2034, (USD MILLION)
FIGURE 93 REST OF EAST ASIA AND PACIFIC PROGRESSIVE WEB APPS CURRENT AND FUTURE END USER ANALYSIS, 2025–2034, (USD MILLION)
FIGURE 94 SEA AND SOUTH ASIA PROGRESSIVE WEB APPS CURRENT AND FUTURE MARKET VOLUME SHARE REGIONAL ANALYSIS, 2025–2034, (USD MILLION)
FIGURE 95 BANGLADESH PROGRESSIVE WEB APPS CURRENT AND FUTURE TYPE ANALYSIS, 2025–2034, (USD MILLION)
FIGURE 96 BANGLADESH PROGRESSIVE WEB APPS CURRENT AND FUTURE END USER ANALYSIS, 2025–2034, (USD MILLION)
FIGURE 97 NEW ZEALAND PROGRESSIVE WEB APPS CURRENT AND FUTURE TYPE ANALYSIS, 2025–2034, (USD MILLION)
FIGURE 98 NEW ZEALAND PROGRESSIVE WEB APPS CURRENT AND FUTURE END USER ANALYSIS, 2025–2034, (USD MILLION)
FIGURE 99 INDIA PROGRESSIVE WEB APPS CURRENT AND FUTURE TYPE ANALYSIS, 2025–2034, (USD MILLION)
FIGURE 100 INDIA PROGRESSIVE WEB APPS CURRENT AND FUTURE END USER ANALYSIS, 2025–2034, (USD MILLION)
FIGURE 101 SINGAPORE PROGRESSIVE WEB APPS CURRENT AND FUTURE TYPE ANALYSIS, 2025–2034, (USD MILLION)
FIGURE 102 SINGAPORE PROGRESSIVE WEB APPS CURRENT AND FUTURE END USER ANALYSIS, 2025–2034, (USD MILLION)
FIGURE 103 THAILAND PROGRESSIVE WEB APPS CURRENT AND FUTURE TYPE ANALYSIS, 2025–2034, (USD MILLION)
FIGURE 104 THAILAND PROGRESSIVE WEB APPS CURRENT AND FUTURE END USER ANALYSIS, 2025–2034, (USD MILLION)
FIGURE 105 TAIWAN PROGRESSIVE WEB APPS CURRENT AND FUTURE TYPE ANALYSIS, 2025–2034, (USD MILLION)
FIGURE 106 TAIWAN PROGRESSIVE WEB APPS CURRENT AND FUTURE END USER ANALYSIS, 2025–2034, (USD MILLION)
FIGURE 107 MALAYSIA PROGRESSIVE WEB APPS CURRENT AND FUTURE TYPE ANALYSIS, 2025–2034, (USD MILLION)
FIGURE 108 MALAYSIA PROGRESSIVE WEB APPS CURRENT AND FUTURE END USER ANALYSIS, 2025–2034, (USD MILLION)
FIGURE 109 REST OF SEA AND SOUTH ASIA PROGRESSIVE WEB APPS CURRENT AND FUTURE TYPE ANALYSIS, 2025–2034, (USD MILLION)
FIGURE 110 REST OF SEA AND SOUTH ASIA PROGRESSIVE WEB APPS CURRENT AND FUTURE END USER ANALYSIS, 2025–2034, (USD MILLION)
FIGURE 111 MIDDLE EAST AND AFRICA PROGRESSIVE WEB APPS CURRENT AND FUTURE MARKET VOLUME SHARE REGIONAL ANALYSIS, 2025–2034, (USD MILLION)
FIGURE 112 GCC COUNTRIES PROGRESSIVE WEB APPS CURRENT AND FUTURE TYPE ANALYSIS, 2025–2034, (USD MILLION)
FIGURE 113 GCC COUNTRIES PROGRESSIVE WEB APPS CURRENT AND FUTURE END USER ANALYSIS, 2025–2034, (USD MILLION)
FIGURE 114 SAUDI ARABIA PROGRESSIVE WEB APPS CURRENT AND FUTURE TYPE ANALYSIS, 2025–2034, (USD MILLION)
FIGURE 115 SAUDI ARABIA PROGRESSIVE WEB APPS CURRENT AND FUTURE END USER ANALYSIS, 2025–2034, (USD MILLION)
FIGURE 116 UAE PROGRESSIVE WEB APPS CURRENT AND FUTURE TYPE ANALYSIS, 2025–2034, (USD MILLION)
FIGURE 117 UAE PROGRESSIVE WEB APPS CURRENT AND FUTURE END USER ANALYSIS, 2025–2034, (USD MILLION)
FIGURE 118 BAHRAIN PROGRESSIVE WEB APPS CURRENT AND FUTURE TYPE ANALYSIS, 2025–2034, (USD MILLION)
FIGURE 119 BAHRAIN PROGRESSIVE WEB APPS CURRENT AND FUTURE END USER ANALYSIS, 2025–2034, (USD MILLION)
FIGURE 120 KUWAIT PROGRESSIVE WEB APPS CURRENT AND FUTURE TYPE ANALYSIS, 2025–2034, (USD MILLION)
FIGURE 121 KUWAIT PROGRESSIVE WEB APPS CURRENT AND FUTURE END USER ANALYSIS, 2025–2034, (USD MILLION)
FIGURE 122 OMAN PROGRESSIVE WEB APPS CURRENT AND FUTURE TYPE ANALYSIS, 2025–2034, (USD MILLION)
FIGURE 123 OMAN PROGRESSIVE WEB APPS CURRENT AND FUTURE END USER ANALYSIS, 2025–2034, (USD MILLION)
FIGURE 124 QATAR PROGRESSIVE WEB APPS CURRENT AND FUTURE TYPE ANALYSIS, 2025–2034, (USD MILLION)
FIGURE 125 QATAR PROGRESSIVE WEB APPS CURRENT AND FUTURE END USER ANALYSIS, 2025–2034, (USD MILLION)
FIGURE 126 EGYPT PROGRESSIVE WEB APPS CURRENT AND FUTURE TYPE ANALYSIS, 2025–2034, (USD MILLION)
FIGURE 127 EGYPT PROGRESSIVE WEB APPS CURRENT AND FUTURE END USER ANALYSIS, 2025–2034, (USD MILLION)
FIGURE 128 NIGERIA PROGRESSIVE WEB APPS CURRENT AND FUTURE TYPE ANALYSIS, 2025–2034, (USD MILLION)
FIGURE 129 NIGERIA PROGRESSIVE WEB APPS CURRENT AND FUTURE END USER ANALYSIS, 2025–2034, (USD MILLION)
FIGURE 130 SOUTH AFRICA PROGRESSIVE WEB APPS CURRENT AND FUTURE TYPE ANALYSIS, 2025–2034, (USD MILLION)
FIGURE 131 SOUTH AFRICA PROGRESSIVE WEB APPS CURRENT AND FUTURE END USER ANALYSIS, 2025–2034, (USD MILLION)
FIGURE 132 ISRAEL PROGRESSIVE WEB APPS CURRENT AND FUTURE TYPE ANALYSIS, 2025–2034, (USD MILLION)
FIGURE 133 ISRAEL PROGRESSIVE WEB APPS CURRENT AND FUTURE END USER ANALYSIS, 2025–2034, (USD MILLION)
FIGURE 134 REST OF MEA PROGRESSIVE WEB APPS CURRENT AND FUTURE TYPE ANALYSIS, 2025–2034, (USD MILLION)
FIGURE 135 REST OF MEA PROGRESSIVE WEB APPS CURRENT AND FUTURE END USER ANALYSIS, 2025–2034, (USD MILLION)
FIGURE 136 U. S. MARKET SHARE ANALYSIS BY TYPE (2024)
FIGURE 137 U. S. MARKET SHARE ANALYSIS BY END USER (2024)
FIGURE 138 CANADA MARKET SHARE ANALYSIS BY TYPE (2024)
FIGURE 139 CANADA MARKET SHARE ANALYSIS BY END USER (2024)
FIGURE 140 MEXICO MARKET SHARE ANALYSIS BY TYPE (2024)
FIGURE 141 MEXICO MARKET SHARE ANALYSIS BY END USER (2024)
FIGURE 142 CHINA MARKET SHARE ANALYSIS BY TYPE (2024)
FIGURE 143 CHINA MARKET SHARE ANALYSIS BY END USER (2024)
FIGURE 144 JAPAN MARKET SHARE ANALYSIS BY TYPE (2024)
FIGURE 145 JAPAN MARKET SHARE ANALYSIS BY END USER (2024)
FIGURE 146 INDIA MARKET SHARE ANALYSIS BY TYPE (2024)
FIGURE 147 INDIA MARKET SHARE ANALYSIS BY END USER (2024)
FIGURE 148 SOUTH KOREA MARKET SHARE ANALYSIS BY TYPE (2024)
FIGURE 149 SOUTH KOREA MARKET SHARE ANALYSIS BY END USER (2024)
FIGURE 150 SAUDI ARABIA MARKET SHARE ANALYSIS BY TYPE (2024)
FIGURE 151 SAUDI ARABIA MARKET SHARE ANALYSIS BY END USER (2024)
FIGURE 152 UAE MARKET SHARE ANALYSIS BY TYPE (2024)
FIGURE 153 UAE MARKET SHARE ANALYSIS BY END USER (2024)
FIGURE 154 EGYPT MARKET SHARE ANALYSIS BY TYPE (2024)
FIGURE 155 EGYPT MARKET SHARE ANALYSIS BY END USER (2024)
FIGURE 156 NIGERIA MARKET SHARE ANALYSIS BY TYPE (2024)
FIGURE 157 NIGERIA MARKET SHARE ANALYSIS BY END USER (2024)
FIGURE 158 SOUTH AFRICA MARKET SHARE ANALYSIS BY TYPE (2024)
FIGURE 159 SOUTH AFRICA MARKET SHARE ANALYSIS BY END USER (2024)
FIGURE 160 GERMANY MARKET SHARE ANALYSIS BY TYPE (2024)
FIGURE 161 GERMANY MARKET SHARE ANALYSIS BY END USER (2024)
FIGURE 162 FRANCE MARKET SHARE ANALYSIS BY TYPE (2024)
FIGURE 163 FRANCE MARKET SHARE ANALYSIS BY END USER (2024)
FIGURE 164 UK MARKET SHARE ANALYSIS BY TYPE (2024)
FIGURE 165 UK MARKET SHARE ANALYSIS BY END USER (2024)
FIGURE 166 SPAIN MARKET SHARE ANALYSIS BY TYPE (2024)
FIGURE 167 SPAIN MARKET SHARE ANALYSIS BY END USER (2024)
FIGURE 168 ITALY MARKET SHARE ANALYSIS BY TYPE (2024)
FIGURE 169 ITALY MARKET SHARE ANALYSIS BY END USER (2024)
FIGURE 170 BRAZIL MARKET SHARE ANALYSIS BY TYPE (2024)
FIGURE 171 BRAZIL MARKET SHARE ANALYSIS BY END USER (2024)
FIGURE 172 ARGENTINA MARKET SHARE ANALYSIS BY TYPE (2024)
FIGURE 173 ARGENTINA MARKET SHARE ANALYSIS BY END USER (2024)
FIGURE 174 COLUMBIA MARKET SHARE ANALYSIS BY TYPE (2024)
FIGURE 175 COLUMBIA MARKET SHARE ANALYSIS BY END USER (2024)
FIGURE 176 GLOBAL PROGRESSIVE WEB APPS CURRENT AND FUTURE MARKET KEY COUNTRY LEVEL ANALYSIS, 2024–2034, (USD MILLION)
FIGURE 177 FINANCIAL OVERVIEW:
Key Player Analysis
Google: Google remains a market leader in the Progressive Web Apps (PWA) ecosystem, leveraging its Chrome browser dominance and extensive developer tools portfolio to shape PWA standards and adoption. Through its Lighthouse auditing tool and the Chrome DevTools suite, Google enables developers to measure and enhance PWA performance, accessibility, and reliability. The company actively promotes service worker adoption and web app manifests, ensuring alignment with PWA core capabilities. In 2025, Google continues to invest in improving browser-based APIs, further narrowing the performance gap between PWAs and native apps. Its global influence and infrastructure make it a foundational force behind cross-platform compatibility and web performance benchmarks.
Microsoft: Microsoft positions itself as a challenger-turned-enabler in the PWA space, integrating PWA support deeply into the Windows ecosystem. Microsoft Edge, built on Chromium, offers full PWA installation and management capabilities through the Microsoft Store. The company’s strategic emphasis on open web standards and its PWA Builder tool has made PWA development more accessible to enterprises and independent developers. As of 2025, Microsoft is focused on aligning PWAs with Azure’s cloud and DevOps platforms, allowing businesses to streamline deployment through CI/CD pipelines. This positions Microsoft as a key player bridging enterprise-scale infrastructure with modern web app delivery.
OutSystems: OutSystems operates as an innovator in low-code application development and has carved out a distinct position by enabling rapid deployment of PWAs within its visual development environment. The platform supports responsive design, offline access, and integration with enterprise systems, making it attractive for organizations seeking speed without sacrificing functionality. OutSystems’ emphasis on low-code PWAs addresses the growing demand for fast rollouts in sectors like finance, healthcare, and logistics. By 2025, the company’s expanded AI-assisted development tools and strategic cloud partnerships with AWS and Microsoft Azure are helping enterprise clients reduce application delivery time by over 60%.
Alokai (formerly Vue Storefront): Alokai holds a niche yet influential position in the PWA market, focusing on the e-commerce sector through its headless frontend framework. Built on Vue.js, Alokai offers a modular architecture that allows retailers to build fast-loading, API-driven storefronts with PWA capabilities. As of 2025, the company supports integrations with over 40 e-commerce platforms and CMS providers, including Magento, Shopify, and Contentful. Alokai’s core value lies in speed and flexibility, enabling merchants to improve mobile conversion rates by up to 35% and reduce bounce rates. Its growing partner ecosystem and expansion across European and North American markets make it a critical player in the PWA-driven commerce transformation.
Market Key Players
DockYard Inc.
OutSystems
Meta
Enonic AS
Google
IBM Corporation
GoodBarber
Cloud Four, Inc.
Svelte
Microsoft
Alokai (former Vue Storefront)
Other key players
Driver:
Growing Demand for Fast, App-Like Web Experiences Fueling PWA Adoption
As of 2025, user expectations for speed, accessibility, and functionality continue to redefine application design. Progressive Web Apps (PWAs) meet this demand by delivering app-like experiences directly through the browser. Their key advantages—fast load times, offline functionality, and push notifications—enhance engagement and retention. Companies adopting PWAs have reported measurable improvements in customer interaction. For example, JD.ID achieved a 53% increase in mobile conversions after switching to PWA, while Hulu recorded a 27% rise in return visits. These figures underscore the direct commercial benefits of improved user experience, making it a core driver of PWA adoption across consumer-facing industries.
Restraint:
Limited Browser Support Restricting Full-Scale PWA Performance
Despite growing adoption, PWAs face uneven browser support that limits their full functionality. In particular, Apple’s Safari still does not support some key PWA features such as push notifications and full offline access. This lack of standardization leads to inconsistent user experiences, especially across iOS devices. Businesses deploying PWAs must often invest in fallback solutions or parallel development for native applications, increasing cost and complexity. For markets with a large iOS user base, these constraints can diminish the operational efficiency and user reach that PWAs aim to deliver.
Opportunity:
Mobile-First Growth in Emerging Markets Accelerating PWA Expansion
The continued rise of mobile-first internet usage in emerging markets presents a major growth opportunity for PWAs. In regions where mobile is often the only access point to the web, users require applications that perform reliably on low-end devices and slow connections. PWAs address this need with lightweight builds and offline capabilities supported by service workers. With mobile internet usage projected to exceed 7.5 billion users globally by 2027, the demand for accessible, cost-effective, and fast-loading web apps is expected to surge. Companies targeting Asia, Latin America, and Africa can scale faster with PWA deployments while minimizing infrastructure and development costs.
Trend:
Modern Frameworks and WebAssembly Driving Next-Gen PWA Development
In 2025, a major trend shaping the PWA market is the growing integration of headless CMS platforms and frontend frameworks like React, Vue, and Angular. This shift enables more modular development and faster deployment cycles, especially for content-heavy applications such as media, e-commerce, and education. Companies are also adopting WebAssembly (Wasm) to deliver near-native performance within PWAs, allowing advanced use cases like online video editing and graphic design. At the same time, increased regulatory scrutiny has pushed developers to build in GDPR- and CCPA-compliant features from the ground up. As security and performance expectations rise, PWAs are evolving into a robust alternative to traditional mobile apps.
Recent Developments
Dec 2024 – Google: Google rolled out major updates to its PWA Builder toolkit, introducing AI-assisted optimization features for load time and offline caching. The tool now supports automatic performance scoring tied to Lighthouse metrics, reducing PWA build time by nearly 30%. This strengthens Google’s position as the leading enabler of PWA development across enterprise and consumer sectors.
Feb 2025 – OutSystems: OutSystems launched an enterprise-focused low-code PWA module integrated with its cloud-native DevOps platform. Early adoption by financial services clients in Europe has shown a 42% reduction in time-to-market for customer-facing apps. This move extends OutSystems’ reach in regulated sectors where speed, security, and compliance are essential.
Apr 2025 – Alokai (formerly Vue Storefront): Alokai announced a strategic partnership with Shopify to deliver default PWA storefronts for Shopify Plus merchants. The integration aims to improve mobile conversions by 25% and is expected to impact over 15,000 e-commerce stores by year-end. This expands Alokai’s footprint in North America and strengthens its e-commerce vertical positioning.
Jul 2025 – Microsoft: Microsoft added full PWA integration into Microsoft Teams and Outlook for business users, enabling offline access and push notifications across Office 365. Internal reports estimate a 19% increase in daily active users for Teams mobile web clients. This move positions Microsoft as a key PWA backer within enterprise collaboration tools.
Sep 2025 – Meta: Meta began migrating select features of Instagram Web and Facebook Lite into PWA formats for regions with limited connectivity. The pilot program in Southeast Asia reports a 3.2x increase in average session time on PWA versions. This shift helps Meta reduce infrastructure loads while enhancing user engagement in mobile-first markets