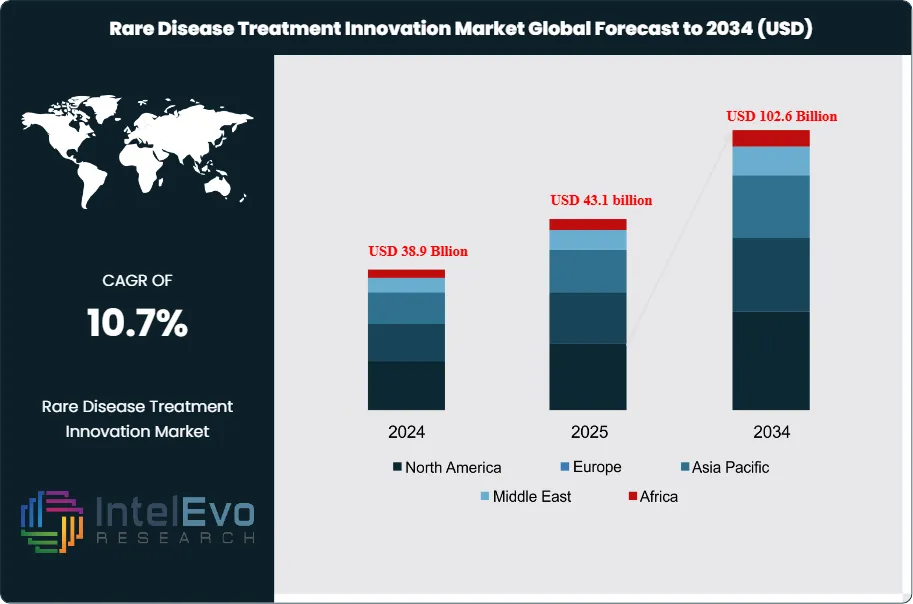
The Global Rare Disease Treatment Innovation Market size is expected to be worth around USD 102.6 billion by 2034, up from approximately USD 38.9 billion in 2024, growing at a CAGR of 10.7% during the forecast period from 2025 to 2034. With advancements in gene therapy, precision medicine, and AI-driven drug discovery, the rare disease treatment ecosystem is witnessing unprecedented growth. Increasing global healthcare investments and strong regulatory support are further driving innovations that bring hope to millions of patients worldwide. This sector is positioned to reshape the future of healthcare with breakthrough treatments and collaborative R&D efforts.
The Global Rare Disease Treatment Innovation Market encompasses therapies developed for the treatment of rare diseases, which are conditions affecting a small percentage of the population. The market is characterized by a range of innovative products, including biologics and non-biologics, aimed at addressing unmet medical needs. Current dynamics indicate a growing interest in rare diseases, driven by advancements in research and development, increasing drug approvals, and a robust pipeline from major pharmaceutical companies. Regulatory incentives and the globalization of healthcare further contribute to the market's expansion, reflecting a commitment to improving patient outcomes and access to treatments for these challenging conditions.
The growth dynamics of the rare disease treatment market are underscored by several key drivers. Increasing awareness of rare diseases among healthcare providers and patients is propelling demand for effective treatments. Advances in gene therapy, precision medicine, and orphan drug development have expanded the therapeutic landscape, enabling new treatment modalities that were previously unavailable. Additionally, government support and funding for research initiatives are fostering innovation in this sector. The rising prevalence of rare diseases and the associated push for personalized medicine are also critical factors contributing to the market's growth. These elements collectively create a favorable environment for investment and development in rare disease treatments.
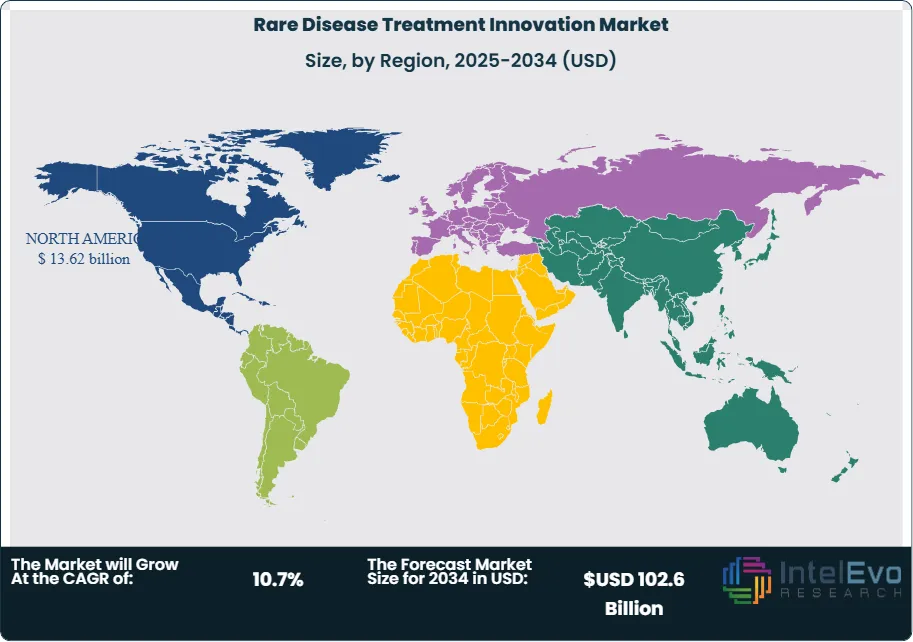
North America is anticipated to dominate the rare disease treatment market, attributed to high healthcare spending, advanced research facilities, and a favorable regulatory environment. The presence of key market players and a robust pipeline of therapies further reinforce this dominance. However, the Asia-Pacific region is expected to witness significant growth, driven by increasing healthcare investments, rising awareness, and government initiatives to improve access to treatments. Europe also plays a crucial role in the market, supported by strong healthcare systems and a focus on rare disease research and development. As global healthcare systems evolve, the market landscape will continue to change, highlighting the importance of regional strategies.
The COVID-19 pandemic has had a notable impact on the rare disease treatment market, influencing research, development timelines, and patient access to therapies. Disruptions in clinical trials and healthcare services affected the development and availability of new treatments, leading to delays in approvals. However, the pandemic also accelerated the adoption of telemedicine and remote patient monitoring, which may benefit the treatment of rare diseases in the long run. As healthcare systems adapt to the new normal, the focus on rare diseases is expected to strengthen, ensuring that patients receive the necessary care and attention.
Market Growth: The global rare disease treatment innovation market is expected to reach USD 102.6 billion by 2034, growing at a robust CAGR of 10.7%, indicating strong market expansion due to advancements in research and increased awareness.
Disease Type Analysis: The market is predominantly segmented by disease type, with cancers, metabolic diseases, and neurological conditions accounting for significant shares. The rising prevalence of these conditions drives demand for innovative therapies targeting specific rare diseases.
Product Type Analysis: The product type segment is primarily led by biologics, reflecting their effectiveness in treating complex rare diseases. The increasing approval of biologics by regulatory agencies supports market growth and offers diverse treatment options for patients.
Driver: Key growth drivers include heightened awareness of rare diseases, advancements in gene therapy, and supportive government policies promoting orphan drug development, leading to a favorable environment for innovation and investment in this sector.
Restraint: High costs associated with the development and production of rare disease treatments pose a significant restraint. Limited patient populations for rare diseases can also hinder the financial viability of developing new therapies.
Opportunity: The growing focus on precision medicine and personalized therapies presents substantial opportunities for market expansion. Additionally, increasing investments in rare disease research from pharmaceutical companies can lead to breakthrough treatments.
Trend: A significant trend in the market is the rising adoption of gene therapy and personalized medicine, enabling tailored treatments that address the specific genetic causes of rare diseases.
Regional Analysis: North America is expected to dominate the market, driven by high healthcare expenditures and advanced research capabilities, while the Asia-Pacific region shows promising growth potential due to increasing healthcare investments and awareness initiatives.
Disease Type:
The disease type segment of the global rare disease treatment market includes a variety of conditions, with significant contributions from cancer, metabolic diseases, and neurological disorders. Cancers, particularly rare subtypes, account for a large portion of the market due to the urgent need for targeted therapies. Metabolic diseases, such as phenylketonuria (PKU) and Gaucher disease, drive demand for innovative treatments, highlighting the importance of enzyme replacement and gene therapy. Neurological conditions, like Huntington's disease and spinal muscular atrophy, are also key contributors, prompting research into advanced therapeutic options. The growth in this segment is bolstered by increasing awareness and diagnosis, coupled with advancements in medical research and a focus on developing orphan drugs for these underserved conditions.
Product Type:
The product type segment is primarily categorized into biologics and non-biologics, with biologics leading the market. Biologics, which include monoclonal antibodies, gene therapies, and cell-based therapies, have transformed treatment paradigms for various rare diseases. Their ability to target specific pathways and provide personalized treatment options has garnered significant attention from healthcare providers and patients alike. Non-biologics, encompassing traditional small molecule drugs, also play a vital role in treating rare diseases but face challenges related to efficacy and safety compared to biologics. The increasing number of biologics receiving regulatory approval is fueling market growth, reflecting a trend towards innovative and targeted therapies that offer improved outcomes for patients suffering from rare conditions.
End-User:
The end-user segment of the rare disease treatment market is primarily composed of specialty pharmacies, hospital pharmacies, and retail pharmacies. Specialty pharmacies are pivotal in managing the distribution of complex and high-cost therapies, particularly biologics and advanced therapeutics, ensuring patients receive proper education and support. Hospital pharmacies are also crucial, as they provide on-site dispensing and clinical management for patients undergoing treatment in healthcare facilities. Retail pharmacies play a complementary role, offering access to non-specialty drugs and over-the-counter treatments for rare diseases. The growing prevalence of rare diseases and the increasing complexity of treatments necessitate specialized services, driving growth within specialty and hospital pharmacies as they adapt to meet the evolving needs of patients and healthcare providers.
Age Group:
The age group segment is divided into adult and pediatric categories, with distinct needs and treatment approaches for each group. Pediatric patients often require specialized formulations and dosing, as their physiological differences necessitate tailored therapies. This segment has seen a rise in the development of treatments targeting genetic disorders, congenital conditions, and metabolic diseases prevalent in children. Adult patients, on the other hand, are more frequently diagnosed with conditions like rare cancers and autoimmune diseases. The market's growth in both segments is driven by increased awareness, advancements in genetic testing, and a greater focus on developing innovative therapies that address the specific challenges faced by different age groups. The expansion of research initiatives targeting both pediatric and adult rare diseases continues to shape this segment.
Region Analysis:
North America Leads With 35% Market Share in the Global Rare Disease Treatment Innovation Market: North America holds the largest market share in the global rare disease treatment innovation market, accounting for approximately 35% of the total revenue. This dominance is primarily driven by advanced healthcare infrastructure, significant investments in research and development, and a high prevalence of rare diseases. The United States, in particular, has a robust ecosystem of pharmaceutical companies and research institutions focused on developing orphan drugs and biologics. Furthermore, supportive government policies, such as the Orphan Drug Act, incentivize the development of therapies for rare conditions. The presence of well-established healthcare systems, alongside increasing patient awareness and advocacy, fuels market growth. Additionally, the growing trend of personalized medicine and gene therapy is anticipated to strengthen North America's position in the market further.
The Asia-Pacific region is emerging as the fastest-growing market for rare disease treatment innovation, with a projected CAGR of over 12% during the forecast period. Key drivers include increasing healthcare investments, expanding pharmaceutical markets, and rising awareness of rare diseases among healthcare professionals and patients. Countries like China and India are making substantial advancements in biotechnology and research capabilities, leading to the development of innovative therapies tailored to local populations. Additionally, supportive government initiatives and funding for rare disease research are fostering growth in this region. Meanwhile, Europe remains a strong player, accounting for a substantial market share, driven by a well-established healthcare system and comprehensive regulations supporting orphan drug development. Latin America and the Middle East and Africa also exhibit growth potential, albeit at a slower pace, due to improving healthcare access and rising incidences of rare diseases.
Customization for segments, region/country-level will be provided. Moreover, additional customization can be done based on the requirements.
Pricing and Purchase Options
Avail customized purchase options to meet your exact research needs. We have three licenses to opt for: Single User License, Multi-User License (Up to 5 Users), Corporate Use License (Unlimited User and Printable PDF).
TABLE OF CONTENTS
1. EXECUTIVE SUMMARY
1.1. MARKET SNAPSHOT
1.2. KEY FINDINGS & INSIGHTS
1.3. ANALYST RECOMMENDATIONS
1.4. FUTURE OUTLOOK
2. RESEARCH METHODOLOGY
2.1. MARKET DEFINITION & SCOPE
2.2. RESEARCH OBJECTIVES: PRIMARY & SECONDARY DATA SOURCES
2.3. DATA COLLECTION SOURCES
2.3.1. COVERAGE OF 100+ PRIMARY RESEARCH/CONSULTATION CALLS WITH INDUSTRY STAKEHOLDERS
FIGURE 17 NORTH AMERICA RARE DISEASE TREATMENT INNOVATION CURRENT AND FUTURE TYPE ANALYSIS, 2025–2034, (USD MILLION)
FIGURE 18 NORTH AMERICA RARE DISEASE TREATMENT INNOVATION CURRENT AND FUTURE END USER ANALYSIS, 2025–2034, (USD MILLION)
FIGURE 19 MARKET SHARE BY COUNTRY
FIGURE 20 LATIN AMERICA RARE DISEASE TREATMENT INNOVATION CURRENT AND FUTURE TYPE ANALYSIS, 2025–2034, (USD MILLION)
FIGURE 21 LATIN AMERICA RARE DISEASE TREATMENT INNOVATION CURRENT AND FUTURE END USER ANALYSIS, 2025–2034, (USD MILLION)
FIGURE 22 MARKET SHARE BY COUNTRY
FIGURE 23 EASTERN EUROPE RARE DISEASE TREATMENT INNOVATION CURRENT AND FUTURE TYPE ANALYSIS, 2025–2034, (USD MILLION)
FIGURE 24 EASTERN EUROPE RARE DISEASE TREATMENT INNOVATION CURRENT AND FUTURE END USER ANALYSIS, 2025–2034, (USD MILLION)
FIGURE 25 MARKET SHARE BY COUNTRY
FIGURE 26 WESTERN EUROPE RARE DISEASE TREATMENT INNOVATION CURRENT AND FUTURE TYPE ANALYSIS, 2025–2034, (USD MILLION)
FIGURE 27 WESTERN EUROPE RARE DISEASE TREATMENT INNOVATION CURRENT AND FUTURE END USER ANALYSIS, 2025–2034, (USD MILLION)
FIGURE 28 MARKET SHARE BY COUNTRY
FIGURE 29 EAST ASIA AND PACIFIC RARE DISEASE TREATMENT INNOVATION CURRENT AND FUTURE TYPE ANALYSIS, 2025–2034, (USD MILLION)
FIGURE 30 EAST ASIA AND PACIFIC RARE DISEASE TREATMENT INNOVATION CURRENT AND FUTURE END USER ANALYSIS, 2025–2034, (USD MILLION)
FIGURE 31 MARKET SHARE BY COUNTRY
FIGURE 32 SEA AND SOUTH ASIA RARE DISEASE TREATMENT INNOVATION CURRENT AND FUTURE TYPE ANALYSIS, 2025–2034, (USD MILLION)
FIGURE 33 SEA AND SOUTH ASIA RARE DISEASE TREATMENT INNOVATION CURRENT AND FUTURE END USER ANALYSIS, 2025–2034, (USD MILLION)
FIGURE 34 MARKET SHARE BY COUNTRY
FIGURE 35 MIDDLE EAST AND AFRICA RARE DISEASE TREATMENT INNOVATION CURRENT AND FUTURE TYPE ANALYSIS, 2025–2034, (USD MILLION)
FIGURE 36 MIDDLE EAST AND AFRICA RARE DISEASE TREATMENT INNOVATION CURRENT AND FUTURE END USER ANALYSIS, 2025–2034, (USD MILLION)
FIGURE 37 NORTH AMERICA RARE DISEASE TREATMENT INNOVATION CURRENT AND FUTURE MARKET VOLUME SHARE REGIONAL ANALYSIS, 2025–2034, (USD MILLION)
FIGURE 38 U.S. RARE DISEASE TREATMENT INNOVATION CURRENT AND FUTURE TYPE ANALYSIS, 2025–2034, (USD MILLION)
FIGURE 39 U.S. RARE DISEASE TREATMENT INNOVATION CURRENT AND FUTURE END USER ANALYSIS, 2025–2034, (USD MILLION)
FIGURE 40 CANADA RARE DISEASE TREATMENT INNOVATION CURRENT AND FUTURE TYPE ANALYSIS, 2025–2034, (USD MILLION)
FIGURE 41 CANADA RARE DISEASE TREATMENT INNOVATION CURRENT AND FUTURE END USER ANALYSIS, 2025–2034, (USD MILLION)
FIGURE 42 LATIN AMERICA RARE DISEASE TREATMENT INNOVATION CURRENT AND FUTURE MARKET VOLUME SHARE REGIONAL ANALYSIS, 2025–2034, (USD MILLION)
FIGURE 43 MEXICO RARE DISEASE TREATMENT INNOVATION CURRENT AND FUTURE TYPE ANALYSIS, 2025–2034, (USD MILLION)
FIGURE 44 MEXICO RARE DISEASE TREATMENT INNOVATION CURRENT AND FUTURE END USER ANALYSIS, 2025–2034, (USD MILLION)
FIGURE 45 BRAZIL RARE DISEASE TREATMENT INNOVATION CURRENT AND FUTURE TYPE ANALYSIS, 2025–2034, (USD MILLION)
FIGURE 46 BRAZIL RARE DISEASE TREATMENT INNOVATION CURRENT AND FUTURE END USER ANALYSIS, 2025–2034, (USD MILLION)
FIGURE 47 ARGENTINA RARE DISEASE TREATMENT INNOVATION CURRENT AND FUTURE TYPE ANALYSIS, 2025–2034, (USD MILLION)
FIGURE 48 ARGENTINA RARE DISEASE TREATMENT INNOVATION CURRENT AND FUTURE END USER ANALYSIS, 2025–2034, (USD MILLION)
FIGURE 49 COLUMBIA RARE DISEASE TREATMENT INNOVATION CURRENT AND FUTURE TYPE ANALYSIS, 2025–2034, (USD MILLION)
FIGURE 50 COLUMBIA RARE DISEASE TREATMENT INNOVATION CURRENT AND FUTURE END USER ANALYSIS, 2025–2034, (USD MILLION)
FIGURE 51 REST OF LATIN AMERICA RARE DISEASE TREATMENT INNOVATION CURRENT AND FUTURE TYPE ANALYSIS, 2025–2034, (USD MILLION)
FIGURE 52 REST OF LATIN AMERICA RARE DISEASE TREATMENT INNOVATION CURRENT AND FUTURE END USER ANALYSIS, 2025–2034, (USD MILLION)
FIGURE 53 EASTERN EUROPE RARE DISEASE TREATMENT INNOVATION CURRENT AND FUTURE MARKET VOLUME SHARE REGIONAL ANALYSIS, 2025–2034, (USD MILLION)
FIGURE 54 POLAND RARE DISEASE TREATMENT INNOVATION CURRENT AND FUTURE TYPE ANALYSIS, 2025–2034, (USD MILLION)
FIGURE 55 POLAND RARE DISEASE TREATMENT INNOVATION CURRENT AND FUTURE END USER ANALYSIS, 2025–2034, (USD MILLION)
FIGURE 56 RUSSIA RARE DISEASE TREATMENT INNOVATION CURRENT AND FUTURE TYPE ANALYSIS, 2025–2034, (USD MILLION)
FIGURE 57 RUSSIA RARE DISEASE TREATMENT INNOVATION CURRENT AND FUTURE END USER ANALYSIS, 2025–2034, (USD MILLION)
FIGURE 58 CZECH REPUBLIC RARE DISEASE TREATMENT INNOVATION CURRENT AND FUTURE TYPE ANALYSIS, 2025–2034, (USD MILLION)
FIGURE 59 CZECH REPUBLIC RARE DISEASE TREATMENT INNOVATION CURRENT AND FUTURE END USER ANALYSIS, 2025–2034, (USD MILLION)
FIGURE 60 ROMANIA RARE DISEASE TREATMENT INNOVATION CURRENT AND FUTURE TYPE ANALYSIS, 2025–2034, (USD MILLION)
FIGURE 61 ROMANIA RARE DISEASE TREATMENT INNOVATION CURRENT AND FUTURE END USER ANALYSIS, 2025–2034, (USD MILLION)
FIGURE 62 REST OF EASTERN EUROPE RARE DISEASE TREATMENT INNOVATION CURRENT AND FUTURE TYPE ANALYSIS, 2025–2034, (USD MILLION)
FIGURE 63 REST OF EASTERN EUROPE RARE DISEASE TREATMENT INNOVATION CURRENT AND FUTURE END USER ANALYSIS, 2025–2034, (USD MILLION)
FIGURE 64 WESTERN EUROPE RARE DISEASE TREATMENT INNOVATION CURRENT AND FUTURE MARKET VOLUME SHARE REGIONAL ANALYSIS, 2025–2034, (USD MILLION)
FIGURE 65 GERMANY RARE DISEASE TREATMENT INNOVATION CURRENT AND FUTURE TYPE ANALYSIS, 2025–2034, (USD MILLION)
FIGURE 66 GERMANY RARE DISEASE TREATMENT INNOVATION CURRENT AND FUTURE END USER ANALYSIS, 2025–2034, (USD MILLION)
FIGURE 67 FRANCE RARE DISEASE TREATMENT INNOVATION CURRENT AND FUTURE TYPE ANALYSIS, 2025–2034, (USD MILLION)
FIGURE 68 FRANCE RARE DISEASE TREATMENT INNOVATION CURRENT AND FUTURE END USER ANALYSIS, 2025–2034, (USD MILLION)
FIGURE 69 UK RARE DISEASE TREATMENT INNOVATION CURRENT AND FUTURE TYPE ANALYSIS, 2025–2034, (USD MILLION)
FIGURE 70 UK RARE DISEASE TREATMENT INNOVATION CURRENT AND FUTURE END USER ANALYSIS, 2025–2034, (USD MILLION)
FIGURE 71 SPAIN RARE DISEASE TREATMENT INNOVATION CURRENT AND FUTURE TYPE ANALYSIS, 2025–2034, (USD MILLION)
FIGURE 72 SPAIN RARE DISEASE TREATMENT INNOVATION CURRENT AND FUTURE END USER ANALYSIS, 2025–2034, (USD MILLION)
FIGURE 73 ITALY RARE DISEASE TREATMENT INNOVATION CURRENT AND FUTURE TYPE ANALYSIS, 2025–2034, (USD MILLION)
FIGURE 74 ITALY RARE DISEASE TREATMENT INNOVATION CURRENT AND FUTURE END USER ANALYSIS, 2025–2034, (USD MILLION)
FIGURE 75 REST OF WESTERN EUROPE RARE DISEASE TREATMENT INNOVATION CURRENT AND FUTURE TYPE ANALYSIS, 2025–2034, (USD MILLION)
FIGURE 76 REST OF WESTERN EUROPE RARE DISEASE TREATMENT INNOVATION CURRENT AND FUTURE END USER ANALYSIS, 2025–2034, (USD MILLION)
FIGURE 77 EAST ASIA AND PACIFIC RARE DISEASE TREATMENT INNOVATION CURRENT AND FUTURE MARKET VOLUME SHARE REGIONAL ANALYSIS, 2025–2034, (USD MILLION)
FIGURE 78 CHINA RARE DISEASE TREATMENT INNOVATION CURRENT AND FUTURE TYPE ANALYSIS, 2025–2034, (USD MILLION)
FIGURE 79 CHINA RARE DISEASE TREATMENT INNOVATION CURRENT AND FUTURE END USER ANALYSIS, 2025–2034, (USD MILLION)
FIGURE 80 JAPAN RARE DISEASE TREATMENT INNOVATION CURRENT AND FUTURE TYPE ANALYSIS, 2025–2034, (USD MILLION)
FIGURE 81 JAPAN RARE DISEASE TREATMENT INNOVATION CURRENT AND FUTURE END USER ANALYSIS, 2025–2034, (USD MILLION)
FIGURE 82 AUSTRALIA RARE DISEASE TREATMENT INNOVATION CURRENT AND FUTURE TYPE ANALYSIS, 2025–2034, (USD MILLION)
FIGURE 83 AUSTRALIA RARE DISEASE TREATMENT INNOVATION CURRENT AND FUTURE END USER ANALYSIS, 2025–2034, (USD MILLION)
FIGURE 84 CAMBODIA RARE DISEASE TREATMENT INNOVATION CURRENT AND FUTURE TYPE ANALYSIS, 2025–2034, (USD MILLION)
FIGURE 85 CAMBODIA RARE DISEASE TREATMENT INNOVATION CURRENT AND FUTURE END USER ANALYSIS, 2025–2034, (USD MILLION)
FIGURE 86 FIJI RARE DISEASE TREATMENT INNOVATION CURRENT AND FUTURE TYPE ANALYSIS, 2025–2034, (USD MILLION)
FIGURE 87 FIJI RARE DISEASE TREATMENT INNOVATION CURRENT AND FUTURE END USER ANALYSIS, 2025–2034, (USD MILLION)
FIGURE 88 INDONESIA RARE DISEASE TREATMENT INNOVATION CURRENT AND FUTURE TYPE ANALYSIS, 2025–2034, (USD MILLION)
FIGURE 89 INDONESIA RARE DISEASE TREATMENT INNOVATION CURRENT AND FUTURE END USER ANALYSIS, 2025–2034, (USD MILLION)
FIGURE 90 SOUTH KOREA RARE DISEASE TREATMENT INNOVATION CURRENT AND FUTURE TYPE ANALYSIS, 2025–2034, (USD MILLION)
FIGURE 91 SOUTH KOREA RARE DISEASE TREATMENT INNOVATION CURRENT AND FUTURE END USER ANALYSIS, 2025–2034, (USD MILLION)
FIGURE 92 REST OF EAST ASIA AND PACIFIC RARE DISEASE TREATMENT INNOVATION CURRENT AND FUTURE TYPE ANALYSIS, 2025–2034, (USD MILLION)
FIGURE 93 REST OF EAST ASIA AND PACIFIC RARE DISEASE TREATMENT INNOVATION CURRENT AND FUTURE END USER ANALYSIS, 2025–2034, (USD MILLION)
FIGURE 94 SEA AND SOUTH ASIA RARE DISEASE TREATMENT INNOVATION CURRENT AND FUTURE MARKET VOLUME SHARE REGIONAL ANALYSIS, 2025–2034, (USD MILLION)
FIGURE 95 BANGLADESH RARE DISEASE TREATMENT INNOVATION CURRENT AND FUTURE TYPE ANALYSIS, 2025–2034, (USD MILLION)
FIGURE 96 BANGLADESH RARE DISEASE TREATMENT INNOVATION CURRENT AND FUTURE END USER ANALYSIS, 2025–2034, (USD MILLION)
FIGURE 97 NEW ZEALAND RARE DISEASE TREATMENT INNOVATION CURRENT AND FUTURE TYPE ANALYSIS, 2025–2034, (USD MILLION)
FIGURE 98 NEW ZEALAND RARE DISEASE TREATMENT INNOVATION CURRENT AND FUTURE END USER ANALYSIS, 2025–2034, (USD MILLION)
FIGURE 99 INDIA RARE DISEASE TREATMENT INNOVATION CURRENT AND FUTURE TYPE ANALYSIS, 2025–2034, (USD MILLION)
FIGURE 100 INDIA RARE DISEASE TREATMENT INNOVATION CURRENT AND FUTURE END USER ANALYSIS, 2025–2034, (USD MILLION)
FIGURE 101 SINGAPORE RARE DISEASE TREATMENT INNOVATION CURRENT AND FUTURE TYPE ANALYSIS, 2025–2034, (USD MILLION)
FIGURE 102 SINGAPORE RARE DISEASE TREATMENT INNOVATION CURRENT AND FUTURE END USER ANALYSIS, 2025–2034, (USD MILLION)
FIGURE 103 THAILAND RARE DISEASE TREATMENT INNOVATION CURRENT AND FUTURE TYPE ANALYSIS, 2025–2034, (USD MILLION)
FIGURE 104 THAILAND RARE DISEASE TREATMENT INNOVATION CURRENT AND FUTURE END USER ANALYSIS, 2025–2034, (USD MILLION)
FIGURE 105 TAIWAN RARE DISEASE TREATMENT INNOVATION CURRENT AND FUTURE TYPE ANALYSIS, 2025–2034, (USD MILLION)
FIGURE 106 TAIWAN RARE DISEASE TREATMENT INNOVATION CURRENT AND FUTURE END USER ANALYSIS, 2025–2034, (USD MILLION)
FIGURE 107 MALAYSIA RARE DISEASE TREATMENT INNOVATION CURRENT AND FUTURE TYPE ANALYSIS, 2025–2034, (USD MILLION)
FIGURE 108 MALAYSIA RARE DISEASE TREATMENT INNOVATION CURRENT AND FUTURE END USER ANALYSIS, 2025–2034, (USD MILLION)
FIGURE 109 REST OF SEA AND SOUTH ASIA RARE DISEASE TREATMENT INNOVATION CURRENT AND FUTURE TYPE ANALYSIS, 2025–2034, (USD MILLION)
FIGURE 110 REST OF SEA AND SOUTH ASIA RARE DISEASE TREATMENT INNOVATION CURRENT AND FUTURE END USER ANALYSIS, 2025–2034, (USD MILLION)
FIGURE 111 MIDDLE EAST AND AFRICA RARE DISEASE TREATMENT INNOVATION CURRENT AND FUTURE MARKET VOLUME SHARE REGIONAL ANALYSIS, 2025–2034, (USD MILLION)
FIGURE 112 GCC COUNTRIES RARE DISEASE TREATMENT INNOVATION CURRENT AND FUTURE TYPE ANALYSIS, 2025–2034, (USD MILLION)
FIGURE 113 GCC COUNTRIES RARE DISEASE TREATMENT INNOVATION CURRENT AND FUTURE END USER ANALYSIS, 2025–2034, (USD MILLION)
FIGURE 114 SAUDI ARABIA RARE DISEASE TREATMENT INNOVATION CURRENT AND FUTURE TYPE ANALYSIS, 2025–2034, (USD MILLION)
FIGURE 115 SAUDI ARABIA RARE DISEASE TREATMENT INNOVATION CURRENT AND FUTURE END USER ANALYSIS, 2025–2034, (USD MILLION)
FIGURE 116 UAE RARE DISEASE TREATMENT INNOVATION CURRENT AND FUTURE TYPE ANALYSIS, 2025–2034, (USD MILLION)
FIGURE 117 UAE RARE DISEASE TREATMENT INNOVATION CURRENT AND FUTURE END USER ANALYSIS, 2025–2034, (USD MILLION)
FIGURE 118 BAHRAIN RARE DISEASE TREATMENT INNOVATION CURRENT AND FUTURE TYPE ANALYSIS, 2025–2034, (USD MILLION)
FIGURE 119 BAHRAIN RARE DISEASE TREATMENT INNOVATION CURRENT AND FUTURE END USER ANALYSIS, 2025–2034, (USD MILLION)
FIGURE 120 KUWAIT RARE DISEASE TREATMENT INNOVATION CURRENT AND FUTURE TYPE ANALYSIS, 2025–2034, (USD MILLION)
FIGURE 121 KUWAIT RARE DISEASE TREATMENT INNOVATION CURRENT AND FUTURE END USER ANALYSIS, 2025–2034, (USD MILLION)
FIGURE 122 OMAN RARE DISEASE TREATMENT INNOVATION CURRENT AND FUTURE TYPE ANALYSIS, 2025–2034, (USD MILLION)
FIGURE 123 OMAN RARE DISEASE TREATMENT INNOVATION CURRENT AND FUTURE END USER ANALYSIS, 2025–2034, (USD MILLION)
FIGURE 124 QATAR RARE DISEASE TREATMENT INNOVATION CURRENT AND FUTURE TYPE ANALYSIS, 2025–2034, (USD MILLION)
FIGURE 125 QATAR RARE DISEASE TREATMENT INNOVATION CURRENT AND FUTURE END USER ANALYSIS, 2025–2034, (USD MILLION)
FIGURE 126 EGYPT RARE DISEASE TREATMENT INNOVATION CURRENT AND FUTURE TYPE ANALYSIS, 2025–2034, (USD MILLION)
FIGURE 127 EGYPT RARE DISEASE TREATMENT INNOVATION CURRENT AND FUTURE END USER ANALYSIS, 2025–2034, (USD MILLION)
FIGURE 128 NIGERIA RARE DISEASE TREATMENT INNOVATION CURRENT AND FUTURE TYPE ANALYSIS, 2025–2034, (USD MILLION)
FIGURE 129 NIGERIA RARE DISEASE TREATMENT INNOVATION CURRENT AND FUTURE END USER ANALYSIS, 2025–2034, (USD MILLION)
FIGURE 130 SOUTH AFRICA RARE DISEASE TREATMENT INNOVATION CURRENT AND FUTURE TYPE ANALYSIS, 2025–2034, (USD MILLION)
FIGURE 131 SOUTH AFRICA RARE DISEASE TREATMENT INNOVATION CURRENT AND FUTURE END USER ANALYSIS, 2025–2034, (USD MILLION)
FIGURE 132 ISRAEL RARE DISEASE TREATMENT INNOVATION CURRENT AND FUTURE TYPE ANALYSIS, 2025–2034, (USD MILLION)
FIGURE 133 ISRAEL RARE DISEASE TREATMENT INNOVATION CURRENT AND FUTURE END USER ANALYSIS, 2025–2034, (USD MILLION)
FIGURE 134 REST OF MEA RARE DISEASE TREATMENT INNOVATION CURRENT AND FUTURE TYPE ANALYSIS, 2025–2034, (USD MILLION)
FIGURE 135 REST OF MEA RARE DISEASE TREATMENT INNOVATION CURRENT AND FUTURE END USER ANALYSIS, 2025–2034, (USD MILLION)
FIGURE 136 U. S. MARKET SHARE ANALYSIS BY TYPE (2024)
FIGURE 137 U. S. MARKET SHARE ANALYSIS BY END USER (2024)
FIGURE 138 CANADA MARKET SHARE ANALYSIS BY TYPE (2024)
FIGURE 139 CANADA MARKET SHARE ANALYSIS BY END USER (2024)
FIGURE 140 MEXICO MARKET SHARE ANALYSIS BY TYPE (2024)
FIGURE 141 MEXICO MARKET SHARE ANALYSIS BY END USER (2024)
FIGURE 142 CHINA MARKET SHARE ANALYSIS BY TYPE (2024)
FIGURE 143 CHINA MARKET SHARE ANALYSIS BY END USER (2024)
FIGURE 144 JAPAN MARKET SHARE ANALYSIS BY TYPE (2024)
FIGURE 145 JAPAN MARKET SHARE ANALYSIS BY END USER (2024)
FIGURE 146 INDIA MARKET SHARE ANALYSIS BY TYPE (2024)
FIGURE 147 INDIA MARKET SHARE ANALYSIS BY END USER (2024)
FIGURE 148 SOUTH KOREA MARKET SHARE ANALYSIS BY TYPE (2024)
FIGURE 149 SOUTH KOREA MARKET SHARE ANALYSIS BY END USER (2024)
FIGURE 150 SAUDI ARABIA MARKET SHARE ANALYSIS BY TYPE (2024)
FIGURE 151 SAUDI ARABIA MARKET SHARE ANALYSIS BY END USER (2024)
FIGURE 152 UAE MARKET SHARE ANALYSIS BY TYPE (2024)
FIGURE 153 UAE MARKET SHARE ANALYSIS BY END USER (2024)
FIGURE 154 EGYPT MARKET SHARE ANALYSIS BY TYPE (2024)
FIGURE 155 EGYPT MARKET SHARE ANALYSIS BY END USER (2024)
FIGURE 156 NIGERIA MARKET SHARE ANALYSIS BY TYPE (2024)
FIGURE 157 NIGERIA MARKET SHARE ANALYSIS BY END USER (2024)
FIGURE 158 SOUTH AFRICA MARKET SHARE ANALYSIS BY TYPE (2024)
FIGURE 159 SOUTH AFRICA MARKET SHARE ANALYSIS BY END USER (2024)
FIGURE 160 GERMANY MARKET SHARE ANALYSIS BY TYPE (2024)
FIGURE 161 GERMANY MARKET SHARE ANALYSIS BY END USER (2024)
FIGURE 162 FRANCE MARKET SHARE ANALYSIS BY TYPE (2024)
FIGURE 163 FRANCE MARKET SHARE ANALYSIS BY END USER (2024)
FIGURE 164 UK MARKET SHARE ANALYSIS BY TYPE (2024)
FIGURE 165 UK MARKET SHARE ANALYSIS BY END USER (2024)
FIGURE 166 SPAIN MARKET SHARE ANALYSIS BY TYPE (2024)
FIGURE 167 SPAIN MARKET SHARE ANALYSIS BY END USER (2024)
FIGURE 168 ITALY MARKET SHARE ANALYSIS BY TYPE (2024)
FIGURE 169 ITALY MARKET SHARE ANALYSIS BY END USER (2024)
FIGURE 170 BRAZIL MARKET SHARE ANALYSIS BY TYPE (2024)
FIGURE 171 BRAZIL MARKET SHARE ANALYSIS BY END USER (2024)
FIGURE 172 ARGENTINA MARKET SHARE ANALYSIS BY TYPE (2024)
FIGURE 173 ARGENTINA MARKET SHARE ANALYSIS BY END USER (2024)
FIGURE 174 COLUMBIA MARKET SHARE ANALYSIS BY TYPE (2024)
FIGURE 175 COLUMBIA MARKET SHARE ANALYSIS BY END USER (2024)
FIGURE 176 GLOBAL RARE DISEASE TREATMENT INNOVATION CURRENT AND FUTURE MARKET KEY COUNTRY LEVEL ANALYSIS, 2024–2034, (USD MILLION)
FIGURE 177 FINANCIAL OVERVIEW:
Key Players Analysis:
Roche: Roche, based in Switzerland, is a leader in pharmaceuticals and diagnostics, specializing in targeted therapies for rare diseases, particularly in oncology and hematology. Their product pipeline includes innovative monoclonal antibodies and personalized medicine approaches. Roche's strategy focuses on integrating diagnostics and pharmaceuticals to enhance treatment precision, ensuring better patient outcomes.
Novartis: Novartis, headquartered in Switzerland, is known for its extensive portfolio of innovative medications, including therapies for rare diseases. Their key products include Kymriah, a CAR T-cell therapy for certain leukemias. Novartis emphasizes a patient-centric approach, investing heavily in R&D to develop breakthrough treatments and exploring partnerships to expand access to rare disease therapies globally.
Sanofi: Sanofi, a French multinational, focuses on developing treatments for rare genetic and metabolic disorders. Their product offerings include enzyme replacement therapies like Fabrazyme and Cerdelga. Sanofi's business strategy involves strategic collaborations and acquisitions to bolster its rare disease portfolio while leveraging digital health solutions to enhance patient engagement and access to therapies.
GSK (GlaxoSmithKline): Based in the UK, GSK specializes in vaccines and specialty medicines, including treatments for rare diseases like Pompe disease. The company’s approach focuses on research collaborations and leveraging advanced technologies, such as gene therapy, to deliver innovative treatments. GSK emphasizes sustainability and access, aiming to provide affordable solutions for underserved populations.
Pfizer: Pfizer, a global leader in pharmaceuticals, is actively engaged in developing treatments for rare diseases, including therapies for hemophilia and genetic disorders. Their business strategy includes significant investment in R&D and strategic partnerships to enhance innovation. Pfizer also focuses on expanding global access to its rare disease therapies through patient assistance programs.
Amgen: Amgen, based in California, USA, is dedicated to biotechnology and focuses on innovative therapies for rare diseases like osteoporosis and certain types of cancer. The company's strategy emphasizes the development of biologic drugs and biosimilars while pursuing collaborations with other biotech firms to enhance its rare disease offerings and expand market reach.
Biogen: Biogen, headquartered in Massachusetts, specializes in neuroscience and has a robust pipeline of treatments for rare neurological diseases, including spinal muscular atrophy (SMA). Their strategy includes a strong focus on gene therapy and investing in research collaborations to expedite the development of novel therapies while maintaining a commitment to improving patient lives.
Vertex Pharmaceuticals: Vertex, located in Boston, USA, is known for its groundbreaking treatments for cystic fibrosis. The company’s focus on genetic diseases allows it to develop innovative, disease-modifying therapies. Vertex's strategy includes investing in R&D and expanding its portfolio through collaborations and acquisitions, with a commitment to delivering transformative therapies to patients.
Alexion Pharmaceuticals: Alexion, a subsidiary of AstraZeneca, specializes in rare diseases, particularly in the field of complement inhibition. Their flagship product, Soliris, is used to treat conditions like paroxysmal nocturnal hemoglobinuria (PNH). Alexion's strategy revolves around innovative drug development and personalized medicine, aiming to enhance patient care through targeted therapies for rare diseases.
Eli Lilly and Company: Eli Lilly, based in Indiana, USA, develops a range of therapies, including treatments for rare endocrine disorders. Their product portfolio includes therapies like Cyramza and Trulicity. The company’s strategy focuses on precision medicine and utilizing cutting-edge research to drive innovation while expanding access to its rare disease treatments through patient support programs and partnerships.
Market Key Players
Roche
Novartis
Sanofi
GSK (GlaxoSmithKline)
Pfizer
Amgen
Biogen
Vertex Pharmaceuticals
Alexion Pharmaceuticals
Eli Lilly and Company
Bristol Myers Squibb
Merck & Co.
AbbVie
Regeneron Pharmaceuticals
Sarepta Therapeutics
Orchard Therapeutics
Bluebird Bio
Ultragenyx Pharmaceutical
Takeda Pharmaceuticals
AstraZeneca
Driver:
Increased Research and Development Investment
The rise in research and development (R&D) investment is a significant driver of the global rare disease treatment innovation market. Pharmaceutical companies and research institutions are increasingly allocating funds toward developing novel therapies for rare diseases due to growing recognition of the unmet medical needs in this area. R&D investments are essential for discovering and bringing to market effective treatments, especially for complex and genetically driven rare conditions. Moreover, initiatives by governments and regulatory bodies encouraging R&D for orphan drugs, such as tax incentives and fast-track approvals, further stimulate innovation. The continuous advancement in technologies, such as gene therapy and personalized medicine, bolstered by R&D investments, is expected to enhance treatment options and improve patient outcomes in the coming years.
Growing Patient Awareness and Advocacy
Increasing awareness among patients and healthcare professionals regarding rare diseases significantly drives market growth. As more individuals become educated about rare conditions and their treatment options, there is a higher demand for effective therapies. Patient advocacy groups play a crucial role in raising awareness, fostering support for research, and promoting the development of new treatments. These organizations often collaborate with pharmaceutical companies and regulatory agencies to enhance understanding of rare diseases and advocate for the rights of patients. Additionally, the proliferation of social media and online platforms facilitates information dissemination, connecting patients and families affected by rare diseases. This growing awareness not only drives demand for innovative therapies but also influences policy changes aimed at improving healthcare access and treatment availability.
Supportive Regulatory Environment
A supportive regulatory environment is crucial for the growth of the rare disease treatment innovation market. Regulatory bodies such as the U.S. Food and Drug Administration (FDA) and the European Medicines Agency (EMA) have established frameworks that incentivize the development of therapies for rare diseases, known as orphan drugs. These incentives include expedited review processes, market exclusivity, and financial subsidies, which encourage pharmaceutical companies to invest in research for rare conditions that may otherwise be overlooked. Such favorable regulations not only facilitate faster access to life-saving treatments for patients but also promote innovation within the industry. The ongoing commitment of regulatory agencies to support orphan drug development enhances the likelihood of successful product launches, thereby positively impacting market growth.
Restraints:
High Cost of Drug Development
One of the primary restraints affecting the rare disease treatment innovation market is the high cost associated with drug development. Developing therapies for rare diseases often requires extensive research, clinical trials, and regulatory approvals, which can be financially burdensome for pharmaceutical companies. These costs can be exacerbated by the need for specialized production processes and formulations tailored to small patient populations. The financial risks associated with developing orphan drugs may deter investment from companies, particularly smaller firms that lack the resources to absorb potential losses. As a result, the high cost of drug development may limit the number of new therapies entering the market, ultimately affecting patient access to effective treatments and stalling overall market growth.
Limited Patient Population
The limited patient population for rare diseases presents a significant challenge for the rare disease treatment innovation market. With fewer individuals affected by each specific rare condition, pharmaceutical companies may struggle to achieve economies of scale in drug development and distribution. This limited market size can lead to reduced revenue potential, making it difficult for companies to justify the high costs associated with bringing new therapies to market. Furthermore, the small patient population can complicate clinical trial recruitment, leading to longer timelines and increased costs. Consequently, the perceived financial risks associated with developing treatments for rare diseases may deter investment and innovation, ultimately restricting the availability of new therapies for patients in need.
Opportunities:
Advancements in Gene and Cell Therapy
Advancements in gene and cell therapy present a significant opportunity for growth within the rare disease treatment innovation market. These innovative therapeutic approaches offer the potential to address the underlying genetic causes of various rare diseases, providing more effective and targeted treatment options. As research in gene editing technologies, such as CRISPR, progresses, the feasibility of developing curative therapies for previously untreatable conditions becomes increasingly likely. The increasing number of clinical trials exploring gene and cell therapies also highlights the market's growth potential, with several products expected to receive regulatory approval in the coming years. This trend not only opens new revenue streams for pharmaceutical companies but also significantly improves treatment outcomes and quality of life for patients with rare diseases.
Expansion of Personalized Medicine
The expansion of personalized medicine is another significant opportunity for the rare disease treatment innovation market. As the understanding of individual genetic profiles and their relationship to disease improves, the development of tailored therapies is becoming more feasible. Personalized medicine allows for more precise treatment strategies that consider a patient’s unique genetic makeup, leading to better efficacy and reduced adverse effects. The increasing integration of genetic testing in clinical practice enables healthcare providers to identify rare diseases more accurately and select the most appropriate treatments. As advancements in biotechnology continue to evolve, personalized therapies are expected to gain traction in the rare disease market, improving patient outcomes and fostering innovative solutions to meet specific medical needs.
Trends:
Rising Focus on Collaborative Research
A notable trend in the rare disease treatment innovation market is the rising focus on collaborative research among stakeholders, including pharmaceutical companies, academic institutions, and patient advocacy groups. Collaborative efforts facilitate the sharing of knowledge, resources, and data, which is crucial for addressing the complexities of rare diseases. These partnerships often lead to the establishment of consortiums that work together to accelerate drug discovery and development. Additionally, collaborative research initiatives help streamline clinical trial processes, improve patient recruitment, and enhance the overall efficiency of bringing new therapies to market. This trend not only fosters innovation but also addresses the financial risks associated with rare disease treatment development, ultimately benefiting patients by increasing access to new and effective therapies.
Recent Development:
In February 2024: The FDA announced the establishment of a rare disease innovation hub aimed at expediting the development of new treatments. This initiative will facilitate connections between drug developers and the rare disease community, ultimately fostering collaboration and enhancing the efficiency of the drug development process.
In March 2024: ChromaDex Corporation and Sionna Therapeutics entered into a partnership focused on developing a novel resveratrol-based product targeting a rare disease. This collaboration combines ChromaDex's expertise in nutritional science with Sionna's focus on addressing unmet medical needs in rare diseases.