Global Raw, Fresh, & Frozen Dog Food Market Size, Share, Analysis By Food Type (Raw Food, Fresh Food, Frozen Food), By Breed Size (Small, Medium, Large), By Application (Dental Care, Digestive Health, Bone & Joint Support, Weight Management, Immune Support), By Flavor (Chicken, Beef, Lamb, Turkey, Fish), By Sales Channel (Online Retail, Pet Specialty Stores, Modern Trade) – Industry Trends & Forecast 2025–2034
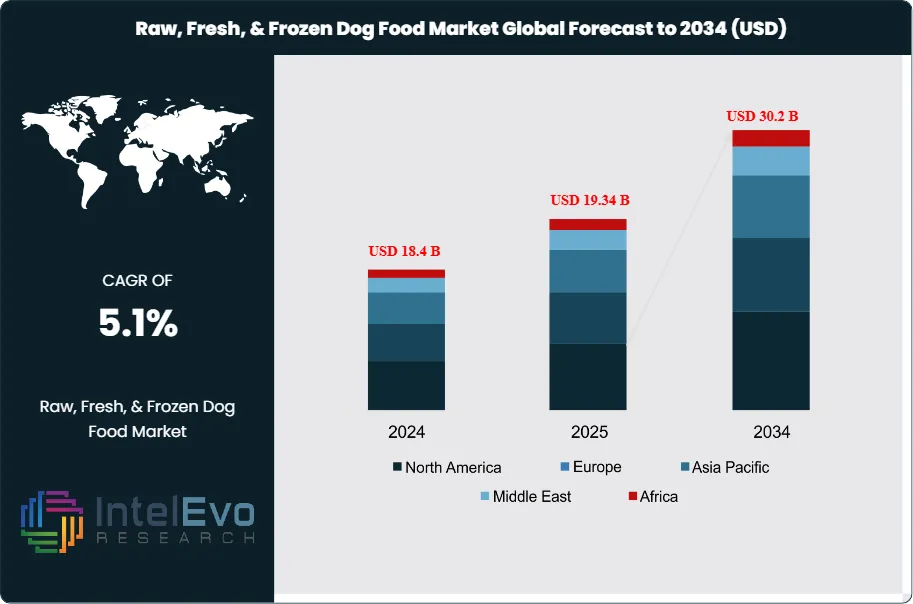
The Raw, Fresh, & Frozen Dog Food Market was valued at approximately USD 18.4 billion in 2024 and is projected to reach nearly USD 30.2 billion by 2034, reflecting steady expansion driven by rising pet humanization trends and demand for premium, natural pet nutrition products. Based on the projected growth trajectory, the market size for 2025 is estimated at around USD 19.34 billion. Beginning in 2026, the market is expected to grow at a compound annual growth rate (CAGR) of about 5.1% from 2026 to 2034, ultimately reaching an estimated valuation of approximately USD 30.2 billion by 2034.
Rising attachment to companion animals and the shift from mass-market kibble to human-grade formulas drive this expansion. Raw, fresh, and frozen formats sit at the premium end of canine nutrition and account for about 18–20% of global dog food revenues, with share expected to exceed 25% by 2034.
Demand comes from health-focused owners who link minimally processed meat- and vegetable-based recipes with better digestion, coat quality, and vitality. Around 71% of owners now regard pets as family members, which supports willingness to trade up despite price premiums of 30–70% versus conventional dry food. A global dog population of about 900 million provides a wide volume base that supports category penetration, particularly in emerging markets.
On the supply side, specialized brands and integrated meat processors expand chilled and frozen lines, invest in cold-chain logistics, and scale direct-to-consumer subscription models. The market remains fragmented, with the top five suppliers together holding less than 35% share. This structure encourages innovation around novel proteins, breed-specific formulas, and functional benefits such as digestive or joint support. AI-driven formulation and digital demand forecasting improve recipe design and inventory planning, while automation in packaging raises consistency and lowers unit costs.
Regulation tightens across North America and Europe as authorities enforce stricter standards on pathogen control, traceability, and labeling. These measures raise compliance costs but enhance trust and act as a barrier to informal producers. Key risks include cold-chain disruption, raw material price volatility, and debate over the safety of raw diets, which can trigger localized restrictions or recalls.
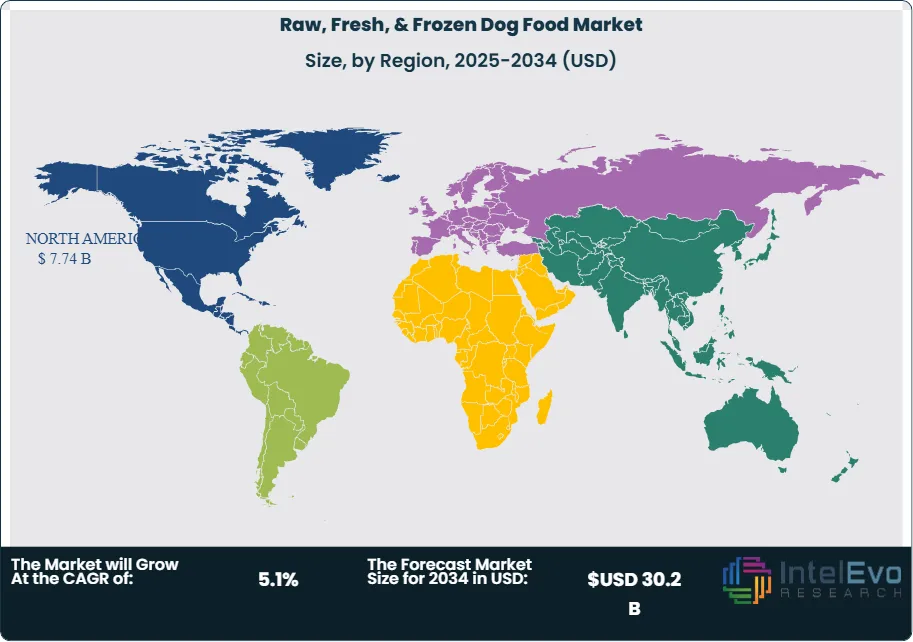
Regionally, North America represents roughly 35% of category revenues, supported by high spending per pet and mature retail and online channels. Europe contributes close to 30%, driven by rigorous oversight and preference for natural formulations. Asia Pacific is the fastest-growing region, with an estimated CAGR of 6.5% through 2034 as pet ownership climbs in China, India, and Southeast Asia and modern trade expands chilled shelf space. These dynamics position raw, fresh, and frozen dog food as a structurally attractive growth niche within global pet nutrition.
Key Takeaways
Market Growth: The Raw, Fresh, & Frozen Dog Food Market was valued at 17.5 billion USD, 2023 and is projected to reach USD 30.2 billion by 2034. This trajectory implies a 5.1% CAGR, 2026-2034.
Segment Dominance: Fresh Food led the food type segment with an estimated: 38.0% segment share, 2023 as owners prioritized visible ingredient quality. This share could rise to an estimated: 42.0% segment share, 2034 as premium formulations scale across retail and digital channels.
Segment Dominance: Medium Breeds accounted for an estimated: 40.0% volume share, 2023, making them the largest breed-size segment in the category. Digestive Care held an estimated: 35.0% revenue share, 2023, underscoring health-focused purchasing behavior.
Driver: Health-focused feeding behavior shapes demand, with digestive care needs influencing an estimated: 45.0% of purchase decisions, 2024. Preference for quality proteins such as chicken, the leading flavor, supports unit price premiums of an estimated: 15.0% above standard dry food, 2024.
Restraint: High product and logistics costs constrain penetration, as an estimated: 30.0% of owners, 2024 remain price-sensitive and retain conventional dry or wet formats. Cold-chain and frozen storage limitations restrict availability in an estimated: 25.0% of emerging-market retail outlets, 2024.
Opportunity: Online retailers, which led the channel mix in 2023, captured an estimated: 35.0% revenue share, 2023 by offering assortment depth and convenient fulfillment. Expanding e-commerce in emerging economies could add an estimated: 4.0 billion USD, 2034 in incremental sales over 2024-2034.
Trend: Digital platforms increasingly use recommendation engines and pet-profile data, with an estimated: 50.0% of online buyers, 2024 engaging with tailored feeding plans. Subscription-based deliveries in raw and fresh formats are set to grow at an estimated: 7.0% CAGR, 2024-2034 as convenience and reliability become core expectations.
Regional Analysis: North America likely holds an estimated: 40.0% revenue share, 2024 given high spending per pet and strong online penetration. Asia Pacific, led by China and India, is positioned to deliver an estimated: 6.0% CAGR, 2024-2034 as pet ownership and digital retail expand.
By Type
High-performance concrete, self-consolidating concrete, and other specialized mixes continue to gain traction as construction firms raise expectations for durability and workability. Demand in 2025 reflects a shift toward materials that improve placement efficiency and reduce labor requirements. High-performance concrete holds the largest share, supported by its ability to deliver high strength with lower permeability. Market participants report adoption rates above 40 percent across major infrastructure programs.
Self-consolidating concrete expands steadily as contractors seek mix designs that reduce vibration needs and improve surface finish. Its use grows in high-density projects and complex geometries where precision is critical. Other concrete types, including fiber-reinforced and lightweight variants, attract interest in regions with active housing development and climate-resilience mandates. These categories together signal broader movement toward materials that support efficient onsite execution and tighter project timelines.
Through 2030, demand remains influenced by rising investment in transport networks, data centers, and industrial parks. Material suppliers prepare for stricter regulatory expectations on embodied carbon, which may accelerate the shift toward advanced concrete formulations.
By Application
Pavers represent the largest application category as cities expand public spaces and non-motorized mobility infrastructure. Municipal programs in North America and Europe continue to upgrade pavements using high-durability concrete to reduce long-term maintenance. Retaining walls also see strong activity, supported by hillside development, flood-control upgrades, and logistics-facility expansion. Their annual demand rises in the Asia Pacific region where large-scale industrial zoning increases site-grading requirements.
Other applications—including precast components, utility structures, and building façades—demonstrate solid growth as offsite construction gains adoption. Manufacturers report higher orders for modular concrete units that shorten project cycles and improve quality control.
The application mix reflects priorities around resilience and lifecycle cost. Governments continue to fund structural reinforcements, while private developers invest in materials that maintain performance under heavier loads and frequent environmental stress.
By End-Use
Residential building activity benefits from recovering housing starts in 2025. Developers adopt advanced concrete formulations for foundations, structural frames, and exterior elements to improve energy performance and support multi-story designs. This segment accounts for more than one-third of market demand.
Commercial building remains the second-largest end-use category. Data centers, logistics hubs, and mixed-use developments all require materials with high load-bearing capacity and controlled shrinkage. Contractors in these projects increasingly specify high-performance and self-consolidating concrete to meet exacting structural requirements.
Industrial facilities display sustained demand as manufacturers expand capacity for electronics, pharmaceuticals, and automotive components. These projects rely on concrete solutions that withstand vibration, chemical exposure, and thermal stress. The industrial share grows notably in emerging markets as supply-chain diversification accelerates.
By Region
North America leads the global market due to strong investment in transportation upgrades, warehouse development, and urban revitalization. The United States accounts for the majority of regional demand, supported by multi-year federal funding packages for bridges, highways, and water systems. Canada follows with steady activity in residential construction and public infrastructure repair.
Europe maintains a significant share as countries prioritize climate-resilient structures and advance low-carbon construction programs. Adoption of high-performance mixes rises in Germany, France, and the Nordics, where regulations emphasize durability and reduced material waste.
Asia Pacific records the fastest growth. China, India, and Southeast Asia continue to expand industrial corridors, metro networks, and housing. Local suppliers scale production of specialized concrete types to meet increasing project complexity. Latin America and the Middle East & Africa show moderate but improving demand, driven by urban expansion, energy projects, and industrial diversification.
By Food Type (Raw Food, Fresh Food, Frozen Food), By Breed Size (Small Breeds, Medium Breeds, Large Breeds), By Application (Dental Care, Digestive Care, Bone and Joint Health, Weight Management, Immune Support, Energy and Muscle Support, Other Applications), By Flavor Type (Chicken, Beef, Lamb, Turkey, Fish, Other Flavors), By Sales Channel (Wholesalers and Distributors, Modern Trade, Convenience Stores, Pharmacy and Drug Stores, Online Retailers, Pet Specialty Stores, Other Sales Channels)
Research Methodology
Primary Research- 100 Interviews of Stakeholders
Secondary Research
Desk Research
Regional scope
North America (United States, Canada, Mexico)
Latin America (Brazil, Argentina, Columbia)
East Asia And Pacific (China, Japan, South Korea, Australia, Cambodia, Fiji, Indonesia)
Sea And South Asia (India, Singapore, Thailand, Taiwan, Malaysia)
Eastern Europe (Poland, Russia, Czech Republic, Romania)
Western Europe (Germany, U.K., France, Spain, Itlay)
Middle East & Africa (GCC Countries, Egypt, Nigeria, South Africa, Israel)
Competitive Landscape
The Farmers Dog, Vital Essentials, Smallbatch Pets, Nature’s Variety Instinct, K9 Natural, Primal Pet Foods, Stella & Chewy’s, BARF World, Raw Paws Pet Food, Steve’s Real Food, Ollie Pets, Darwin’s Natural Pet Products, Open Farm, Northwest Naturals, Answers Pet Food
Customization Scope
Customization for segments, region/country-level will be provided. Moreover, additional customization can be done based on the requirements.
Pricing and Purchase Options
Avail customized purchase options to meet your exact research needs. We have three licenses to opt for: Single User License, Multi-User License (Up to 5 Users), Corporate Use License (Unlimited User and Printable PDF).
TABLE OF CONTENTS
1. EXECUTIVE SUMMARY
1.1. MARKET SNAPSHOT
1.2. KEY FINDINGS & INSIGHTS
1.3. ANALYST RECOMMENDATIONS
1.4. FUTURE OUTLOOK
2. RESEARCH METHODOLOGY
2.1. MARKET DEFINITION & SCOPE
2.2. RESEARCH OBJECTIVES: PRIMARY & SECONDARY DATA SOURCES
2.3. DATA COLLECTION SOURCES
2.3.1. COVERAGE OF 100+ PRIMARY RESEARCH/CONSULTATION CALLS WITH INDUSTRY STAKEHOLDERS
FIGURE 17 NORTH AMERICA RAW, FRESH, AND FROZEN DOG FOODCURRENT AND FUTURE TYPE ANALYSIS, 2025–2034, (USD MILLION)
FIGURE 18 NORTH AMERICA RAW, FRESH, AND FROZEN DOG FOODCURRENT AND FUTURE END USER ANALYSIS, 2025–2034, (USD MILLION)
FIGURE 19 MARKET SHARE BY COUNTRY
FIGURE 20 LATIN AMERICA RAW, FRESH, AND FROZEN DOG FOODCURRENT AND FUTURE TYPE ANALYSIS, 2025–2034, (USD MILLION)
FIGURE 21 LATIN AMERICA RAW, FRESH, AND FROZEN DOG FOODCURRENT AND FUTURE END USER ANALYSIS, 2025–2034, (USD MILLION)
FIGURE 22 MARKET SHARE BY COUNTRY
FIGURE 23 EASTERN EUROPE RAW, FRESH, AND FROZEN DOG FOODCURRENT AND FUTURE TYPE ANALYSIS, 2025–2034, (USD MILLION)
FIGURE 24 EASTERN EUROPE RAW, FRESH, AND FROZEN DOG FOODCURRENT AND FUTURE END USER ANALYSIS, 2025–2034, (USD MILLION)
FIGURE 25 MARKET SHARE BY COUNTRY
FIGURE 26 WESTERN EUROPE RAW, FRESH, AND FROZEN DOG FOODCURRENT AND FUTURE TYPE ANALYSIS, 2025–2034, (USD MILLION)
FIGURE 27 WESTERN EUROPE RAW, FRESH, AND FROZEN DOG FOODCURRENT AND FUTURE END USER ANALYSIS, 2025–2034, (USD MILLION)
FIGURE 28 MARKET SHARE BY COUNTRY
FIGURE 29 EAST ASIA AND PACIFIC RAW, FRESH, AND FROZEN DOG FOODCURRENT AND FUTURE TYPE ANALYSIS, 2025–2034, (USD MILLION)
FIGURE 30 EAST ASIA AND PACIFIC RAW, FRESH, AND FROZEN DOG FOODCURRENT AND FUTURE END USER ANALYSIS, 2025–2034, (USD MILLION)
FIGURE 31 MARKET SHARE BY COUNTRY
FIGURE 32 SEA AND SOUTH ASIA RAW, FRESH, AND FROZEN DOG FOODCURRENT AND FUTURE TYPE ANALYSIS, 2025–2034, (USD MILLION)
FIGURE 33 SEA AND SOUTH ASIA RAW, FRESH, AND FROZEN DOG FOODCURRENT AND FUTURE END USER ANALYSIS, 2025–2034, (USD MILLION)
FIGURE 34 MARKET SHARE BY COUNTRY
FIGURE 35 MIDDLE EAST AND AFRICA RAW, FRESH, AND FROZEN DOG FOODCURRENT AND FUTURE TYPE ANALYSIS, 2025–2034, (USD MILLION)
FIGURE 36 MIDDLE EAST AND AFRICA RAW, FRESH, AND FROZEN DOG FOODCURRENT AND FUTURE END USER ANALYSIS, 2025–2034, (USD MILLION)
FIGURE 37 NORTH AMERICA RAW, FRESH, AND FROZEN DOG FOODCURRENT AND FUTURE MARKET VOLUME SHARE REGIONAL ANALYSIS, 2025–2034, (USD MILLION)
FIGURE 38 U.S. RAW, FRESH, AND FROZEN DOG FOODCURRENT AND FUTURE TYPE ANALYSIS, 2025–2034, (USD MILLION)
FIGURE 39 U.S. RAW, FRESH, AND FROZEN DOG FOODCURRENT AND FUTURE END USER ANALYSIS, 2025–2034, (USD MILLION)
FIGURE 40 CANADA RAW, FRESH, AND FROZEN DOG FOODCURRENT AND FUTURE TYPE ANALYSIS, 2025–2034, (USD MILLION)
FIGURE 41 CANADA RAW, FRESH, AND FROZEN DOG FOODCURRENT AND FUTURE END USER ANALYSIS, 2025–2034, (USD MILLION)
FIGURE 42 LATIN AMERICA RAW, FRESH, AND FROZEN DOG FOODCURRENT AND FUTURE MARKET VOLUME SHARE REGIONAL ANALYSIS, 2025–2034, (USD MILLION)
FIGURE 43 MEXICO RAW, FRESH, AND FROZEN DOG FOODCURRENT AND FUTURE TYPE ANALYSIS, 2025–2034, (USD MILLION)
FIGURE 44 MEXICO RAW, FRESH, AND FROZEN DOG FOODCURRENT AND FUTURE END USER ANALYSIS, 2025–2034, (USD MILLION)
FIGURE 45 BRAZIL RAW, FRESH, AND FROZEN DOG FOODCURRENT AND FUTURE TYPE ANALYSIS, 2025–2034, (USD MILLION)
FIGURE 46 BRAZIL RAW, FRESH, AND FROZEN DOG FOODCURRENT AND FUTURE END USER ANALYSIS, 2025–2034, (USD MILLION)
FIGURE 47 ARGENTINA RAW, FRESH, AND FROZEN DOG FOODCURRENT AND FUTURE TYPE ANALYSIS, 2025–2034, (USD MILLION)
FIGURE 48 ARGENTINA RAW, FRESH, AND FROZEN DOG FOODCURRENT AND FUTURE END USER ANALYSIS, 2025–2034, (USD MILLION)
FIGURE 49 COLUMBIA RAW, FRESH, AND FROZEN DOG FOODCURRENT AND FUTURE TYPE ANALYSIS, 2025–2034, (USD MILLION)
FIGURE 50 COLUMBIA RAW, FRESH, AND FROZEN DOG FOODCURRENT AND FUTURE END USER ANALYSIS, 2025–2034, (USD MILLION)
FIGURE 51 REST OF LATIN AMERICA RAW, FRESH, AND FROZEN DOG FOODCURRENT AND FUTURE TYPE ANALYSIS, 2025–2034, (USD MILLION)
FIGURE 52 REST OF LATIN AMERICA RAW, FRESH, AND FROZEN DOG FOODCURRENT AND FUTURE END USER ANALYSIS, 2025–2034, (USD MILLION)
FIGURE 53 EASTERN EUROPE RAW, FRESH, AND FROZEN DOG FOODCURRENT AND FUTURE MARKET VOLUME SHARE REGIONAL ANALYSIS, 2025–2034, (USD MILLION)
FIGURE 54 POLAND RAW, FRESH, AND FROZEN DOG FOODCURRENT AND FUTURE TYPE ANALYSIS, 2025–2034, (USD MILLION)
FIGURE 55 POLAND RAW, FRESH, AND FROZEN DOG FOODCURRENT AND FUTURE END USER ANALYSIS, 2025–2034, (USD MILLION)
FIGURE 56 RUSSIA RAW, FRESH, AND FROZEN DOG FOODCURRENT AND FUTURE TYPE ANALYSIS, 2025–2034, (USD MILLION)
FIGURE 57 RUSSIA RAW, FRESH, AND FROZEN DOG FOODCURRENT AND FUTURE END USER ANALYSIS, 2025–2034, (USD MILLION)
FIGURE 58 CZECH REPUBLIC RAW, FRESH, AND FROZEN DOG FOODCURRENT AND FUTURE TYPE ANALYSIS, 2025–2034, (USD MILLION)
FIGURE 59 CZECH REPUBLIC RAW, FRESH, AND FROZEN DOG FOODCURRENT AND FUTURE END USER ANALYSIS, 2025–2034, (USD MILLION)
FIGURE 60 ROMANIA RAW, FRESH, AND FROZEN DOG FOODCURRENT AND FUTURE TYPE ANALYSIS, 2025–2034, (USD MILLION)
FIGURE 61 ROMANIA RAW, FRESH, AND FROZEN DOG FOODCURRENT AND FUTURE END USER ANALYSIS, 2025–2034, (USD MILLION)
FIGURE 62 REST OF EASTERN EUROPE RAW, FRESH, AND FROZEN DOG FOODCURRENT AND FUTURE TYPE ANALYSIS, 2025–2034, (USD MILLION)
FIGURE 63 REST OF EASTERN EUROPE RAW, FRESH, AND FROZEN DOG FOODCURRENT AND FUTURE END USER ANALYSIS, 2025–2034, (USD MILLION)
FIGURE 64 WESTERN EUROPE RAW, FRESH, AND FROZEN DOG FOODCURRENT AND FUTURE MARKET VOLUME SHARE REGIONAL ANALYSIS, 2025–2034, (USD MILLION)
FIGURE 65 GERMANY RAW, FRESH, AND FROZEN DOG FOODCURRENT AND FUTURE TYPE ANALYSIS, 2025–2034, (USD MILLION)
FIGURE 66 GERMANY RAW, FRESH, AND FROZEN DOG FOODCURRENT AND FUTURE END USER ANALYSIS, 2025–2034, (USD MILLION)
FIGURE 67 FRANCE RAW, FRESH, AND FROZEN DOG FOODCURRENT AND FUTURE TYPE ANALYSIS, 2025–2034, (USD MILLION)
FIGURE 68 FRANCE RAW, FRESH, AND FROZEN DOG FOODCURRENT AND FUTURE END USER ANALYSIS, 2025–2034, (USD MILLION)
FIGURE 69 UK RAW, FRESH, AND FROZEN DOG FOODCURRENT AND FUTURE TYPE ANALYSIS, 2025–2034, (USD MILLION)
FIGURE 70 UK RAW, FRESH, AND FROZEN DOG FOODCURRENT AND FUTURE END USER ANALYSIS, 2025–2034, (USD MILLION)
FIGURE 71 SPAIN RAW, FRESH, AND FROZEN DOG FOODCURRENT AND FUTURE TYPE ANALYSIS, 2025–2034, (USD MILLION)
FIGURE 72 SPAIN RAW, FRESH, AND FROZEN DOG FOODCURRENT AND FUTURE END USER ANALYSIS, 2025–2034, (USD MILLION)
FIGURE 73 ITALY RAW, FRESH, AND FROZEN DOG FOODCURRENT AND FUTURE TYPE ANALYSIS, 2025–2034, (USD MILLION)
FIGURE 74 ITALY RAW, FRESH, AND FROZEN DOG FOODCURRENT AND FUTURE END USER ANALYSIS, 2025–2034, (USD MILLION)
FIGURE 75 REST OF WESTERN EUROPE RAW, FRESH, AND FROZEN DOG FOODCURRENT AND FUTURE TYPE ANALYSIS, 2025–2034, (USD MILLION)
FIGURE 76 REST OF WESTERN EUROPE RAW, FRESH, AND FROZEN DOG FOODCURRENT AND FUTURE END USER ANALYSIS, 2025–2034, (USD MILLION)
FIGURE 77 EAST ASIA AND PACIFIC RAW, FRESH, AND FROZEN DOG FOODCURRENT AND FUTURE MARKET VOLUME SHARE REGIONAL ANALYSIS, 2025–2034, (USD MILLION)
FIGURE 78 CHINA RAW, FRESH, AND FROZEN DOG FOODCURRENT AND FUTURE TYPE ANALYSIS, 2025–2034, (USD MILLION)
FIGURE 79 CHINA RAW, FRESH, AND FROZEN DOG FOODCURRENT AND FUTURE END USER ANALYSIS, 2025–2034, (USD MILLION)
FIGURE 80 JAPAN RAW, FRESH, AND FROZEN DOG FOODCURRENT AND FUTURE TYPE ANALYSIS, 2025–2034, (USD MILLION)
FIGURE 81 JAPAN RAW, FRESH, AND FROZEN DOG FOODCURRENT AND FUTURE END USER ANALYSIS, 2025–2034, (USD MILLION)
FIGURE 82 AUSTRALIA RAW, FRESH, AND FROZEN DOG FOODCURRENT AND FUTURE TYPE ANALYSIS, 2025–2034, (USD MILLION)
FIGURE 83 AUSTRALIA RAW, FRESH, AND FROZEN DOG FOODCURRENT AND FUTURE END USER ANALYSIS, 2025–2034, (USD MILLION)
FIGURE 84 CAMBODIA RAW, FRESH, AND FROZEN DOG FOODCURRENT AND FUTURE TYPE ANALYSIS, 2025–2034, (USD MILLION)
FIGURE 85 CAMBODIA RAW, FRESH, AND FROZEN DOG FOODCURRENT AND FUTURE END USER ANALYSIS, 2025–2034, (USD MILLION)
FIGURE 86 FIJI RAW, FRESH, AND FROZEN DOG FOODCURRENT AND FUTURE TYPE ANALYSIS, 2025–2034, (USD MILLION)
FIGURE 87 FIJI RAW, FRESH, AND FROZEN DOG FOODCURRENT AND FUTURE END USER ANALYSIS, 2025–2034, (USD MILLION)
FIGURE 88 INDONESIA RAW, FRESH, AND FROZEN DOG FOODCURRENT AND FUTURE TYPE ANALYSIS, 2025–2034, (USD MILLION)
FIGURE 89 INDONESIA RAW, FRESH, AND FROZEN DOG FOODCURRENT AND FUTURE END USER ANALYSIS, 2025–2034, (USD MILLION)
FIGURE 90 SOUTH KOREA RAW, FRESH, AND FROZEN DOG FOODCURRENT AND FUTURE TYPE ANALYSIS, 2025–2034, (USD MILLION)
FIGURE 91 SOUTH KOREA RAW, FRESH, AND FROZEN DOG FOODCURRENT AND FUTURE END USER ANALYSIS, 2025–2034, (USD MILLION)
FIGURE 92 REST OF EAST ASIA AND PACIFIC RAW, FRESH, AND FROZEN DOG FOODCURRENT AND FUTURE TYPE ANALYSIS, 2025–2034, (USD MILLION)
FIGURE 93 REST OF EAST ASIA AND PACIFIC RAW, FRESH, AND FROZEN DOG FOODCURRENT AND FUTURE END USER ANALYSIS, 2025–2034, (USD MILLION)
FIGURE 94 SEA AND SOUTH ASIA RAW, FRESH, AND FROZEN DOG FOODCURRENT AND FUTURE MARKET VOLUME SHARE REGIONAL ANALYSIS, 2025–2034, (USD MILLION)
FIGURE 95 BANGLADESH RAW, FRESH, AND FROZEN DOG FOODCURRENT AND FUTURE TYPE ANALYSIS, 2025–2034, (USD MILLION)
FIGURE 96 BANGLADESH RAW, FRESH, AND FROZEN DOG FOODCURRENT AND FUTURE END USER ANALYSIS, 2025–2034, (USD MILLION)
FIGURE 97 NEW ZEALAND RAW, FRESH, AND FROZEN DOG FOODCURRENT AND FUTURE TYPE ANALYSIS, 2025–2034, (USD MILLION)
FIGURE 98 NEW ZEALAND RAW, FRESH, AND FROZEN DOG FOODCURRENT AND FUTURE END USER ANALYSIS, 2025–2034, (USD MILLION)
FIGURE 99 INDIA RAW, FRESH, AND FROZEN DOG FOODCURRENT AND FUTURE TYPE ANALYSIS, 2025–2034, (USD MILLION)
FIGURE 100 INDIA RAW, FRESH, AND FROZEN DOG FOODCURRENT AND FUTURE END USER ANALYSIS, 2025–2034, (USD MILLION)
FIGURE 101 SINGAPORE RAW, FRESH, AND FROZEN DOG FOODCURRENT AND FUTURE TYPE ANALYSIS, 2025–2034, (USD MILLION)
FIGURE 102 SINGAPORE RAW, FRESH, AND FROZEN DOG FOODCURRENT AND FUTURE END USER ANALYSIS, 2025–2034, (USD MILLION)
FIGURE 103 THAILAND RAW, FRESH, AND FROZEN DOG FOODCURRENT AND FUTURE TYPE ANALYSIS, 2025–2034, (USD MILLION)
FIGURE 104 THAILAND RAW, FRESH, AND FROZEN DOG FOODCURRENT AND FUTURE END USER ANALYSIS, 2025–2034, (USD MILLION)
FIGURE 105 TAIWAN RAW, FRESH, AND FROZEN DOG FOODCURRENT AND FUTURE TYPE ANALYSIS, 2025–2034, (USD MILLION)
FIGURE 106 TAIWAN RAW, FRESH, AND FROZEN DOG FOODCURRENT AND FUTURE END USER ANALYSIS, 2025–2034, (USD MILLION)
FIGURE 107 MALAYSIA RAW, FRESH, AND FROZEN DOG FOODCURRENT AND FUTURE TYPE ANALYSIS, 2025–2034, (USD MILLION)
FIGURE 108 MALAYSIA RAW, FRESH, AND FROZEN DOG FOODCURRENT AND FUTURE END USER ANALYSIS, 2025–2034, (USD MILLION)
FIGURE 109 REST OF SEA AND SOUTH ASIA RAW, FRESH, AND FROZEN DOG FOODCURRENT AND FUTURE TYPE ANALYSIS, 2025–2034, (USD MILLION)
FIGURE 110 REST OF SEA AND SOUTH ASIA RAW, FRESH, AND FROZEN DOG FOODCURRENT AND FUTURE END USER ANALYSIS, 2025–2034, (USD MILLION)
FIGURE 111 MIDDLE EAST AND AFRICA RAW, FRESH, AND FROZEN DOG FOODCURRENT AND FUTURE MARKET VOLUME SHARE REGIONAL ANALYSIS, 2025–2034, (USD MILLION)
FIGURE 112 GCC COUNTRIES RAW, FRESH, AND FROZEN DOG FOODCURRENT AND FUTURE TYPE ANALYSIS, 2025–2034, (USD MILLION)
FIGURE 113 GCC COUNTRIES RAW, FRESH, AND FROZEN DOG FOODCURRENT AND FUTURE END USER ANALYSIS, 2025–2034, (USD MILLION)
FIGURE 114 SAUDI ARABIA RAW, FRESH, AND FROZEN DOG FOODCURRENT AND FUTURE TYPE ANALYSIS, 2025–2034, (USD MILLION)
FIGURE 115 SAUDI ARABIA RAW, FRESH, AND FROZEN DOG FOODCURRENT AND FUTURE END USER ANALYSIS, 2025–2034, (USD MILLION)
FIGURE 116 UAE RAW, FRESH, AND FROZEN DOG FOODCURRENT AND FUTURE TYPE ANALYSIS, 2025–2034, (USD MILLION)
FIGURE 117 UAE RAW, FRESH, AND FROZEN DOG FOODCURRENT AND FUTURE END USER ANALYSIS, 2025–2034, (USD MILLION)
FIGURE 118 BAHRAIN RAW, FRESH, AND FROZEN DOG FOODCURRENT AND FUTURE TYPE ANALYSIS, 2025–2034, (USD MILLION)
FIGURE 119 BAHRAIN RAW, FRESH, AND FROZEN DOG FOODCURRENT AND FUTURE END USER ANALYSIS, 2025–2034, (USD MILLION)
FIGURE 120 KUWAIT RAW, FRESH, AND FROZEN DOG FOODCURRENT AND FUTURE TYPE ANALYSIS, 2025–2034, (USD MILLION)
FIGURE 121 KUWAIT RAW, FRESH, AND FROZEN DOG FOODCURRENT AND FUTURE END USER ANALYSIS, 2025–2034, (USD MILLION)
FIGURE 122 OMAN RAW, FRESH, AND FROZEN DOG FOODCURRENT AND FUTURE TYPE ANALYSIS, 2025–2034, (USD MILLION)
FIGURE 123 OMAN RAW, FRESH, AND FROZEN DOG FOODCURRENT AND FUTURE END USER ANALYSIS, 2025–2034, (USD MILLION)
FIGURE 124 QATAR RAW, FRESH, AND FROZEN DOG FOODCURRENT AND FUTURE TYPE ANALYSIS, 2025–2034, (USD MILLION)
FIGURE 125 QATAR RAW, FRESH, AND FROZEN DOG FOODCURRENT AND FUTURE END USER ANALYSIS, 2025–2034, (USD MILLION)
FIGURE 126 EGYPT RAW, FRESH, AND FROZEN DOG FOODCURRENT AND FUTURE TYPE ANALYSIS, 2025–2034, (USD MILLION)
FIGURE 127 EGYPT RAW, FRESH, AND FROZEN DOG FOODCURRENT AND FUTURE END USER ANALYSIS, 2025–2034, (USD MILLION)
FIGURE 128 NIGERIA RAW, FRESH, AND FROZEN DOG FOODCURRENT AND FUTURE TYPE ANALYSIS, 2025–2034, (USD MILLION)
FIGURE 129 NIGERIA RAW, FRESH, AND FROZEN DOG FOODCURRENT AND FUTURE END USER ANALYSIS, 2025–2034, (USD MILLION)
FIGURE 130 SOUTH AFRICA RAW, FRESH, AND FROZEN DOG FOODCURRENT AND FUTURE TYPE ANALYSIS, 2025–2034, (USD MILLION)
FIGURE 131 SOUTH AFRICA RAW, FRESH, AND FROZEN DOG FOODCURRENT AND FUTURE END USER ANALYSIS, 2025–2034, (USD MILLION)
FIGURE 132 ISRAEL RAW, FRESH, AND FROZEN DOG FOODCURRENT AND FUTURE TYPE ANALYSIS, 2025–2034, (USD MILLION)
FIGURE 133 ISRAEL RAW, FRESH, AND FROZEN DOG FOODCURRENT AND FUTURE END USER ANALYSIS, 2025–2034, (USD MILLION)
FIGURE 134 REST OF MEA RAW, FRESH, AND FROZEN DOG FOODCURRENT AND FUTURE TYPE ANALYSIS, 2025–2034, (USD MILLION)
FIGURE 135 REST OF MEA RAW, FRESH, AND FROZEN DOG FOODCURRENT AND FUTURE END USER ANALYSIS, 2025–2034, (USD MILLION)
FIGURE 136 U. S. MARKET SHARE ANALYSIS BY TYPE (2024)
FIGURE 137 U. S. MARKET SHARE ANALYSIS BY END USER (2024)
FIGURE 138 CANADA MARKET SHARE ANALYSIS BY TYPE (2024)
FIGURE 139 CANADA MARKET SHARE ANALYSIS BY END USER (2024)
FIGURE 140 MEXICO MARKET SHARE ANALYSIS BY TYPE (2024)
FIGURE 141 MEXICO MARKET SHARE ANALYSIS BY END USER (2024)
FIGURE 142 CHINA MARKET SHARE ANALYSIS BY TYPE (2024)
FIGURE 143 CHINA MARKET SHARE ANALYSIS BY END USER (2024)
FIGURE 144 JAPAN MARKET SHARE ANALYSIS BY TYPE (2024)
FIGURE 145 JAPAN MARKET SHARE ANALYSIS BY END USER (2024)
FIGURE 146 INDIA MARKET SHARE ANALYSIS BY TYPE (2024)
FIGURE 147 INDIA MARKET SHARE ANALYSIS BY END USER (2024)
FIGURE 148 SOUTH KOREA MARKET SHARE ANALYSIS BY TYPE (2024)
FIGURE 149 SOUTH KOREA MARKET SHARE ANALYSIS BY END USER (2024)
FIGURE 150 SAUDI ARABIA MARKET SHARE ANALYSIS BY TYPE (2024)
FIGURE 151 SAUDI ARABIA MARKET SHARE ANALYSIS BY END USER (2024)
FIGURE 152 UAE MARKET SHARE ANALYSIS BY TYPE (2024)
FIGURE 153 UAE MARKET SHARE ANALYSIS BY END USER (2024)
FIGURE 154 EGYPT MARKET SHARE ANALYSIS BY TYPE (2024)
FIGURE 155 EGYPT MARKET SHARE ANALYSIS BY END USER (2024)
FIGURE 156 NIGERIA MARKET SHARE ANALYSIS BY TYPE (2024)
FIGURE 157 NIGERIA MARKET SHARE ANALYSIS BY END USER (2024)
FIGURE 158 SOUTH AFRICA MARKET SHARE ANALYSIS BY TYPE (2024)
FIGURE 159 SOUTH AFRICA MARKET SHARE ANALYSIS BY END USER (2024)
FIGURE 160 GERMANY MARKET SHARE ANALYSIS BY TYPE (2024)
FIGURE 161 GERMANY MARKET SHARE ANALYSIS BY END USER (2024)
FIGURE 162 FRANCE MARKET SHARE ANALYSIS BY TYPE (2024)
FIGURE 163 FRANCE MARKET SHARE ANALYSIS BY END USER (2024)
FIGURE 164 UK MARKET SHARE ANALYSIS BY TYPE (2024)
FIGURE 165 UK MARKET SHARE ANALYSIS BY END USER (2024)
FIGURE 166 SPAIN MARKET SHARE ANALYSIS BY TYPE (2024)
FIGURE 167 SPAIN MARKET SHARE ANALYSIS BY END USER (2024)
FIGURE 168 ITALY MARKET SHARE ANALYSIS BY TYPE (2024)
FIGURE 169 ITALY MARKET SHARE ANALYSIS BY END USER (2024)
FIGURE 170 BRAZIL MARKET SHARE ANALYSIS BY TYPE (2024)
FIGURE 171 BRAZIL MARKET SHARE ANALYSIS BY END USER (2024)
FIGURE 172 ARGENTINA MARKET SHARE ANALYSIS BY TYPE (2024)
FIGURE 173 ARGENTINA MARKET SHARE ANALYSIS BY END USER (2024)
FIGURE 174 COLUMBIA MARKET SHARE ANALYSIS BY TYPE (2024)
FIGURE 175 COLUMBIA MARKET SHARE ANALYSIS BY END USER (2024)
FIGURE 176 GLOBAL RAW, FRESH, AND FROZEN DOG FOODCURRENT AND FUTURE MARKET KEY COUNTRY LEVEL ANALYSIS, 2024–2034, (USD MILLION)
FIGURE 177 FINANCIAL OVERVIEW:
Key Player Analysis
Primal Pet Foods: Primal Pet Foods positions itself as a category leader in raw and frozen dog food, with more than two decades of focus on minimally processed, meat-rich diets for dogs and cats. The brand sits at the premium end of the global raw pet food segment, which is forecast to grow from about USD 2.3 billion in 2024 to roughly USD 5.8 billion by 2034 at close to 9.6 percent CAGR. Its portfolio spans frozen raw patties and nuggets, freeze-dried formulas, raw meaty bones, bone broth, and goat milk toppers, enabling the company to participate across both complete-and-balanced meals and functional add-ons. In 2024, the business refreshed packaging across frozen and freeze-dried lines to improve shelf impact and product navigation in specialty retail freezers, which supports trade execution as competition for limited freezer space intensifies.
Strategically, Primal Pet Foods invests in food safety controls, research-backed claims, and consumer education, which mitigate risk perceptions around raw diets and support premium pricing. Integration into Primal Pet Group, alongside chews and complementary products, provides cross-category visibility and a broader revenue base. The company uses digital channels and CRM programs to build repeat purchase behavior and to encourage cross-selling of toppers and treats. This positions Primal as a preferred partner for independent pet stores and specialty chains that seek higher-margin, premium assortments within the fast-growing raw, fresh, and frozen segment
Nature’s Variety Instinct: Nature’s Variety Instinct acts as a global challenger with strong brand recognition in raw and raw-inclusive dog food, particularly in North America. The company offers frozen raw, freeze-dried raw, and hybrid formats such as Raw Boost, which combines kibble with freeze-dried raw pieces and targets owners who want to upgrade from conventional dry food without fully switching format. Instinct operates as a standalone business within the Agrolimen group, with headquarters in St. Louis and raw production in Lincoln, Nebraska, enabling tight control of sourcing and processing.
Recent strategy focuses on capacity expansion and sustainability. A multi-phase investment project of roughly USD 100 million in Lincoln improves manufacturing efficiency and supports higher output for raw formats in the United States and export markets. The brand promotes food safety and quality controls to address concerns about raw diets, while its presence on key platforms such as Petco, PetSmart, Chewy, and specialty stores secures broad distribution. Instinct also uses digital education tools for veterinarians and pet owners, positioning the brand as a technical reference point for raw feeding. This mix of scale, multi-channel reach, and strong parent backing supports its role as a core competitor in the raw, fresh, and frozen dog food landscape.
Steve’s Real Food: Steve’s Real Food sits in the niche player segment with a strong following among raw-feeding enthusiasts and independent pet retailers. Founded in 1998, it markets itself as one of the earliest commercial raw pet food producers, with a portfolio that includes frozen raw dog and cat food, freeze-dried diets, prey-model formulations, toppers, and treats. The company emphasizes whole-food ingredients, responsible sourcing from local farms, and recipes that meet AAFCO standards without reliance on synthetic vitamin premixes, a positioning that appeals to owners seeking simple, transparent formulations.
From a strategic perspective, Steve’s Real Food remains privately held and unfunded, which keeps decision-making centralized and supports a focus on specialty and independent channels rather than mass retail. The brand uses education-led marketing on raw feeding, including calculators, transition guides, and food-safety content, to reduce barriers for first-time raw buyers and to increase feeding frequency per household.Its environmental messaging and emphasis on local sourcing align with broader sustainability priorities in 2025, helping the company defend its niche against larger multinational brands entering the raw, fresh, and frozen dog food segment.
Market Key Players
The Farmers Dog
Vital Essentials
Smallbatch Pets
Nature’s Variety Instinct
K9 Natural
Primal Pet Foods
Stella & Chewy’s
BARF World
Raw Paws Pet Food
Steve’s Real Food
Ollie Pets
Darwin’s Natural Pet Products
Open Farm
Northwest Naturals
Answers Pet Food
Driver:
Rising Pet Humanization Drives Premium Diet Adoption
Growing pet ownership in 2025 continues to lift demand for raw, fresh, and frozen dog food. Urban households show higher adoption rates, and more than 70 percent of new pet owners report seeking nutrition that aligns with human-grade food preferences. This shift raises expectations for minimally processed diets that support digestion, immunity, and long-term health. As a result, premium formats gain traction across North America, Europe, and advanced Asia Pacific markets.
Ingredient Transparency and Health Focus Strengthen Brand Loyalty
Health awareness reinforces this trajectory. Owners now scrutinize ingredient lists and avoid fillers, prompting a steady shift to fresh proteins and natural formulations. Brands that demonstrate measurable nutritional outcomes build stronger loyalty and command higher price points. The market benefits from this behavior, with premium segments expected to grow at a rate above the overall industry CAGR of roughly 5 percent through 2030.
Restraint:
High Production and Cold-Chain Costs Limit Accessibility
High product and logistics costs remain a material constraint for the category. Raw and fresh diets require temperature-controlled production, storage, and last-mile delivery. These requirements add cost layers that elevate price points by 30 to 60 percent relative to conventional kibble. As inflation pressures persist, price sensitivity rises among mid-income households, narrowing the immediate addressable market.
Infrastructure Gaps and Safety Concerns Slow Conversion
Shelf life and infrastructure gaps add further limitations. Many regions outside North America and Western Europe lack reliable cold-chain systems, which restricts distribution and reduces product consistency. Limited consumer education also plays a role. A portion of owners remain unsure about the safety and nutritional relevance of raw formats, slowing conversion and prolonging reliance on traditional dry food.
Opportunity:
E-Commerce and Subscription Models Expand Market Reach
Online commerce creates the strongest expansion path for 2025 and beyond. Digital platforms allow brands to scale rapidly and bypass retail shelf constraints. Subscription programs now account for more than 25 percent of online category revenue and deliver predictable volumes for manufacturers. These models also support customized formulations that meet breed-specific or condition-specific needs.
Preservation Technologies and Veterinary Partnerships Boost Adoption
Advances in preservation improve the commercial viability of premium diets. Freeze-drying and vacuum technologies extend shelf life without compromising nutrient quality. Companies that integrate these processes can target emerging markets with less dependence on cold-chain networks. Partnerships with veterinary groups strengthen product credibility and accelerate adoption, especially as clinics recommend premium diets for weight control, digestive support, and allergy management.
Trend:
Personalized Nutrition Shapes Premium Demand
Personalized nutrition emerges as a defining trend in 2025. Owners seek tailored solutions based on age, activity level, sensitivities, and medical conditions. Brands use digital assessments to design portion plans and ingredient mixes. This trend aligns with growing demand for predictability in health outcomes and encourages repeat purchases.
Freeze-Dried Formats and Sustainable Packaging Gain Traction
Freeze-dried formats gain momentum as consumers look for high-nutrient options without refrigeration requirements. Sustainability also influences purchasing decisions. Brands adopting recyclable or compostable packaging see stronger engagement among younger owners who expect environmentally responsible products. Together, these trends push the market toward premium, customizable, and environmentally conscious offerings.
Recent Developments
Dec 2024 – Primal Pet Foods: Primal Pet Foods introduced a new packaging system for its freeze-dried and frozen raw recipes, treats, hydrators, and toppers for dogs and cats, designed to standardize branding and improve product navigation in freezers and on shelves across specialty retail. The move strengthens Primal’s in-store visibility and supports retail partners as competition for limited cold-chain shelf space increases.
Feb 2025 – Freshpet Inc.: Freshpet reported full-year 2024 net sales of approximately USD 1.0 billion, up about 22 percent year on year, and used its February 2025 earnings call to confirm the start-up of additional roll lines across its network and guide for around 13 percent net sales growth in 2025. This capacity and revenue expansion solidifies Freshpet’s position as the leading fresh-refrigerated pet food supplier and raises the bar for scale and operational efficiency in chilled formats.
Apr 2025 – Primal Pet Foods: In April 2025, Primal expanded its Kibble in the Raw platform with three new cat recipes, combining raw nutrition with dry format convenience and launching in multiple bag sizes to support trade-up from conventional kibble. The extension broadens Primal’s participation in hybrid raw segments and reinforces its role as a key formulator in raw-inclusive pet diets.
Jul 2025 – The Farmer’s Dog: By July 2025, The Farmer’s Dog had secured total funding of about USD 103 million and was reported to generate more than USD 10 million in monthly profit on annualized revenue above USD 1 billion from its fresh, human-grade subscription meals.( This financial profile strengthens the company’s status as the leading direct-to-consumer fresh dog food brand and intensifies competitive pressure on traditional retail-led players.
Sep 2025 – Big Dog Pet Foods / Woolworths Group: In September 2025, Woolworths, through its Petspiration division, acquired a 50 percent stake in Australian raw pet food producer Big Dog Pet Foods, which manufactures around 7 million kilograms of BARF-style and allergy-friendly products annually and distributes through roughly 800 stores nationwide. The transaction deepens supermarket-backed participation in the raw segment and is likely to accelerate mainstream distribution and price competition for raw, fresh, and frozen dog food in Australia.