Global Real-Time Payment Infrastructure Market Size, Share | CAGR 24.9%
Global Real-Time Payment Infrastructure Market Size, Share & Industry Analysis By Component (Solutions and Services), By Deployment Mode (On-Premises, Cloud-Based and Hybrid), By End-User (BFSI, Retail & E-commerce, Telecommunications, Healthcare, Government & Public Sector, Travel & Hospitality, Utilities & Energy, Media & Entertainment, Transportation & Logistics, Manufacturing and Education), By Payment Type (P2P, P2B, B2B, B2C, G2P, P2G, Cross-Border and Merchant Payments) Region & Key Players – Market Dynamics, Competitive Strategies, Emerging Trends and Forecast 2026-2034
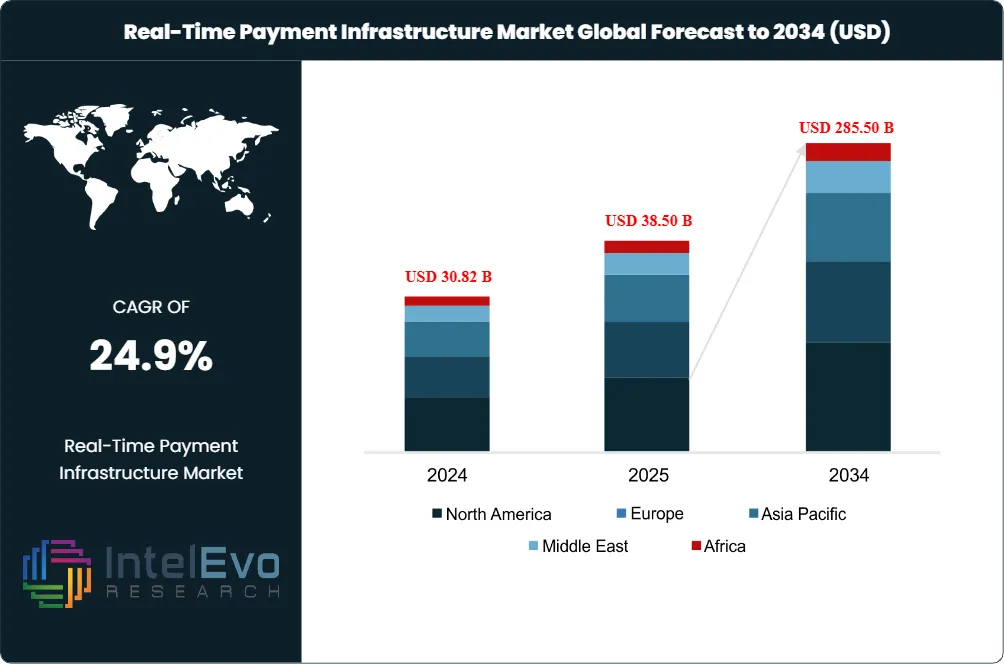
The Real-Time Payment Infrastructure Market was valued at USD 30.82 Billion in 2024 and USD 38.50 Billion in 2025. The market is projected to reach USD 285.50 Billion by 2034, expanding at a CAGR of 24.9% during the forecast period from 2026 to 2034. This represents an absolute dollar opportunity of USD 247.00 Billion over the analysis period. Real-time payment infrastructure encompasses the technology platforms, software solutions, payment gateways, fraud-management modules, and processing services that enable instantaneous account-to-account fund transfers with 24/7/365 settlement and immediate funds availability for the recipient. The infrastructure layer sits beneath consumer-facing applications and includes the core processing engines, ISO 20022 messaging stacks, fraud and sanctions screening systems, hybrid-cloud orchestration middleware, and bank-side connectivity that make instant settlement operationally viable at scale.
Cloud-hosted instances represented 62.12% of the real-time payment infrastructure market in 2025 and are advancing at a 26.35% CAGR through 2034, as SaaS adoption removes capital expenditure barriers and compresses launch timelines for mid-tier financial institutions. Banks and financial institutions generated 40.55% of 2025 revenue, while retail and e-commerce verticals are projected to grow at 30.15% annually as instant settlement strips interchange costs and elevates checkout conversion. ACI Worldwide reported 42% software-segment growth in Q1 2025, demonstrating that combinational platform-plus-professional-services deals resonate strongly with mid-tier institutions modernizing their payment stacks. The 2025 transaction volume globally exceeded 230 billion real-time payments, building on the 70.3 billion transactions processed in 2020 that ACI Worldwide reported and the 41% surge during the COVID-19 pandemic.
In the United States, the launch of FedNow alongside The Clearing House's RTP Network has reshaped the domestic infrastructure landscape. FedNow had over 900 institutions enrolled by end-2024, nearly double the RTP Network's base, reflecting trust in a government-operated 24/7/365 settlement system that posts directly against Federal Reserve master accounts and eliminates pre-funding and counterparty risk. In February 2025, the RTP Network raised its single-payment cap to USD 10 million, opening B2B use cases including real-estate closings and supplier finance. KeyBank alone expects 4 million RTP transactions in 2025. The U.S. Treasury mandate requires federal agencies to migrate to electronic disbursements by September 2025, guaranteeing a committed demand corridor. In July 2025, one leading U.S. RTP network reported processing over USD 481 billion in quarterly transactions, reflecting accelerating adoption of high-value instant payments.
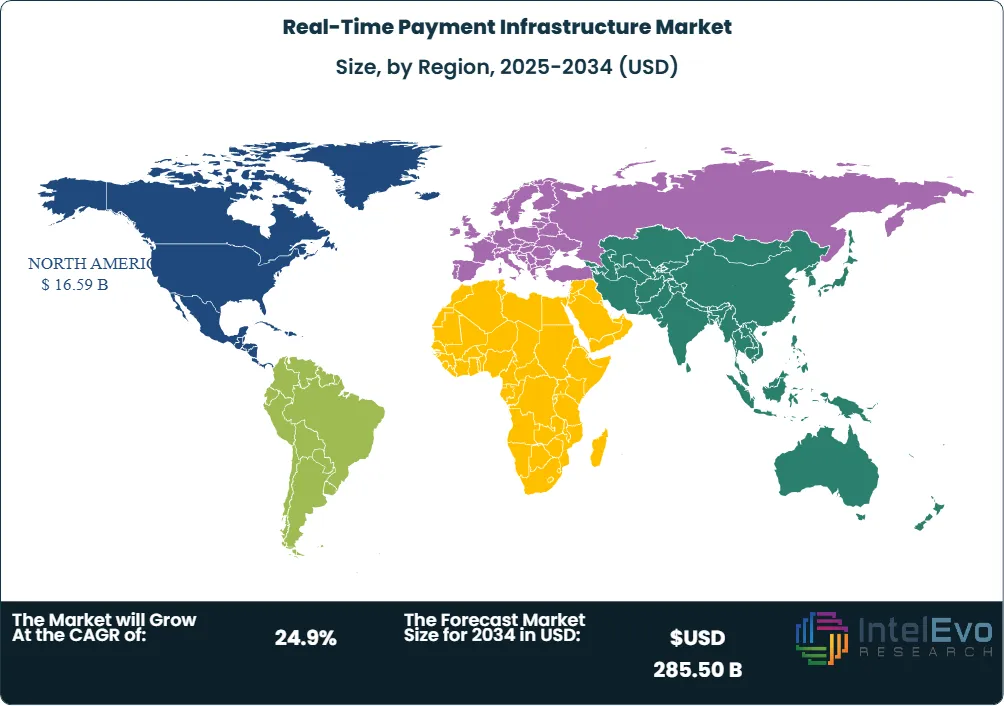
North America held 43.1% of the real-time payment infrastructure market in 2025 at approximately USD 16.59 Billion, driven by the parallel rollout of FedNow and RTP Network alongside Visa Direct, which in April 2025 enhanced payout speed to reach 99% of U.S. accounts in under one minute. Asia Pacific accounted for 31.2% at USD 12.01 Billion, dominated by India's UPI platform that processes the largest national share of global RTP transactions, alongside Thailand's PromptPay and Singapore's PayNow. Europe represented 17.8% at USD 6.85 Billion, anchored by the SEPA Instant Credit Transfer framework and Switzerland's mandate for full instant payments by 2026. Latin America at 5.4% (USD 2.08 Billion) is led by Brazil's PIX, where e-commerce merchants are projected to book USD 30 Billion in instant-payment turnover during 2025. Middle East and Africa held 2.5% at USD 963 million, supported by GCC government-to-person disbursement mandates.
Market Definition & Scope
The real-time payment infrastructure market is defined as the global commercial segment for technology platforms, software solutions, and processing services that enable instantaneous account-to-account fund transfers with immediate settlement and funds availability. The market encompasses payment gateways and processing engines (the core software that originates, validates, and clears RTP transactions); ISO 20022 messaging stacks (the standardized financial messaging format adopted globally for instant payments); fraud-management and sanctions-screening modules (real-time risk scoring, behavioral analytics, AI-driven anomaly detection); hybrid-cloud orchestration middleware (containerized microservices that run real-time and batch flows in parallel during legacy core migration); and bank-side connectivity infrastructure (Request-for-Payment routing, alias directories, settlement reconciliation).
This analysis includes both the solutions sold by independent software vendors (ACI Worldwide, Fiserv, FIS, Volante Technologies, Form3) to financial institutions, and the network operator services delivered by central infrastructure providers (FedNow, The Clearing House RTP Network, Mastercard's Vocalink, EBA Clearing's RT1). The report explicitly excludes consumer-facing wallet and money-transfer applications without proprietary processing infrastructure, traditional batch ACH and wire transfer systems with multi-day settlement, card scheme rails operating on deferred net settlement, and cryptocurrency or blockchain-based payment networks. The real-time payment infrastructure market operates as the foundational technology layer beneath the broader real-time payments market, which includes consumer applications, merchant acceptance services, and end-to-end transaction value.
Key Takeaways
Market Growth: The real-time payment infrastructure market grew from USD 38.50 Billion in 2025 to a projected USD 285.50 Billion by 2034, at a 24.9% CAGR, representing USD 247.00 Billion in absolute dollar opportunity.
Segment Dominance (By Deployment): Cloud-hosted infrastructure represented 62.12% of the market in 2025 at approximately USD 23.91 Billion, advancing at 26.35% CAGR because SaaS removes capital expenditure barriers and lets mid-tier banks go live in weeks rather than quarters.
Segment Dominance (By End-User): Banks and financial institutions generated 40.55% of 2025 revenue at approximately USD 15.61 Billion, although retail and e-commerce is projected to grow fastest at 30.15% CAGR as instant settlement eliminates interchange costs.
Driver: U.S. Treasury's mandate requiring federal agencies to migrate to electronic disbursements by September 2025, combined with the RTP Network's February 2025 single-payment cap increase to USD 10 million, creates a committed institutional demand corridor for instant payment infrastructure.
Restraint: Legacy core banking system integration costs and the operational risk of 24/7/365 liquidity management require substantial capital expenditure on cybersecurity, system modernization, and complex software integration that slows adoption among smaller financial institutions.
Opportunity: Cross-border real-time payment corridors such as UPI-PayNow (India-Singapore), and the planned ISO 20022-based interoperability projects connecting major regional rails, represent the largest expansion frontier as bilateral and multilateral linkages reduce supplier settlement cycles for international commerce.
Trend: AI-agent-initiated commerce is emerging as a new transaction category, with Visa announcing partnerships in April 2025 with Anthropic, IBM, Microsoft, Mistral AI, OpenAI, and Perplexity to enable AI agents to process payments on Visa's network, expanding the addressable market for real-time settlement infrastructure.
Regional: North America led the market with 43.1% share valued at USD 16.59 Billion in 2025, driven by FedNow's 900-plus institutional enrollments and the RTP Network processing over USD 481 Billion in quarterly transactions in Q2 2025.
Key Insights Summary
More than 70.3 billion real-time payment transactions were processed globally in 2020 according to ACI Worldwide, with a 41% surge observed during the COVID-19 pandemic, establishing the volume base from which the current category continues to scale.
In July 2025, one leading U.S. RTP network reported processing over USD 481 billion in quarterly transactions, reflecting accelerating adoption of high-value instant payments and validating the February 2025 cap increase to USD 10 million per transaction.
FedNow had more than 900 institutions enrolled by end-2024, nearly double the RTP Network's base, demonstrating that government-operated infrastructure with direct Federal Reserve master account settlement attracts smaller financial institutions previously deterred by pre-funding requirements.
Brazil's PIX continues to demonstrate emerging-market RTP leadership, with e-commerce merchants projected to book USD 30 billion in instant-payment turnover during 2025, providing a template for low-interchange consumer-to-business payment models that other markets are studying for replication.
ACI Worldwide logged 42% software-segment growth in Q1 2025, indicating that combinational platform-plus-professional-services deals resonate with mid-tier institutions modernizing their RTP stacks, while The Clearing House's funding-agent model allows community institutions with assets under USD 1 billion to join RTP at roughly 40% of prior cost.
In April 2025, Visa Direct enhanced payout speed to reach 99% of U.S. accounts in under one minute, defending share against pay-by-bank alternatives and demonstrating the competitive intensity between scheme-based real-time payouts and account-to-account RTP rails.
Competitive Landscape Overview
The real-time payment infrastructure market is moderately concentrated at the platform-software layer and highly concentrated at the network-operator layer. ACI Worldwide, Fiserv, FIS, and Volante Technologies dominate the independent software vendor segment, providing core RTP processing platforms that financial institutions deploy on-premises or via cloud. Mastercard operates Vocalink (acquired in 2017), which powers the U.K. Faster Payments Service and the Mastercard PayPort+ gateway launched in June 2021 in partnership with Form3. Visa competes through Visa Direct, which targets the push-payment use case and reached 99% of U.S. accounts in under one minute as of April 2025. PayPal operates its own real-time wallet-to-bank infrastructure and integrates with bank-account rails. Ripple offers blockchain-based cross-border RTP infrastructure to financial institutions. Stripe and Square (Block) embed RTP capabilities for merchants and platforms. Network operators including The Clearing House (RTP Network), the Federal Reserve (FedNow), NPCI (UPI in India), Pix (Banco Central do Brasil), and EBA Clearing (RT1) are quasi-utility infrastructures that determine the underlying rails on which software vendors compete. The competitive dynamic in 2025 centers on cloud-native deployment, AI-driven fraud management, and the integration of RTP with embedded finance and account-to-account commerce flows that bypass card interchange.
Competitive Landscape Matrix
Company
HQ
Position
Key Platform/Product
Geo Strength
Founded
Recent Strategic Move
ACI Worldwide
US
Leader
Enterprise Payments Platform
Global
1975
42% software-segment growth Q1 2025
Fiserv
US
Leader
NOW Network, Carat platform
Global
1984
Walmart RTP merchant partnership (2025)
FIS
US
Leader
Open Payments Framework
Global
1968
Cloud-native RTP modernization rollout
Mastercard
US
Leader
Vocalink, PayPort+, Form3
Global
1966
AI agent commerce expansion (2025)
Visa
US
Leader
Visa Direct push payments
Global
1958
99% US reach in under 1 min (Apr 2025)
PayPal Holdings
US
Challenger
RTP wallet-to-bank rails
Global
1998
Account-to-account checkout expansion
Ripple
US
Challenger
XRP Ledger, On-Demand Liquidity
Global
2012
Cross-border RTP corridor expansion
Volante Technologies
US
Niche
VolPay, ISO 20022 platform
Global
2001
Cloud-native RTP-as-a-Service growth
Form3
UK
Niche
Cloud-native payments platform
EU, UK
2016
Mastercard PayPort+ partnership
By Component
Solutions accounted for the dominant share of the real-time payment infrastructure market in 2025 at 76.4%, valued at approximately USD 29.42 Billion. The solutions category includes payment gateways (originating and routing instant payments to the appropriate network), payment processing engines (validation, clearing, and settlement orchestration), and payment security and fraud management modules (real-time risk scoring, sanctions screening, AI-driven anomaly detection). ACI Worldwide's 42% software-segment growth in Q1 2025 reflects the strength of demand for modernized core processing platforms. Mastercard's PayPort+ gateway, launched in June 2021 and expanded throughout 2024 and 2025, provides payment service providers and financial institutions with flexible access to the U.K. Faster Payments infrastructure, powered by Vocalink and built in partnership with Form3.
Services held 23.6% of the real-time payment infrastructure market at approximately USD 9.08 Billion in 2025, encompassing professional services for implementation and integration, managed services for ongoing platform operation, and consulting services for RTP strategy and modernization. The combinational platform-plus-professional-services deal model is increasingly central to vendor revenue, particularly among mid-tier institutions that lack in-house payment engineering teams. Hybrid-cloud orchestrators with containerized microservices have become essential, enabling banks to retire mainframe modules gradually while front-ending customers with instant-payment APIs.
By Deployment Mode
Cloud-hosted instances represented 62.12% of the real-time payment infrastructure market in 2025 at approximately USD 23.92 Billion and are advancing at a 26.35% CAGR through 2034. SaaS adoption removes capital expenditure barriers, compresses launch timelines from quarters to weeks, and provides automatic regulatory updates as ISO 20022 standards evolve. Cloud deployment also enables on-demand sandbox provisioning that accelerates product development and testing. On-premises deployment held the remaining 37.88% at approximately USD 14.58 Billion in 2025, predominantly among large global banks with strict data sovereignty requirements and existing investment in private data centers.
By End-User Industry
Banks and financial institutions generated 40.55% of 2025 real-time payment infrastructure revenue at approximately USD 15.61 Billion, serving as both processors and major users of instant payment rails. Retail and e-commerce is projected to grow fastest at 30.15% CAGR through 2034 from a 2025 base of approximately USD 8.93 Billion, as instant settlement strips interchange cost and elevates checkout conversion. Walmart's partnership with Fiserv epitomizes merchant demand for alternatives to three-day card funding lags. Healthcare adoption is escalating where insurers implement instant claim payouts to improve patient NPS scores and lower paper-cheque overhead. Government agencies in GCC countries are legislating instant salary and welfare disbursement, institutionalizing infrastructure demand. Utilities deploy RTP refunds to accelerate storm-related credits, and fintech lenders leverage real-time payout and repayment to compress credit cycles.
By Payment Type
Person-to-Business (P2B) payments held the largest share of the real-time payment infrastructure market in 2025 at approximately 41.2%, valued at USD 15.86 Billion, driven by the global expansion of e-commerce and the growing preference for account-to-account checkout that bypasses card interchange. Person-to-Person (P2P) payments held 24.7% at USD 9.51 Billion, driven by mobile app adoption such as Zelle and Venmo in the U.S. Business-to-Business (B2B) accounted for 21.4% at USD 8.24 Billion, with the February 2025 RTP Network cap increase to USD 10 million enabling real-estate closings, supplier finance, and large-value commercial flows. Business-to-Person (B2P) and government disbursement flows comprised the remaining 12.7% at USD 4.89 Billion.
Regional Analysis
North America held the largest share of the real-time payment infrastructure market at 43.1% in 2025, valued at approximately USD 16.59 Billion. The United States dominates regional demand through the parallel operation of FedNow (the Federal Reserve's instant payment service launched in 2023) and the RTP Network operated by The Clearing House. FedNow had more than 900 institutions enrolled by end-2024, nearly double the RTP Network's base. February 2025 saw the RTP Network raise its single-payment cap to USD 10 million, opening B2B use cases. KeyBank alone expects 4 million RTP transactions in 2025. In July 2025, one leading U.S. RTP network processed over USD 481 billion in quarterly transactions. Visa Direct enhanced payout speed to reach 99% of U.S. accounts in under one minute as of April 2025. Canada's Real-Time Rail (RTR) project, operated by Payments Canada, continues development with expected launch in 2026.
Asia Pacific accounted for 31.2% of the real-time payment infrastructure market at approximately USD 12.01 Billion in 2025 and is projected to grow at the fastest regional CAGR of 26.8% through 2034. India's Unified Payments Interface (UPI), operated by the National Payments Corporation of India (NPCI), processes the largest share of global RTP transaction volume by far, with continuing growth driven by mobile penetration and merchant adoption. Thailand's PromptPay and Singapore's PayNow have established mature instant payment infrastructure, and the UPI-PayNow bilateral cross-border corridor links India and Singapore for instant remittances. China operates internal real-time settlement through CIPS and the Internet Banking Payment System. Japan's Zengin System and South Korea's instant payment networks complete the regional infrastructure landscape.
Europe represented 17.8% of the real-time payment infrastructure market at approximately USD 6.85 Billion in 2025, anchored by the SEPA Instant Credit Transfer (SCT Inst) framework operated by EBA Clearing's RT1 service alongside the European Central Bank's TIPS platform. Switzerland is targeting full instant payments by 2026, while the U.K. Faster Payments Service operated by Pay.UK and powered by Mastercard's Vocalink continues to expand transaction volumes. The EU Instant Payments Regulation, enacted in 2024 with implementation deadlines through 2025 and 2026, mandates that all eurozone payment service providers offer instant credit transfers at no premium over standard SEPA pricing, accelerating infrastructure investment across the region.
Latin America held 5.4% of the real-time payment infrastructure market at approximately USD 2.08 Billion in 2025, dominated by Brazil's PIX, where e-commerce merchants are projected to book USD 30 billion in instant-payment turnover during 2025. Mexico's CoDi and Argentina's Transferencias 3.0 add regional volume. Middle East and Africa held 2.5% at approximately USD 963 million, with GCC government-to-person disbursement mandates institutionalizing demand and Saudi Arabia's sarie instant payment system, the UAE's Aani, and South Africa's PayShap establishing regional rails.
Country Analysis
The United States dominates the real-time payment infrastructure market with an estimated value of USD 13.42 Billion in 2025 and a country-level CAGR of 28.6% through 2034. The dual-rail structure of FedNow and RTP Network creates competitive pressure that benefits infrastructure software vendors. The Treasury mandate requiring federal agencies to migrate to electronic disbursements by September 2025 guarantees institutional demand. The Clearing House's funding-agent model allows community institutions with assets under USD 1 billion to join RTP at roughly 40% of prior cost, expanding the addressable market because over 70% of U.S. banking institutions fall in the community category. Major U.S. infrastructure vendors include ACI Worldwide (Naples, Florida), Fiserv (Brookfield, Wisconsin), and FIS (Jacksonville, Florida).
India is the second-largest national market valued at approximately USD 4.81 Billion in 2025 with a projected CAGR of 28.4%. The Unified Payments Interface (UPI), operated by the National Payments Corporation of India under the Reserve Bank of India, processed the largest national volume of real-time payments globally. UPI's open API architecture has been adopted as a model for instant payment infrastructure in multiple emerging markets. Domestic infrastructure vendors and global software providers including ACI Worldwide and FIS support both NPCI and member banks. The UPI-PayNow corridor with Singapore (launched 2023) demonstrates India's leadership in cross-border RTP interoperability.
Brazil contributes approximately USD 1.65 Billion to the real-time payment infrastructure market in 2025 with a CAGR of 27.2%. PIX, launched by Banco Central do Brasil in November 2020, has achieved near-universal adoption with e-commerce merchants projected to book USD 30 billion in instant-payment turnover during 2025. PIX's mandatory participation rules for major financial institutions and zero-fee model for individuals have driven the world's fastest national RTP adoption curve. Brazilian fintech infrastructure providers compete alongside global vendors in serving the country's 700-plus PIX-participating institutions.
The United Kingdom represents Europe's largest national market for real-time payment infrastructure at approximately USD 2.08 Billion in 2025 with a CAGR of 19.8%. The Faster Payments Service (FPS) operated by Pay.UK and powered by Mastercard's Vocalink processes domestic instant payments. Mastercard's PayPort+ gateway, launched in June 2021 in partnership with Form3, provides flexible access to FPS for payment service providers and financial institutions. The U.K.'s New Payments Architecture (NPA) program continues development as the next-generation replacement for FPS, with infrastructure tendering ongoing throughout 2024 and 2025.
By Component, (Solutions, Services), By Deployment Mode, (On-Premises, Cloud-Based, Hybrid Deployment), By End-User Industry, (Banking, Financial Services, and Insurance (BFSI), Retail and E-commerce, Telecommunications, Healthcare, Government and Public Sector, Travel and Hospitality, Utilities and Energy, Media and Entertainment, Transportation and Logistics, Manufacturing, Education, Others), By Payment Type, (Person-to-Person (P2P) Payments, Person-to-Business (P2B) Payments, Business-to-Business (B2B) Payments, Business-to-Consumer (B2C) Payments, Government-to-Person (G2P) Payments, Person-to-Government (P2G) Payments, Cross-Border Real-Time Payments, Merchant Payments, Bill Payments, Others)
Research Methodology
Primary Research- 100 Interviews of Stakeholders
Secondary Research
Desk Research
Regional scope
North America (United States, Canada, Mexico)
Latin America (Brazil, Argentina, Columbia)
East Asia And Pacific (China, Japan, South Korea, Australia, Cambodia, Fiji, Indonesia)
Sea And South Asia (India, Singapore, Thailand, Taiwan, Malaysia)
Eastern Europe (Poland, Russia, Czech Republic, Romania)
Western Europe (Germany, U.K., France, Spain, Itlay)
Middle East & Africa (GCC Countries, Egypt, Nigeria, South Africa, Israel)
Competitive Landscape
ACI WORLDWIDE, INC., FISERV, INC., FIS (FIDELITY NATIONAL INFORMATION SERVICES, INC.), MASTERCARD INCORPORATED, VISA INC., PAYPAL HOLDINGS, INC., MONTRAN CORPORATION, RIPPLE LABS, INC., VOLANTE TECHNOLOGIES, FORM3 LIMITED, STRIPE, INC., BLOCK, INC. (SQUARE), TEMENOS AG, FINASTRA, WISE PLC, Others
Customization Scope
Customization for segments, region/country-level will be provided. Moreover, additional customization can be done based on the requirements.
Pricing and Purchase Options
Avail customized purchase options to meet your exact research needs. We have three licenses to opt for: Single User License, Multi-User License (Up to 5 Users), Corporate Use License (Unlimited User and Printable PDF).
TABLE OF CONTENTS
1. EXECUTIVE SUMMARY
1.1. MARKET SNAPSHOT
1.2. KEY FINDINGS & INSIGHTS
1.3. ANALYST RECOMMENDATIONS
1.4. FUTURE OUTLOOK
2. RESEARCH METHODOLOGY
2.1. MARKET DEFINITION & SCOPE
2.2. RESEARCH OBJECTIVES: PRIMARY & SECONDARY DATA SOURCES
2.3. DATA COLLECTION SOURCES
2.3.1. COVERAGE OF 100+ PRIMARY RESEARCH/CONSULTATION CALLS WITH INDUSTRY STAKEHOLDERS
FIGURE 17 NORTH AMERICA GLOBAL REAL-TIME PAYMENT INFRASTRUCTURE MARKET CURRENT AND FUTURE TYPE ANALYSIS, 2025–2034, (USD MILLION)
FIGURE 18 NORTH AMERICA GLOBAL REAL-TIME PAYMENT INFRASTRUCTURE MARKET CURRENT AND FUTURE END USER ANALYSIS, 2025–2034, (USD MILLION)
FIGURE 19 MARKET SHARE BY COUNTRY
FIGURE 20 LATIN AMERICA GLOBAL REAL-TIME PAYMENT INFRASTRUCTURE MARKET CURRENT AND FUTURE TYPE ANALYSIS, 2025–2034, (USD MILLION)
FIGURE 21 LATIN AMERICA GLOBAL REAL-TIME PAYMENT INFRASTRUCTURE MARKET CURRENT AND FUTURE END USER ANALYSIS, 2025–2034, (USD MILLION)
FIGURE 22 MARKET SHARE BY COUNTRY
FIGURE 23 EASTERN EUROPE GLOBAL REAL-TIME PAYMENT INFRASTRUCTURE MARKET CURRENT AND FUTURE TYPE ANALYSIS, 2025–2034, (USD MILLION)
FIGURE 24 EASTERN EUROPE GLOBAL REAL-TIME PAYMENT INFRASTRUCTURE MARKET CURRENT AND FUTURE END USER ANALYSIS, 2025–2034, (USD MILLION)
FIGURE 25 MARKET SHARE BY COUNTRY
FIGURE 26 WESTERN EUROPE GLOBAL REAL-TIME PAYMENT INFRASTRUCTURE MARKET CURRENT AND FUTURE TYPE ANALYSIS, 2025–2034, (USD MILLION)
FIGURE 27 WESTERN EUROPE GLOBAL REAL-TIME PAYMENT INFRASTRUCTURE MARKET CURRENT AND FUTURE END USER ANALYSIS, 2025–2034, (USD MILLION)
FIGURE 28 MARKET SHARE BY COUNTRY
FIGURE 29 EAST ASIA AND PACIFIC GLOBAL REAL-TIME PAYMENT INFRASTRUCTURE MARKET CURRENT AND FUTURE TYPE ANALYSIS, 2025–2034, (USD MILLION)
FIGURE 30 EAST ASIA AND PACIFIC GLOBAL REAL-TIME PAYMENT INFRASTRUCTURE MARKET CURRENT AND FUTURE END USER ANALYSIS, 2025–2034, (USD MILLION)
FIGURE 31 MARKET SHARE BY COUNTRY
FIGURE 32 SEA AND SOUTH ASIA GLOBAL REAL-TIME PAYMENT INFRASTRUCTURE MARKET CURRENT AND FUTURE TYPE ANALYSIS, 2025–2034, (USD MILLION)
FIGURE 33 SEA AND SOUTH ASIA GLOBAL REAL-TIME PAYMENT INFRASTRUCTURE MARKET CURRENT AND FUTURE END USER ANALYSIS, 2025–2034, (USD MILLION)
FIGURE 34 MARKET SHARE BY COUNTRY
FIGURE 35 MIDDLE EAST AND AFRICA GLOBAL REAL-TIME PAYMENT INFRASTRUCTURE MARKET CURRENT AND FUTURE TYPE ANALYSIS, 2025–2034, (USD MILLION)
FIGURE 36 MIDDLE EAST AND AFRICA GLOBAL REAL-TIME PAYMENT INFRASTRUCTURE MARKET CURRENT AND FUTURE END USER ANALYSIS, 2025–2034, (USD MILLION)
FIGURE 37 NORTH AMERICA GLOBAL REAL-TIME PAYMENT INFRASTRUCTURE MARKET CURRENT AND FUTURE MARKET VOLUME SHARE REGIONAL ANALYSIS, 2025–2034, (USD MILLION)
FIGURE 38 U.S. GLOBAL REAL-TIME PAYMENT INFRASTRUCTURE MARKET CURRENT AND FUTURE TYPE ANALYSIS, 2025–2034, (USD MILLION)
FIGURE 39 U.S. GLOBAL REAL-TIME PAYMENT INFRASTRUCTURE MARKET CURRENT AND FUTURE END USER ANALYSIS, 2025–2034, (USD MILLION)
FIGURE 40 CANADA GLOBAL REAL-TIME PAYMENT INFRASTRUCTURE MARKET CURRENT AND FUTURE TYPE ANALYSIS, 2025–2034, (USD MILLION)
FIGURE 41 CANADA GLOBAL REAL-TIME PAYMENT INFRASTRUCTURE MARKET CURRENT AND FUTURE END USER ANALYSIS, 2025–2034, (USD MILLION)
FIGURE 42 LATIN AMERICA GLOBAL REAL-TIME PAYMENT INFRASTRUCTURE MARKET CURRENT AND FUTURE MARKET VOLUME SHARE REGIONAL ANALYSIS, 2025–2034, (USD MILLION)
FIGURE 43 MEXICO GLOBAL REAL-TIME PAYMENT INFRASTRUCTURE MARKET CURRENT AND FUTURE TYPE ANALYSIS, 2025–2034, (USD MILLION)
FIGURE 44 MEXICO GLOBAL REAL-TIME PAYMENT INFRASTRUCTURE MARKET CURRENT AND FUTURE END USER ANALYSIS, 2025–2034, (USD MILLION)
FIGURE 45 BRAZIL GLOBAL REAL-TIME PAYMENT INFRASTRUCTURE MARKET CURRENT AND FUTURE TYPE ANALYSIS, 2025–2034, (USD MILLION)
FIGURE 46 BRAZIL GLOBAL REAL-TIME PAYMENT INFRASTRUCTURE MARKET CURRENT AND FUTURE END USER ANALYSIS, 2025–2034, (USD MILLION)
FIGURE 47 ARGENTINA GLOBAL REAL-TIME PAYMENT INFRASTRUCTURE MARKET CURRENT AND FUTURE TYPE ANALYSIS, 2025–2034, (USD MILLION)
FIGURE 48 ARGENTINA GLOBAL REAL-TIME PAYMENT INFRASTRUCTURE MARKET CURRENT AND FUTURE END USER ANALYSIS, 2025–2034, (USD MILLION)
FIGURE 49 COLUMBIA GLOBAL REAL-TIME PAYMENT INFRASTRUCTURE MARKET CURRENT AND FUTURE TYPE ANALYSIS, 2025–2034, (USD MILLION)
FIGURE 50 COLUMBIA GLOBAL REAL-TIME PAYMENT INFRASTRUCTURE MARKET CURRENT AND FUTURE END USER ANALYSIS, 2025–2034, (USD MILLION)
FIGURE 51 REST OF LATIN AMERICA GLOBAL REAL-TIME PAYMENT INFRASTRUCTURE MARKET CURRENT AND FUTURE TYPE ANALYSIS, 2025–2034, (USD MILLION)
FIGURE 52 REST OF LATIN AMERICA GLOBAL REAL-TIME PAYMENT INFRASTRUCTURE MARKET CURRENT AND FUTURE END USER ANALYSIS, 2025–2034, (USD MILLION)
FIGURE 53 EASTERN EUROPE GLOBAL REAL-TIME PAYMENT INFRASTRUCTURE MARKET CURRENT AND FUTURE MARKET VOLUME SHARE REGIONAL ANALYSIS, 2025–2034, (USD MILLION)
FIGURE 54 POLAND GLOBAL REAL-TIME PAYMENT INFRASTRUCTURE MARKET CURRENT AND FUTURE TYPE ANALYSIS, 2025–2034, (USD MILLION)
FIGURE 55 POLAND GLOBAL REAL-TIME PAYMENT INFRASTRUCTURE MARKET CURRENT AND FUTURE END USER ANALYSIS, 2025–2034, (USD MILLION)
FIGURE 56 RUSSIA GLOBAL REAL-TIME PAYMENT INFRASTRUCTURE MARKET CURRENT AND FUTURE TYPE ANALYSIS, 2025–2034, (USD MILLION)
FIGURE 57 RUSSIA GLOBAL REAL-TIME PAYMENT INFRASTRUCTURE MARKET CURRENT AND FUTURE END USER ANALYSIS, 2025–2034, (USD MILLION)
FIGURE 58 CZECH REPUBLIC GLOBAL REAL-TIME PAYMENT INFRASTRUCTURE MARKET CURRENT AND FUTURE TYPE ANALYSIS, 2025–2034, (USD MILLION)
FIGURE 59 CZECH REPUBLIC GLOBAL REAL-TIME PAYMENT INFRASTRUCTURE MARKET CURRENT AND FUTURE END USER ANALYSIS, 2025–2034, (USD MILLION)
FIGURE 60 ROMANIA GLOBAL REAL-TIME PAYMENT INFRASTRUCTURE MARKET CURRENT AND FUTURE TYPE ANALYSIS, 2025–2034, (USD MILLION)
FIGURE 61 ROMANIA GLOBAL REAL-TIME PAYMENT INFRASTRUCTURE MARKET CURRENT AND FUTURE END USER ANALYSIS, 2025–2034, (USD MILLION)
FIGURE 62 REST OF EASTERN EUROPE GLOBAL REAL-TIME PAYMENT INFRASTRUCTURE MARKET CURRENT AND FUTURE TYPE ANALYSIS, 2025–2034, (USD MILLION)
FIGURE 63 REST OF EASTERN EUROPE GLOBAL REAL-TIME PAYMENT INFRASTRUCTURE MARKET CURRENT AND FUTURE END USER ANALYSIS, 2025–2034, (USD MILLION)
FIGURE 64 WESTERN EUROPE GLOBAL REAL-TIME PAYMENT INFRASTRUCTURE MARKET CURRENT AND FUTURE MARKET VOLUME SHARE REGIONAL ANALYSIS, 2025–2034, (USD MILLION)
FIGURE 65 GERMANY GLOBAL REAL-TIME PAYMENT INFRASTRUCTURE MARKET CURRENT AND FUTURE TYPE ANALYSIS, 2025–2034, (USD MILLION)
FIGURE 66 GERMANY GLOBAL REAL-TIME PAYMENT INFRASTRUCTURE MARKET CURRENT AND FUTURE END USER ANALYSIS, 2025–2034, (USD MILLION)
FIGURE 67 FRANCE GLOBAL REAL-TIME PAYMENT INFRASTRUCTURE MARKET CURRENT AND FUTURE TYPE ANALYSIS, 2025–2034, (USD MILLION)
FIGURE 68 FRANCE GLOBAL REAL-TIME PAYMENT INFRASTRUCTURE MARKET CURRENT AND FUTURE END USER ANALYSIS, 2025–2034, (USD MILLION)
FIGURE 69 UK GLOBAL REAL-TIME PAYMENT INFRASTRUCTURE MARKET CURRENT AND FUTURE TYPE ANALYSIS, 2025–2034, (USD MILLION)
FIGURE 70 UK GLOBAL REAL-TIME PAYMENT INFRASTRUCTURE MARKET CURRENT AND FUTURE END USER ANALYSIS, 2025–2034, (USD MILLION)
FIGURE 71 SPAIN GLOBAL REAL-TIME PAYMENT INFRASTRUCTURE MARKET CURRENT AND FUTURE TYPE ANALYSIS, 2025–2034, (USD MILLION)
FIGURE 72 SPAIN GLOBAL REAL-TIME PAYMENT INFRASTRUCTURE MARKET CURRENT AND FUTURE END USER ANALYSIS, 2025–2034, (USD MILLION)
FIGURE 73 ITALY GLOBAL REAL-TIME PAYMENT INFRASTRUCTURE MARKET CURRENT AND FUTURE TYPE ANALYSIS, 2025–2034, (USD MILLION)
FIGURE 74 ITALY GLOBAL REAL-TIME PAYMENT INFRASTRUCTURE MARKET CURRENT AND FUTURE END USER ANALYSIS, 2025–2034, (USD MILLION)
FIGURE 75 REST OF WESTERN EUROPE GLOBAL REAL-TIME PAYMENT INFRASTRUCTURE MARKET CURRENT AND FUTURE TYPE ANALYSIS, 2025–2034, (USD MILLION)
FIGURE 76 REST OF WESTERN EUROPE GLOBAL REAL-TIME PAYMENT INFRASTRUCTURE MARKET CURRENT AND FUTURE END USER ANALYSIS, 2025–2034, (USD MILLION)
FIGURE 77 EAST ASIA AND PACIFIC GLOBAL REAL-TIME PAYMENT INFRASTRUCTURE MARKET CURRENT AND FUTURE MARKET VOLUME SHARE REGIONAL ANALYSIS, 2025–2034, (USD MILLION)
FIGURE 78 CHINA GLOBAL REAL-TIME PAYMENT INFRASTRUCTURE MARKET CURRENT AND FUTURE TYPE ANALYSIS, 2025–2034, (USD MILLION)
FIGURE 79 CHINA GLOBAL REAL-TIME PAYMENT INFRASTRUCTURE MARKET CURRENT AND FUTURE END USER ANALYSIS, 2025–2034, (USD MILLION)
FIGURE 80 JAPAN GLOBAL REAL-TIME PAYMENT INFRASTRUCTURE MARKET CURRENT AND FUTURE TYPE ANALYSIS, 2025–2034, (USD MILLION)
FIGURE 81 JAPAN GLOBAL REAL-TIME PAYMENT INFRASTRUCTURE MARKET CURRENT AND FUTURE END USER ANALYSIS, 2025–2034, (USD MILLION)
FIGURE 82 AUSTRALIA GLOBAL REAL-TIME PAYMENT INFRASTRUCTURE MARKET CURRENT AND FUTURE TYPE ANALYSIS, 2025–2034, (USD MILLION)
FIGURE 83 AUSTRALIA GLOBAL REAL-TIME PAYMENT INFRASTRUCTURE MARKET CURRENT AND FUTURE END USER ANALYSIS, 2025–2034, (USD MILLION)
FIGURE 84 CAMBODIA GLOBAL REAL-TIME PAYMENT INFRASTRUCTURE MARKET CURRENT AND FUTURE TYPE ANALYSIS, 2025–2034, (USD MILLION)
FIGURE 85 CAMBODIA GLOBAL REAL-TIME PAYMENT INFRASTRUCTURE MARKET CURRENT AND FUTURE END USER ANALYSIS, 2025–2034, (USD MILLION)
FIGURE 86 FIJI GLOBAL REAL-TIME PAYMENT INFRASTRUCTURE MARKET CURRENT AND FUTURE TYPE ANALYSIS, 2025–2034, (USD MILLION)
FIGURE 87 FIJI GLOBAL REAL-TIME PAYMENT INFRASTRUCTURE MARKET CURRENT AND FUTURE END USER ANALYSIS, 2025–2034, (USD MILLION)
FIGURE 88 INDONESIA GLOBAL REAL-TIME PAYMENT INFRASTRUCTURE MARKET CURRENT AND FUTURE TYPE ANALYSIS, 2025–2034, (USD MILLION)
FIGURE 89 INDONESIA GLOBAL REAL-TIME PAYMENT INFRASTRUCTURE MARKET CURRENT AND FUTURE END USER ANALYSIS, 2025–2034, (USD MILLION)
FIGURE 90 SOUTH KOREA GLOBAL REAL-TIME PAYMENT INFRASTRUCTURE MARKET CURRENT AND FUTURE TYPE ANALYSIS, 2025–2034, (USD MILLION)
FIGURE 91 SOUTH KOREA GLOBAL REAL-TIME PAYMENT INFRASTRUCTURE MARKET CURRENT AND FUTURE END USER ANALYSIS, 2025–2034, (USD MILLION)
FIGURE 92 REST OF EAST ASIA AND PACIFIC GLOBAL REAL-TIME PAYMENT INFRASTRUCTURE MARKET CURRENT AND FUTURE TYPE ANALYSIS, 2025–2034, (USD MILLION)
FIGURE 93 REST OF EAST ASIA AND PACIFIC GLOBAL REAL-TIME PAYMENT INFRASTRUCTURE MARKET CURRENT AND FUTURE END USER ANALYSIS, 2025–2034, (USD MILLION)
FIGURE 94 SEA AND SOUTH ASIA GLOBAL REAL-TIME PAYMENT INFRASTRUCTURE MARKET CURRENT AND FUTURE MARKET VOLUME SHARE REGIONAL ANALYSIS, 2025–2034, (USD MILLION)
FIGURE 95 BANGLADESH GLOBAL REAL-TIME PAYMENT INFRASTRUCTURE MARKET CURRENT AND FUTURE TYPE ANALYSIS, 2025–2034, (USD MILLION)
FIGURE 96 BANGLADESH GLOBAL REAL-TIME PAYMENT INFRASTRUCTURE MARKET CURRENT AND FUTURE END USER ANALYSIS, 2025–2034, (USD MILLION)
FIGURE 97 NEW ZEALAND GLOBAL REAL-TIME PAYMENT INFRASTRUCTURE MARKET CURRENT AND FUTURE TYPE ANALYSIS, 2025–2034, (USD MILLION)
FIGURE 98 NEW ZEALAND GLOBAL REAL-TIME PAYMENT INFRASTRUCTURE MARKET CURRENT AND FUTURE END USER ANALYSIS, 2025–2034, (USD MILLION)
FIGURE 99 INDIA GLOBAL REAL-TIME PAYMENT INFRASTRUCTURE MARKET CURRENT AND FUTURE TYPE ANALYSIS, 2025–2034, (USD MILLION)
FIGURE 100 INDIA GLOBAL REAL-TIME PAYMENT INFRASTRUCTURE MARKET CURRENT AND FUTURE END USER ANALYSIS, 2025–2034, (USD MILLION)
FIGURE 101 SINGAPORE GLOBAL REAL-TIME PAYMENT INFRASTRUCTURE MARKET CURRENT AND FUTURE TYPE ANALYSIS, 2025–2034, (USD MILLION)
FIGURE 102 SINGAPORE GLOBAL REAL-TIME PAYMENT INFRASTRUCTURE MARKET CURRENT AND FUTURE END USER ANALYSIS, 2025–2034, (USD MILLION)
FIGURE 103 THAILAND GLOBAL REAL-TIME PAYMENT INFRASTRUCTURE MARKET CURRENT AND FUTURE TYPE ANALYSIS, 2025–2034, (USD MILLION)
FIGURE 104 THAILAND GLOBAL REAL-TIME PAYMENT INFRASTRUCTURE MARKET CURRENT AND FUTURE END USER ANALYSIS, 2025–2034, (USD MILLION)
FIGURE 105 TAIWAN GLOBAL REAL-TIME PAYMENT INFRASTRUCTURE MARKET CURRENT AND FUTURE TYPE ANALYSIS, 2025–2034, (USD MILLION)
FIGURE 106 TAIWAN GLOBAL REAL-TIME PAYMENT INFRASTRUCTURE MARKET CURRENT AND FUTURE END USER ANALYSIS, 2025–2034, (USD MILLION)
FIGURE 107 MALAYSIA GLOBAL REAL-TIME PAYMENT INFRASTRUCTURE MARKET CURRENT AND FUTURE TYPE ANALYSIS, 2025–2034, (USD MILLION)
FIGURE 108 MALAYSIA GLOBAL REAL-TIME PAYMENT INFRASTRUCTURE MARKET CURRENT AND FUTURE END USER ANALYSIS, 2025–2034, (USD MILLION)
FIGURE 109 REST OF SEA AND SOUTH ASIA GLOBAL REAL-TIME PAYMENT INFRASTRUCTURE MARKET CURRENT AND FUTURE TYPE ANALYSIS, 2025–2034, (USD MILLION)
FIGURE 110 REST OF SEA AND SOUTH ASIA GLOBAL REAL-TIME PAYMENT INFRASTRUCTURE MARKET CURRENT AND FUTURE END USER ANALYSIS, 2025–2034, (USD MILLION)
FIGURE 111 MIDDLE EAST AND AFRICA GLOBAL REAL-TIME PAYMENT INFRASTRUCTURE MARKET CURRENT AND FUTURE MARKET VOLUME SHARE REGIONAL ANALYSIS, 2025–2034, (USD MILLION)
FIGURE 112 GCC COUNTRIES GLOBAL REAL-TIME PAYMENT INFRASTRUCTURE MARKET CURRENT AND FUTURE TYPE ANALYSIS, 2025–2034, (USD MILLION)
FIGURE 113 GCC COUNTRIES GLOBAL REAL-TIME PAYMENT INFRASTRUCTURE MARKET CURRENT AND FUTURE END USER ANALYSIS, 2025–2034, (USD MILLION)
FIGURE 114 SAUDI ARABIA GLOBAL REAL-TIME PAYMENT INFRASTRUCTURE MARKET CURRENT AND FUTURE TYPE ANALYSIS, 2025–2034, (USD MILLION)
FIGURE 115 SAUDI ARABIA GLOBAL REAL-TIME PAYMENT INFRASTRUCTURE MARKET CURRENT AND FUTURE END USER ANALYSIS, 2025–2034, (USD MILLION)
FIGURE 116 UAE GLOBAL REAL-TIME PAYMENT INFRASTRUCTURE MARKET CURRENT AND FUTURE TYPE ANALYSIS, 2025–2034, (USD MILLION)
FIGURE 117 UAE GLOBAL REAL-TIME PAYMENT INFRASTRUCTURE MARKET CURRENT AND FUTURE END USER ANALYSIS, 2025–2034, (USD MILLION)
FIGURE 118 BAHRAIN GLOBAL REAL-TIME PAYMENT INFRASTRUCTURE MARKET CURRENT AND FUTURE TYPE ANALYSIS, 2025–2034, (USD MILLION)
FIGURE 119 BAHRAIN GLOBAL REAL-TIME PAYMENT INFRASTRUCTURE MARKET CURRENT AND FUTURE END USER ANALYSIS, 2025–2034, (USD MILLION)
FIGURE 120 KUWAIT GLOBAL REAL-TIME PAYMENT INFRASTRUCTURE MARKET CURRENT AND FUTURE TYPE ANALYSIS, 2025–2034, (USD MILLION)
FIGURE 121 KUWAIT GLOBAL REAL-TIME PAYMENT INFRASTRUCTURE MARKET CURRENT AND FUTURE END USER ANALYSIS, 2025–2034, (USD MILLION)
FIGURE 122 OMAN GLOBAL REAL-TIME PAYMENT INFRASTRUCTURE MARKET CURRENT AND FUTURE TYPE ANALYSIS, 2025–2034, (USD MILLION)
FIGURE 123 OMAN GLOBAL REAL-TIME PAYMENT INFRASTRUCTURE MARKET CURRENT AND FUTURE END USER ANALYSIS, 2025–2034, (USD MILLION)
FIGURE 124 QATAR GLOBAL REAL-TIME PAYMENT INFRASTRUCTURE MARKET CURRENT AND FUTURE TYPE ANALYSIS, 2025–2034, (USD MILLION)
FIGURE 125 QATAR GLOBAL REAL-TIME PAYMENT INFRASTRUCTURE MARKET CURRENT AND FUTURE END USER ANALYSIS, 2025–2034, (USD MILLION)
FIGURE 126 EGYPT GLOBAL REAL-TIME PAYMENT INFRASTRUCTURE MARKET CURRENT AND FUTURE TYPE ANALYSIS, 2025–2034, (USD MILLION)
FIGURE 127 EGYPT GLOBAL REAL-TIME PAYMENT INFRASTRUCTURE MARKET CURRENT AND FUTURE END USER ANALYSIS, 2025–2034, (USD MILLION)
FIGURE 128 NIGERIA GLOBAL REAL-TIME PAYMENT INFRASTRUCTURE MARKET CURRENT AND FUTURE TYPE ANALYSIS, 2025–2034, (USD MILLION)
FIGURE 129 NIGERIA GLOBAL REAL-TIME PAYMENT INFRASTRUCTURE MARKET CURRENT AND FUTURE END USER ANALYSIS, 2025–2034, (USD MILLION)
FIGURE 130 SOUTH AFRICA GLOBAL REAL-TIME PAYMENT INFRASTRUCTURE MARKET CURRENT AND FUTURE TYPE ANALYSIS, 2025–2034, (USD MILLION)
FIGURE 131 SOUTH AFRICA GLOBAL REAL-TIME PAYMENT INFRASTRUCTURE MARKET CURRENT AND FUTURE END USER ANALYSIS, 2025–2034, (USD MILLION)
FIGURE 132 ISRAEL GLOBAL REAL-TIME PAYMENT INFRASTRUCTURE MARKET CURRENT AND FUTURE TYPE ANALYSIS, 2025–2034, (USD MILLION)
FIGURE 133 ISRAEL GLOBAL REAL-TIME PAYMENT INFRASTRUCTURE MARKET CURRENT AND FUTURE END USER ANALYSIS, 2025–2034, (USD MILLION)
FIGURE 134 REST OF MEA GLOBAL REAL-TIME PAYMENT INFRASTRUCTURE MARKET CURRENT AND FUTURE TYPE ANALYSIS, 2025–2034, (USD MILLION)
FIGURE 135 REST OF MEA GLOBAL REAL-TIME PAYMENT INFRASTRUCTURE MARKET CURRENT AND FUTURE END USER ANALYSIS, 2025–2034, (USD MILLION)
FIGURE 136 U. S. MARKET SHARE ANALYSIS BY TYPE (2025)
FIGURE 137 U. S. MARKET SHARE ANALYSIS BY END USER (2025)
FIGURE 138 CANADA MARKET SHARE ANALYSIS BY TYPE (2025)
FIGURE 139 CANADA MARKET SHARE ANALYSIS BY END USER (2025)
FIGURE 140 MEXICO MARKET SHARE ANALYSIS BY TYPE (2025)
FIGURE 141 MEXICO MARKET SHARE ANALYSIS BY END USER (2025)
FIGURE 142 CHINA MARKET SHARE ANALYSIS BY TYPE (2025)
FIGURE 143 CHINA MARKET SHARE ANALYSIS BY END USER (2025)
FIGURE 144 JAPAN MARKET SHARE ANALYSIS BY TYPE (2025)
FIGURE 145 JAPAN MARKET SHARE ANALYSIS BY END USER (2025)
FIGURE 146 INDIA MARKET SHARE ANALYSIS BY TYPE (2025)
FIGURE 147 INDIA MARKET SHARE ANALYSIS BY END USER (2025)
FIGURE 148 SOUTH KOREA MARKET SHARE ANALYSIS BY TYPE (2025)
FIGURE 149 SOUTH KOREA MARKET SHARE ANALYSIS BY END USER (2025)
FIGURE 150 SAUDI ARABIA MARKET SHARE ANALYSIS BY TYPE (2025)
FIGURE 151 SAUDI ARABIA MARKET SHARE ANALYSIS BY END USER (2025)
FIGURE 152 UAE MARKET SHARE ANALYSIS BY TYPE (2025)
FIGURE 153 UAE MARKET SHARE ANALYSIS BY END USER (2025)
FIGURE 154 EGYPT MARKET SHARE ANALYSIS BY TYPE (2025)
FIGURE 155 EGYPT MARKET SHARE ANALYSIS BY END USER (2025)
FIGURE 156 NIGERIA MARKET SHARE ANALYSIS BY TYPE (2025)
FIGURE 157 NIGERIA MARKET SHARE ANALYSIS BY END USER (2025)
FIGURE 158 SOUTH AFRICA MARKET SHARE ANALYSIS BY TYPE (2025)
FIGURE 159 SOUTH AFRICA MARKET SHARE ANALYSIS BY END USER (2025)
FIGURE 160 GERMANY MARKET SHARE ANALYSIS BY TYPE (2025)
FIGURE 161 GERMANY MARKET SHARE ANALYSIS BY END USER (2025)
FIGURE 162 FRANCE MARKET SHARE ANALYSIS BY TYPE (2025)
FIGURE 163 FRANCE MARKET SHARE ANALYSIS BY END USER (2025)
FIGURE 164 UK MARKET SHARE ANALYSIS BY TYPE (2025)
FIGURE 165 UK MARKET SHARE ANALYSIS BY END USER (2025)
FIGURE 166 SPAIN MARKET SHARE ANALYSIS BY TYPE (2025)
FIGURE 167 SPAIN MARKET SHARE ANALYSIS BY END USER (2025)
FIGURE 168 ITALY MARKET SHARE ANALYSIS BY TYPE (2025)
FIGURE 169 ITALY MARKET SHARE ANALYSIS BY END USER (2025)
FIGURE 170 BRAZIL MARKET SHARE ANALYSIS BY TYPE (2025)
FIGURE 171 BRAZIL MARKET SHARE ANALYSIS BY END USER (2025)
FIGURE 172 ARGENTINA MARKET SHARE ANALYSIS BY TYPE (2025)
FIGURE 173 ARGENTINA MARKET SHARE ANALYSIS BY END USER (2025)
FIGURE 174 COLUMBIA MARKET SHARE ANALYSIS BY TYPE (2025)
FIGURE 175 COLUMBIA MARKET SHARE ANALYSIS BY END USER (2025)
FIGURE 176 GLOBAL REAL-TIME PAYMENT INFRASTRUCTURE MARKET CURRENT AND FUTURE MARKET KEY COUNTRY LEVEL ANALYSIS, 2025–2034, (USD MILLION)
FIGURE 177 FINANCIAL OVERVIEW:
Key Player Analysis
ACI Worldwide, headquartered in Naples, Florida, is the leading independent software vendor for real-time payment infrastructure, serving over 6,000 organizations globally including 19 of the top 20 banks. The company's Enterprise Payments Platform processes a substantial share of global RTP transactions across multiple national rails. ACI logged 42% software-segment growth in Q1 2025, demonstrating that platform-plus-professional-services deals resonate strongly with mid-tier institutions modernizing their payment stacks. ACI's solutions span originating, processing, fraud management, and orchestration, with deployment options across on-premises, private cloud, and public cloud environments. The company's competitive position derives from depth of regulatory and scheme-specific functionality across more than 80 country implementations, including FedNow, RTP Network, UPI, PIX, SEPA Instant, and Faster Payments. ACI's strategic focus through 2025 has been cloud-native modernization and AI-driven fraud detection, with hybrid-cloud orchestrators that allow banks to retire mainframe modules while front-ending customers with instant-payment APIs.
Fiserv, headquartered in Brookfield, Wisconsin, operates one of the broadest real-time payment infrastructure portfolios in the U.S. through its Carat commerce platform, NOW Network, and core banking solutions that serve over 10,000 financial institutions. The company's partnership with Walmart, expanded throughout 2024 and 2025, provides merchants with real-time payment alternatives to three-day card funding lags and represents a flagship example of merchant-driven RTP demand. Fiserv's competitive advantage centers on its dual position as a core banking processor (giving it deep integration into bank back-office systems) and a merchant acquirer (giving it direct relationships with end-consumer payment flows). The company has invested heavily in cloud-native infrastructure and FedNow connectivity since the network's 2023 launch, enabling smaller community banks served by Fiserv to onboard to FedNow rapidly. Fiserv's product roadmap includes AI-driven fraud management, cross-border RTP corridors, and embedded finance APIs.
Mastercard, headquartered in Purchase, New York, occupies a unique position spanning both card scheme rails and real-time account-to-account infrastructure through its 2017 acquisition of Vocalink, the company that operates the U.K. Faster Payments Service and provides RTP technology to multiple national rails. Mastercard's PayPort+ gateway, launched in June 2021 in partnership with Form3, provides payment service providers and financial institutions with flexible access to the U.K. real-time payment infrastructure. In April 2025, Mastercard announced participation in Visa's AI-agent commerce initiative alongside Anthropic, IBM, Microsoft, Mistral AI, OpenAI, and Perplexity, signaling the convergence of AI-driven commerce with real-time settlement. The company's strategic positioning combines proprietary network operation, infrastructure-as-a-service to other operators, and integration with traditional card scheme processing for hybrid commerce flows.
Visa, headquartered in San Francisco, competes in the real-time payment infrastructure market primarily through Visa Direct, the push-payment platform that enables real-time payouts to bank accounts, debit cards, and digital wallets. In April 2025, Visa Direct enhanced payout speed to reach 99% of U.S. accounts in under one minute, defending share as merchants pilot pay-by-bank alternatives. Also in April 2025, Visa partnered with Anthropic, IBM, Microsoft, Mistral AI, OpenAI, and Perplexity to enable AI agents to process payments on Visa's network, opening a new commerce category that will require real-time settlement infrastructure to scale. Visa's competitive strategy in RTP centers on leveraging its global card network reach (over 4 billion cards in circulation) to provide a single integration point for merchants seeking real-time payouts across multiple destination rails, including FedNow, RTP Network, and international instant payment systems.
Market Key Players
ACI WORLDWIDE, INC.
FISERV, INC.
FIS (FIDELITY NATIONAL INFORMATION SERVICES, INC.)
MASTERCARD INCORPORATED
VISA INC.
PAYPAL HOLDINGS, INC.
MONTRAN CORPORATION
RIPPLE LABS, INC.
VOLANTE TECHNOLOGIES
FORM3 LIMITED
STRIPE, INC.
BLOCK, INC. (SQUARE)
TEMENOS AG
FINASTRA
WISE PLC
Others
Drivers
Growing Demand for Instant Payment Experiences
The increasing consumer preference for fast, seamless, and always-available financial transactions is one of the primary drivers of the global real-time payment infrastructure market. Individuals and businesses increasingly expect payments to be processed instantly, regardless of the time or day. Traditional payment systems that require several hours or days for settlement are becoming inadequate in a digitally connected economy where speed and convenience significantly influence user experience.
Financial institutions and payment service providers are therefore investing heavily in real-time payment capabilities to remain competitive and improve customer satisfaction. The ability to transfer funds immediately enhances liquidity management, strengthens customer engagement, and supports new business models. As digital commerce continues to expand globally, the demand for instant payment infrastructure is expected to accelerate substantially.
Government Initiatives and Digital Economy Expansion
Governments and regulatory authorities across multiple regions are actively promoting digital payment ecosystems to improve financial inclusion, enhance transparency, and reduce dependence on cash transactions. National payment modernization programs and supportive regulatory frameworks have encouraged financial institutions to adopt real-time payment technologies and upgrade existing payment systems.
The rapid growth of digital economies is further strengthening the business case for instant payments. Expanding smartphone penetration, increasing internet access, and the rising popularity of mobile wallets are creating favorable conditions for infrastructure development. These initiatives are expected to support long-term market expansion by encouraging widespread adoption among consumers and businesses.
Restraints
High Implementation and Modernization Costs
Deploying real-time payment infrastructure often requires substantial investments in technology upgrades, network enhancements, cybersecurity frameworks, and operational transformation. Many financial institutions continue to rely on legacy systems that were not originally designed to support immediate settlement and 24/7 transaction processing. Modernizing these infrastructures can involve significant capital expenditure and lengthy implementation periods.
Smaller banks and regional financial institutions may face particular challenges due to limited financial and technical resources. Concerns regarding return on investment can delay deployment decisions and reduce adoption rates. These cost-related constraints remain a significant barrier to market growth, especially in developing economies.
Cybersecurity Risks and Fraud Concerns
The speed and continuous availability of real-time payment systems can create new challenges related to fraud prevention and cybersecurity. Since transactions are completed almost instantly, there is limited time available to detect suspicious activities and intervene before funds are transferred. This can increase the exposure of payment ecosystems to sophisticated cyber threats and financial crimes.
Financial institutions must therefore invest heavily in advanced fraud detection systems, behavioral analytics, multi-factor authentication, and real-time monitoring capabilities. Failure to adequately address these risks may undermine consumer confidence and hinder broader adoption. Ensuring secure transaction environments remains a critical challenge for industry stakeholders.
Trends
Increasing Adoption of Cloud-Based Payment Infrastructure
Cloud computing is emerging as a transformative trend within the real-time payment infrastructure market. Financial institutions are increasingly migrating payment operations to cloud-based environments to improve scalability, reduce operational costs, and accelerate deployment timelines. Cloud infrastructure enables organizations to respond more effectively to fluctuating transaction volumes while maintaining system reliability.
The flexibility offered by cloud solutions also supports faster innovation and easier integration with third-party applications through open APIs. As financial institutions seek agile and cost-efficient operational models, cloud-enabled payment infrastructures are expected to gain significant traction across both developed and emerging markets.
Rise of Open Banking and API-Driven Ecosystems
The expansion of open banking frameworks is reshaping the competitive landscape of the payments industry. Banks are increasingly collaborating with fintech companies through application programming interfaces (APIs) to deliver innovative payment experiences and value-added services. API-driven ecosystems facilitate seamless connectivity between institutions, merchants, and consumers.
These developments are fostering greater competition and accelerating product innovation within the real-time payments space. Enhanced interoperability allows businesses to create customized payment solutions tailored to evolving customer expectations. The growing emphasis on collaboration and ecosystem integration is expected to remain a defining trend throughout the forecast period.
Opportunities
Expansion of Cross-Border Real-Time Payments
Cross-border transactions represent one of the most promising opportunities within the global real-time payment infrastructure market. Traditional international payment systems often involve high fees, lengthy settlement periods, and limited transparency. Businesses and consumers are increasingly seeking faster and more cost-effective alternatives for international fund transfers.
Advancements in interoperability standards and collaborative initiatives among financial institutions are enabling the development of cross-border instant payment networks. As global trade and international commerce continue to expand, the ability to facilitate real-time cross-border transactions is expected to generate substantial growth opportunities for payment infrastructure providers.
Financial Inclusion and Emerging Market Potential
Emerging economies offer significant untapped potential for real-time payment infrastructure providers. Large segments of the population in these regions remain underserved by traditional banking systems, creating opportunities for digital payment solutions that expand access to formal financial services. Instant payment platforms can help bridge this gap by enabling affordable and accessible transactions.
Increasing smartphone adoption, favorable demographic trends, and government-led digitalization initiatives are accelerating the transition toward cashless economies. Companies that develop scalable, secure, and locally adapted payment solutions are well positioned to capitalize on the growing demand in these high-potential markets. The pursuit of broader financial inclusion is therefore expected to remain a major source of future market opportunities.
Investment & M&A Activity
The real-time payment infrastructure market recorded approximately USD 8.2 Billion in disclosed M&A and strategic investment activity over the trailing 12 months ending April 2026, reflecting consolidation among independent software vendors and strategic partnerships between traditional payment networks and AI-native commerce platforms. The investment trajectory is shaped by three converging dynamics: regulatory mandates compelling infrastructure modernization (U.S. Treasury's September 2025 electronic disbursement deadline, EU Instant Payments Regulation), the competitive pressure of FedNow's institutional onboarding, and the emergence of AI-agent commerce as a new transaction category.
In April 2025, Visa announced strategic partnerships with Anthropic, IBM, Microsoft, Mistral AI, OpenAI, and Perplexity to enable AI agents to process payments on Visa's network, representing a new infrastructure category at the intersection of large language models, commerce, and real-time settlement. In May 2025, Balance, the financial infrastructure platform for B2B commerce, launched a new real-time payments tool offering retailers instant payment confirmation and simplifying customer experience. The Walmart-Fiserv partnership for merchant RTP alternatives to card funding continues to expand throughout 2025, providing a flagship use case for retail RTP adoption.
Among infrastructure software vendors, ACI Worldwide's 42% Q1 2025 software-segment growth signals continued capital flow into platform modernization. The Clearing House's funding-agent model has expanded participation to community institutions with assets under USD 1 billion at roughly 40% of prior onboarding cost, creating new addressable market for vendors targeting smaller banks. Cross-border RTP corridor development, including bilateral linkages following the UPI-PayNow model and BIS-led Project Nexus interoperability work, continues to attract investment. Government-led digital currency and central bank digital currency (CBDC) initiatives in the EU, UK, China, and Brazil create adjacent infrastructure investment opportunities, although CBDC architectures remain distinct from traditional RTP rails.
Recent Developments
July 2025: One leading U.S. RTP network reported processing over USD 481 billion in quarterly transactions, reflecting accelerating adoption of high-value instant payments. The milestone validates the February 2025 single-payment cap increase to USD 10 million and demonstrates that B2B real-estate closings, supplier finance, and large-value commercial flows are migrating from wire transfer rails to instant settlement infrastructure.
May 2025: Balance, the financial infrastructure platform for B2B commerce, launched a new real-time payments tool that offers retailers instant payment confirmation and simplified customer experience. The launch represents the continuing expansion of B2B-focused RTP infrastructure beyond traditional bank-to-bank flows into merchant and platform contexts.
April 2025: Visa partnered with Anthropic, IBM, Microsoft, Mistral AI, OpenAI, and Perplexity to enable AI agents to process payments on Visa's network, introducing a new commerce category in which autonomous AI systems initiate transactions on behalf of users. The partnership requires real-time settlement infrastructure to operate at AI-decision speeds and signals a major architectural shift in commerce.
April 2025: Visa Direct enhanced payout speed to reach 99% of U.S. accounts in under one minute, defending share as merchants pilot pay-by-bank alternatives. The enhancement reflects competitive pressure from account-to-account RTP rails and demonstrates Visa's strategy of delivering real-time payout performance comparable to dedicated RTP infrastructure.
February 2025: The Clearing House's RTP Network raised its single-payment cap to USD 10 million, opening B2B use cases including real-estate closings, supplier finance, and large-value commercial transactions. The cap increase positions RTP Network competitively against traditional wire transfer rails for high-value flows.
January 2025: Treasury's mandate that federal agencies migrate to electronic disbursements by September 2025 began driving institutional procurement of RTP infrastructure across federal program offices. The mandate guarantees a committed demand corridor for FedNow and complementary RTP infrastructure throughout the calendar year 2025 as agencies complete migration from paper-check disbursement.
Frequently Asked Questions
How big is the Real-Time Payment Infrastructure Market?
The Global Real-Time Payment Infrastructure Market was valued at USD 30.82 Billion in 2024 and USD 38.50 Billion in 2025, and is projected to reach USD 285.50 Billion by 2034, growing at a CAGR of 24.9% from 2026 to 2034. Market growth is driven by rising demand for instant payments, rapid digital transformation in banking, and increasing adoption of cashless transactions worldwide.
Who are the major players in the Real-Time Payment Infrastructure Market?
ACI WORLDWIDE, INC., FISERV, INC., FIS (FIDELITY NATIONAL INFORMATION SERVICES, INC.), MASTERCARD INCORPORATED, VISA INC., PAYPAL HOLDINGS, INC., MONTRAN CORPORATION, RIPPLE LABS, INC., VOLANTE TECHNOLOGIES, FORM3 LIMITED, STRIPE, INC., BLOCK, INC. (SQUARE), TEMENOS AG, FINASTRA, WISE PLC, Others
Which segments covered the Real-Time Payment Infrastructure Market?
By Component, (Solutions, Services), By Deployment Mode, (On-Premises, Cloud-Based, Hybrid Deployment), By End-User Industry, (Banking, Financial Services, and Insurance (BFSI), Retail and E-commerce, Telecommunications, Healthcare, Government and Public Sector, Travel and Hospitality, Utilities and Energy, Media and Entertainment, Transportation and Logistics, Manufacturing, Education, Others), By Payment Type, (Person-to-Person (P2P) Payments, Person-to-Business (P2B) Payments, Business-to-Business (B2B) Payments, Business-to-Consumer (B2C) Payments, Government-to-Person (G2P) Payments, Person-to-Government (P2G) Payments, Cross-Border Real-Time Payments, Merchant Payments, Bill Payments, Others)
How can this market research report help my business make strategic decisions?
Our market research reports provide actionable intelligence, including verified market size data, CAGR projections, competitive benchmarking, and segment-level opportunity analysis. These insights support strategic planning, investment decisions, product development, and market entry strategies for enterprises and startups alike.
How frequently is the data updated?
We continuously monitor industry developments and update our reports to reflect regulatory changes, technological advancements, and macroeconomic shifts. Updated editions ensure you receive the latest market intelligence.

 Aerospace And Defence
 Agriculture
 Automotive And Transportation
 Banking And Finance
 Business
 Chemicals And Materials
 Consumer And Retail
 Electronics And Semiconductors
 Food And Beverages
 Machinery & Equipments
 Manufacturing And Construction
 Medical Devices
 Others
 Pharmaceuticals And Healthcare
 Power And Energy
 Sports
 Technology

, By Deployment Mode (On-Premises, Cloud-Based and Hybrid), By End-User (BFSI, Retail & E-commerce, Telecommunications, Healthcare, Government & Public Sector, Travel & Hospitality, Utilities & Energy, Media & Entertainment, Transportation & Logistics, Manufacturing and Education), By Payment Type (P2P, P2B, B2B, B2C, G2P, P2G, Cross-Border and Merchant Payments) Region & Key Players – Market Dynamics, Competitive Strategies, Emerging Trends and Forecast 2026-2034")
, By Deployment Mode (On-Premises, Cloud-Based and Hybrid), By End-User (BFSI, Retail & E-commerce, Telecommunications, Healthcare, Government & Public Sector, Travel & Hospitality, Utilities & Energy, Media & Entertainment, Transportation & Logistics, Manufacturing and Education), By Payment Type (P2P, P2B, B2B, B2C, G2P, P2G, Cross-Border and Merchant Payments) Region & Key Players – Market Dynamics, Competitive Strategies, Emerging Trends and Forecast 2026-2034")
, By Deployment Mode (On-Premises, Cloud-Based and Hybrid), By End-User (BFSI, Retail & E-commerce, Telecommunications, Healthcare, Government & Public Sector, Travel & Hospitality, Utilities & Energy, Media & Entertainment, Transportation & Logistics, Manufacturing and Education), By Payment Type (P2P, P2B, B2B, B2C, G2P, P2G, Cross-Border and Merchant Payments) Region & Key Players – Market Dynamics, Competitive Strategies, Emerging Trends and Forecast 2026-2034")
, By Deployment Mode (On-Premises, Cloud-Based and Hybrid), By End-User (BFSI, Retail & E-commerce, Telecommunications, Healthcare, Government & Public Sector, Travel & Hospitality, Utilities & Energy, Media & Entertainment, Transportation & Logistics, Manufacturing and Education), By Payment Type (P2P, P2B, B2B, B2C, G2P, P2G, Cross-Border and Merchant Payments) Region & Key Players – Market Dynamics, Competitive Strategies, Emerging Trends and Forecast 2026-2034")
