Recombinant Human Serum Albumin Market Size | 9.7% CAGR Growth
Global Recombinant Human Serum Albumin Market Size, Share & Analysis By Source (Pichia pastoris, Saccharomyces cerevisiae, Oryza Sativa, Others), By Application (Cell Culture, Vaccines, Gene Therapy), By End-User (Biopharma, CROs), Industry Outlook & Forecast 2025–2034
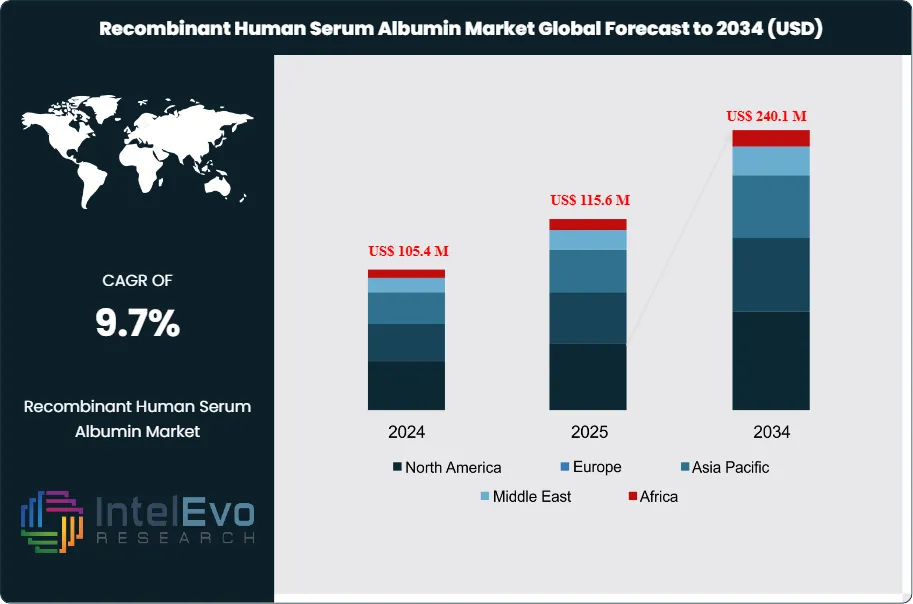
The Recombinant Human Serum Albumin market is estimated at US$ 105.4 Million in 2024 and is on track to reach roughly US$ 240.1 Million by 2034, implying a compound annual growth rate of 9.7% over 2025–2034. Growth has been steady. Industry revenue rose from US$ 75.9 Million in 2020 to US$ 103.4 Million in 2024, an 8.0% CAGR, with sequential gains of US$ 81.5 Million in 2021, US$ 90.3 Million in 2022, and US$ 95.9 Million in 2023. You can expect demand to track the expansion of biologics manufacturing and the shift to animal component–free processes. Recombinant HSA provides a pathogen-free, consistent alternative to plasma-derived albumin, supporting compliance and batch reproducibility in cell culture media, vaccine antigen stabilization, and parenteral formulations.
Demand-side drivers include the scale-up of monoclonal antibodies, vaccines, and gene and cell therapies. rHSA serves as a stabilizer and excipient in these use cases and supports serum-free and chemically defined media. Adoption in advanced therapies is broadening. In March 2023, Recombumin was selected for Heartseed’s HS-001 investigational cell therapy for cardiac remuscularization, highlighting traction in regenerative medicine. Supply-side momentum stems from higher-yield recombinant expression systems, wider use of perfusion and single-use bioreactors, and tighter process analytics that reduce lot variability. These factors improve supply reliability and support cost curves as volumes grow.
Key challenges remain. Prices face pressure from cost-sensitive media formulations. Manufacturers must navigate long validation cycles when switching critical raw materials, often 12 to 18 months, which can delay adoption. Regulatory expectations for traceability and viral safety testing are stringent. Fermentation scale-up and downstream purification capacity can be bottlenecks during rapid demand spikes.
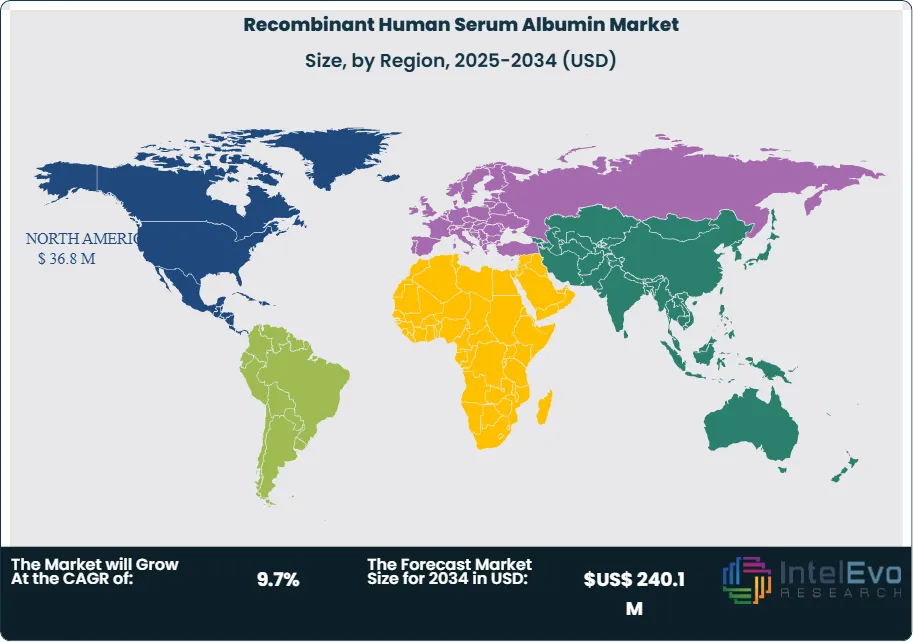
North America led in 2024 with 35.6% share and revenue of US$ 36.8 Million, supported by a dense base of biologics producers and active cell therapy pipelines. Europe follows with strong vaccine and biosimilar infrastructure and consistent GMP standards. Asia Pacific is the investment hotspot to watch. China, South Korea, and India are adding biomanufacturing capacity and are expected to outpace the global average growth through 2034, with mid-to-high single-digit approvals in advanced therapies each year driving media and excipient demand. For investors, facility expansions tied to serum-free processes and partnerships with CDMOs offer the most visible near-term order growth.
Key Takeaways
Market Growth: The global rHSA market reached US$ 105.4 million in 2024 and is projected to hit US$ 240.1 million by 2034 at an 10.7% CAGR. Expansion tracks serum-free process adoption and biologics scale-up across vaccines, mAbs, and cell and gene therapies.
Expression Platform:Pichia pastoris led with 38.7% revenue share in 2024. Users favor its high volumetric yields, robust fermentation performance, and cost alignment for large media runs.
Application:Cell culture media held 34.5% share in 2024. Adoption reflects the shift to chemically defined, animal component–free media to improve batch consistency and reduce pathogen risk.
End Use:Pharmaceutical and biotechnological companies accounted for 54.5% of revenue in 2024. Their cGMP requirements and late-stage biologics pipelines drive recurring, validated demand.
Driver: Demand accelerated as market revenue rose from US$ 75.9 million in 2020 to US$ 103.4 million in 2024, a 36% uplift. rHSA supports stabilization and yield in bioprocessing while enabling serum-free qualification in commercial media.
Restraint: Switching critical raw materials requires lengthy validation. Typical supplier qualification spans 12 to 18 months, which delays adoption and raises switching costs for you and your CDMO partners.
Opportunity: The market adds about US$ 134.7 million in absolute value between 2024 and 2034. Capturing a 5-point share of the 2034 market represents roughly US$ 12 million in annual revenue potential for suppliers with secured GMP capacity.
Trend: rHSA use is extending into advanced therapies and regenerative medicine. In March 2023, Recombumin supported Heartseed’s HS-001 investigational cell therapy, signaling broader uptake in cell-based products and higher-value clinical supply.
Regional Analysis: North America led with 35.6% share in 2024, or about US$ 36.8 million, supported by a dense biologics and cell therapy base. Asia Pacific is the growth hotspot; expanding facilities in China, South Korea, and India are expected to outpace the global CAGR, lifting regional share through 2034.
Source Analysis
Pichia pastoris remains the primary host for recombinant human serum albumin (rHSA) production. It held 38.7% share in 2024, equal to about US$ 40 million of the global market, and is expected to stay above 38% through 2027 as capacity ramps in single-use fermenters. Producers cite high volumetric productivity, with reported expression levels of roughly 5–10 g/L, robust methanol-induction processes, and straightforward downstream polishing that supports consistent GMP supply. You can expect continued preference for Pichia in media-grade and clinical excipient grades where cost, yield, and batch-to-batch consistency matter.
Saccharomyces cerevisiae and Oryza sativa platforms account for most of the remaining volume. Plant-based Oryza systems have gained traction in fully animal component–free workflows and now sit near parity with Pichia in several parenteral applications; adoption should rise as additional lots clear multi-site qualifications. Yeast-based S. cerevisiae remains relevant in specialty grades where specific glycation profiles or legacy validations are in place. Together with “Others,” these sources are projected to grow in the mid to high single digits from 2025 to 2030 as more CDMOs qualify dual-source supply.
Application Analysis
Cell culture media is the largest application, contributing 34.5% of revenue in 2024, or about US$ 35.7 million. rHSA supports cell viability, reduces shear-related stress, and stabilizes growth factors in chemically defined and serum-free media. With biologics manufacturing expanding and more programs moving to intensified and continuous modes, media use of rHSA is set to grow near or above the total market rate; the segment is projected at roughly US$ 38.8 million in 2025.
Therapeutic use cases are scaling. Stem cell therapy, drug formulations, and cryopreservation together accounted for more than 50% of 2024 revenue and are rising with approvals in cell and gene therapies and wider use of nanoparticle and liposomal delivery. Sponsors report double-digit improvements in viable cell density or product stability in certain CHO and vector processes when rHSA is included as a stabilizer. Expect stem cell therapy to be the fastest-growing application through 2030, with a projected high single-digit to low double-digit CAGR as clinical pipelines mature.
End-Use Analysis
Pharmaceutical and biotechnological companies dominate demand with 54.5% share in 2024, or about US$ 56.4 million, reflecting validated use of rHSA as an excipient and process supplement across late-stage programs. On a 2025 market of about US$ 112.4 million, this end-use group should exceed US$ 61 million as more products enter PPQ and commercial manufacturing. Major suppliers include Sartorius (Albumedix Recombumin), Thermo Fisher Scientific, Merck KGaA, and InVitria.
CROs are the next-largest buyers at roughly US$ 28.6 million in 2024. Outsourced development and pilot-scale runs drive steady uptake as CDMOs seek interchangeable grades that shorten tech-transfer timelines. Hospitals and diagnostic laboratories represent smaller but stable demand, concentrated in cryopreservation media, reagent kits, and select specialty formularies. You should plan for CRO demand to grow faster than the market average through 2030 as outsourcing penetrates earlier in the development lifecycle.
Regional Analysis
North America led with 35.6% share in 2024, or about US$ 36.8 million, supported by a dense base of biologics manufacturing and active cell and gene therapy pipelines. The region is projected to expand at roughly 8.4% CAGR through 2034, lifted by capacity additions and continued conversion to animal component–free processes. Europe followed with about US$ 29.3 million in 2024 on the strength of vaccine, biosimilar, and advanced therapy activity across Germany, the U.K., and the Nordics.
Asia Pacific is the key growth market. It reached about US$ 24.7 million in 2024 and is expected to outpace the global CAGR from 2025 onward as China, South Korea, and India add commercial suites and qualify local rHSA supply. Latin America and the Middle East and Africa remain smaller in value but show steady adoption in diagnostic and vaccine programs; these regions provide optionality for suppliers seeking geographic diversification and secondary distribution hubs.
Customization for segments, region/country-level will be provided. Moreover, additional customization can be done based on the requirements.
Pricing and Purchase Options
Avail customized purchase options to meet your exact research needs. We have three licenses to opt for: Single User License, Multi-User License (Up to 5 Users), Corporate Use License (Unlimited User and Printable PDF).
TABLE OF CONTENTS
1. EXECUTIVE SUMMARY
1.1. MARKET SNAPSHOT
1.2. KEY FINDINGS & INSIGHTS
1.3. ANALYST RECOMMENDATIONS
1.4. FUTURE OUTLOOK
2. RESEARCH METHODOLOGY
2.1. MARKET DEFINITION & SCOPE
2.2. RESEARCH OBJECTIVES: PRIMARY & SECONDARY DATA SOURCES
2.3. DATA COLLECTION SOURCES
2.3.1. COVERAGE OF 100+ PRIMARY RESEARCH/CONSULTATION CALLS WITH INDUSTRY STAKEHOLDERS
FIGURE 17 NORTH AMERICA RECOMBINANT HUMAN SERUM ALBUMIN CURRENT AND FUTURE TYPE ANALYSIS, 2025–2034, (USD MILLION)
FIGURE 18 NORTH AMERICA RECOMBINANT HUMAN SERUM ALBUMIN CURRENT AND FUTURE END USER ANALYSIS, 2025–2034, (USD MILLION)
FIGURE 19 MARKET SHARE BY COUNTRY
FIGURE 20 LATIN AMERICA RECOMBINANT HUMAN SERUM ALBUMIN CURRENT AND FUTURE TYPE ANALYSIS, 2025–2034, (USD MILLION)
FIGURE 21 LATIN AMERICA RECOMBINANT HUMAN SERUM ALBUMIN CURRENT AND FUTURE END USER ANALYSIS, 2025–2034, (USD MILLION)
FIGURE 22 MARKET SHARE BY COUNTRY
FIGURE 23 EASTERN EUROPE RECOMBINANT HUMAN SERUM ALBUMIN CURRENT AND FUTURE TYPE ANALYSIS, 2025–2034, (USD MILLION)
FIGURE 24 EASTERN EUROPE RECOMBINANT HUMAN SERUM ALBUMIN CURRENT AND FUTURE END USER ANALYSIS, 2025–2034, (USD MILLION)
FIGURE 25 MARKET SHARE BY COUNTRY
FIGURE 26 WESTERN EUROPE RECOMBINANT HUMAN SERUM ALBUMIN CURRENT AND FUTURE TYPE ANALYSIS, 2025–2034, (USD MILLION)
FIGURE 27 WESTERN EUROPE RECOMBINANT HUMAN SERUM ALBUMIN CURRENT AND FUTURE END USER ANALYSIS, 2025–2034, (USD MILLION)
FIGURE 28 MARKET SHARE BY COUNTRY
FIGURE 29 EAST ASIA AND PACIFIC RECOMBINANT HUMAN SERUM ALBUMIN CURRENT AND FUTURE TYPE ANALYSIS, 2025–2034, (USD MILLION)
FIGURE 30 EAST ASIA AND PACIFIC RECOMBINANT HUMAN SERUM ALBUMIN CURRENT AND FUTURE END USER ANALYSIS, 2025–2034, (USD MILLION)
FIGURE 31 MARKET SHARE BY COUNTRY
FIGURE 32 SEA AND SOUTH ASIA RECOMBINANT HUMAN SERUM ALBUMIN CURRENT AND FUTURE TYPE ANALYSIS, 2025–2034, (USD MILLION)
FIGURE 33 SEA AND SOUTH ASIA RECOMBINANT HUMAN SERUM ALBUMIN CURRENT AND FUTURE END USER ANALYSIS, 2025–2034, (USD MILLION)
FIGURE 34 MARKET SHARE BY COUNTRY
FIGURE 35 MIDDLE EAST AND AFRICA RECOMBINANT HUMAN SERUM ALBUMIN CURRENT AND FUTURE TYPE ANALYSIS, 2025–2034, (USD MILLION)
FIGURE 36 MIDDLE EAST AND AFRICA RECOMBINANT HUMAN SERUM ALBUMIN CURRENT AND FUTURE END USER ANALYSIS, 2025–2034, (USD MILLION)
FIGURE 37 NORTH AMERICA RECOMBINANT HUMAN SERUM ALBUMIN CURRENT AND FUTURE MARKET VOLUME SHARE REGIONAL ANALYSIS, 2025–2034, (USD MILLION)
FIGURE 38 U.S. RECOMBINANT HUMAN SERUM ALBUMIN CURRENT AND FUTURE TYPE ANALYSIS, 2025–2034, (USD MILLION)
FIGURE 39 U.S. RECOMBINANT HUMAN SERUM ALBUMIN CURRENT AND FUTURE END USER ANALYSIS, 2025–2034, (USD MILLION)
FIGURE 40 CANADA RECOMBINANT HUMAN SERUM ALBUMIN CURRENT AND FUTURE TYPE ANALYSIS, 2025–2034, (USD MILLION)
FIGURE 41 CANADA RECOMBINANT HUMAN SERUM ALBUMIN CURRENT AND FUTURE END USER ANALYSIS, 2025–2034, (USD MILLION)
FIGURE 42 LATIN AMERICA RECOMBINANT HUMAN SERUM ALBUMIN CURRENT AND FUTURE MARKET VOLUME SHARE REGIONAL ANALYSIS, 2025–2034, (USD MILLION)
FIGURE 43 MEXICO RECOMBINANT HUMAN SERUM ALBUMIN CURRENT AND FUTURE TYPE ANALYSIS, 2025–2034, (USD MILLION)
FIGURE 44 MEXICO RECOMBINANT HUMAN SERUM ALBUMIN CURRENT AND FUTURE END USER ANALYSIS, 2025–2034, (USD MILLION)
FIGURE 45 BRAZIL RECOMBINANT HUMAN SERUM ALBUMIN CURRENT AND FUTURE TYPE ANALYSIS, 2025–2034, (USD MILLION)
FIGURE 46 BRAZIL RECOMBINANT HUMAN SERUM ALBUMIN CURRENT AND FUTURE END USER ANALYSIS, 2025–2034, (USD MILLION)
FIGURE 47 ARGENTINA RECOMBINANT HUMAN SERUM ALBUMIN CURRENT AND FUTURE TYPE ANALYSIS, 2025–2034, (USD MILLION)
FIGURE 48 ARGENTINA RECOMBINANT HUMAN SERUM ALBUMIN CURRENT AND FUTURE END USER ANALYSIS, 2025–2034, (USD MILLION)
FIGURE 49 COLUMBIA RECOMBINANT HUMAN SERUM ALBUMIN CURRENT AND FUTURE TYPE ANALYSIS, 2025–2034, (USD MILLION)
FIGURE 50 COLUMBIA RECOMBINANT HUMAN SERUM ALBUMIN CURRENT AND FUTURE END USER ANALYSIS, 2025–2034, (USD MILLION)
FIGURE 51 REST OF LATIN AMERICA RECOMBINANT HUMAN SERUM ALBUMIN CURRENT AND FUTURE TYPE ANALYSIS, 2025–2034, (USD MILLION)
FIGURE 52 REST OF LATIN AMERICA RECOMBINANT HUMAN SERUM ALBUMIN CURRENT AND FUTURE END USER ANALYSIS, 2025–2034, (USD MILLION)
FIGURE 53 EASTERN EUROPE RECOMBINANT HUMAN SERUM ALBUMIN CURRENT AND FUTURE MARKET VOLUME SHARE REGIONAL ANALYSIS, 2025–2034, (USD MILLION)
FIGURE 54 POLAND RECOMBINANT HUMAN SERUM ALBUMIN CURRENT AND FUTURE TYPE ANALYSIS, 2025–2034, (USD MILLION)
FIGURE 55 POLAND RECOMBINANT HUMAN SERUM ALBUMIN CURRENT AND FUTURE END USER ANALYSIS, 2025–2034, (USD MILLION)
FIGURE 56 RUSSIA RECOMBINANT HUMAN SERUM ALBUMIN CURRENT AND FUTURE TYPE ANALYSIS, 2025–2034, (USD MILLION)
FIGURE 57 RUSSIA RECOMBINANT HUMAN SERUM ALBUMIN CURRENT AND FUTURE END USER ANALYSIS, 2025–2034, (USD MILLION)
FIGURE 58 CZECH REPUBLIC RECOMBINANT HUMAN SERUM ALBUMIN CURRENT AND FUTURE TYPE ANALYSIS, 2025–2034, (USD MILLION)
FIGURE 59 CZECH REPUBLIC RECOMBINANT HUMAN SERUM ALBUMIN CURRENT AND FUTURE END USER ANALYSIS, 2025–2034, (USD MILLION)
FIGURE 60 ROMANIA RECOMBINANT HUMAN SERUM ALBUMIN CURRENT AND FUTURE TYPE ANALYSIS, 2025–2034, (USD MILLION)
FIGURE 61 ROMANIA RECOMBINANT HUMAN SERUM ALBUMIN CURRENT AND FUTURE END USER ANALYSIS, 2025–2034, (USD MILLION)
FIGURE 62 REST OF EASTERN EUROPE RECOMBINANT HUMAN SERUM ALBUMIN CURRENT AND FUTURE TYPE ANALYSIS, 2025–2034, (USD MILLION)
FIGURE 63 REST OF EASTERN EUROPE RECOMBINANT HUMAN SERUM ALBUMIN CURRENT AND FUTURE END USER ANALYSIS, 2025–2034, (USD MILLION)
FIGURE 64 WESTERN EUROPE RECOMBINANT HUMAN SERUM ALBUMIN CURRENT AND FUTURE MARKET VOLUME SHARE REGIONAL ANALYSIS, 2025–2034, (USD MILLION)
FIGURE 65 GERMANY RECOMBINANT HUMAN SERUM ALBUMIN CURRENT AND FUTURE TYPE ANALYSIS, 2025–2034, (USD MILLION)
FIGURE 66 GERMANY RECOMBINANT HUMAN SERUM ALBUMIN CURRENT AND FUTURE END USER ANALYSIS, 2025–2034, (USD MILLION)
FIGURE 67 FRANCE RECOMBINANT HUMAN SERUM ALBUMIN CURRENT AND FUTURE TYPE ANALYSIS, 2025–2034, (USD MILLION)
FIGURE 68 FRANCE RECOMBINANT HUMAN SERUM ALBUMIN CURRENT AND FUTURE END USER ANALYSIS, 2025–2034, (USD MILLION)
FIGURE 69 UK RECOMBINANT HUMAN SERUM ALBUMIN CURRENT AND FUTURE TYPE ANALYSIS, 2025–2034, (USD MILLION)
FIGURE 70 UK RECOMBINANT HUMAN SERUM ALBUMIN CURRENT AND FUTURE END USER ANALYSIS, 2025–2034, (USD MILLION)
FIGURE 71 SPAIN RECOMBINANT HUMAN SERUM ALBUMIN CURRENT AND FUTURE TYPE ANALYSIS, 2025–2034, (USD MILLION)
FIGURE 72 SPAIN RECOMBINANT HUMAN SERUM ALBUMIN CURRENT AND FUTURE END USER ANALYSIS, 2025–2034, (USD MILLION)
FIGURE 73 ITALY RECOMBINANT HUMAN SERUM ALBUMIN CURRENT AND FUTURE TYPE ANALYSIS, 2025–2034, (USD MILLION)
FIGURE 74 ITALY RECOMBINANT HUMAN SERUM ALBUMIN CURRENT AND FUTURE END USER ANALYSIS, 2025–2034, (USD MILLION)
FIGURE 75 REST OF WESTERN EUROPE RECOMBINANT HUMAN SERUM ALBUMIN CURRENT AND FUTURE TYPE ANALYSIS, 2025–2034, (USD MILLION)
FIGURE 76 REST OF WESTERN EUROPE RECOMBINANT HUMAN SERUM ALBUMIN CURRENT AND FUTURE END USER ANALYSIS, 2025–2034, (USD MILLION)
FIGURE 77 EAST ASIA AND PACIFIC RECOMBINANT HUMAN SERUM ALBUMIN CURRENT AND FUTURE MARKET VOLUME SHARE REGIONAL ANALYSIS, 2025–2034, (USD MILLION)
FIGURE 78 CHINA RECOMBINANT HUMAN SERUM ALBUMIN CURRENT AND FUTURE TYPE ANALYSIS, 2025–2034, (USD MILLION)
FIGURE 79 CHINA RECOMBINANT HUMAN SERUM ALBUMIN CURRENT AND FUTURE END USER ANALYSIS, 2025–2034, (USD MILLION)
FIGURE 80 JAPAN RECOMBINANT HUMAN SERUM ALBUMIN CURRENT AND FUTURE TYPE ANALYSIS, 2025–2034, (USD MILLION)
FIGURE 81 JAPAN RECOMBINANT HUMAN SERUM ALBUMIN CURRENT AND FUTURE END USER ANALYSIS, 2025–2034, (USD MILLION)
FIGURE 82 AUSTRALIA RECOMBINANT HUMAN SERUM ALBUMIN CURRENT AND FUTURE TYPE ANALYSIS, 2025–2034, (USD MILLION)
FIGURE 83 AUSTRALIA RECOMBINANT HUMAN SERUM ALBUMIN CURRENT AND FUTURE END USER ANALYSIS, 2025–2034, (USD MILLION)
FIGURE 84 CAMBODIA RECOMBINANT HUMAN SERUM ALBUMIN CURRENT AND FUTURE TYPE ANALYSIS, 2025–2034, (USD MILLION)
FIGURE 85 CAMBODIA RECOMBINANT HUMAN SERUM ALBUMIN CURRENT AND FUTURE END USER ANALYSIS, 2025–2034, (USD MILLION)
FIGURE 86 FIJI RECOMBINANT HUMAN SERUM ALBUMIN CURRENT AND FUTURE TYPE ANALYSIS, 2025–2034, (USD MILLION)
FIGURE 87 FIJI RECOMBINANT HUMAN SERUM ALBUMIN CURRENT AND FUTURE END USER ANALYSIS, 2025–2034, (USD MILLION)
FIGURE 88 INDONESIA RECOMBINANT HUMAN SERUM ALBUMIN CURRENT AND FUTURE TYPE ANALYSIS, 2025–2034, (USD MILLION)
FIGURE 89 INDONESIA RECOMBINANT HUMAN SERUM ALBUMIN CURRENT AND FUTURE END USER ANALYSIS, 2025–2034, (USD MILLION)
FIGURE 90 SOUTH KOREA RECOMBINANT HUMAN SERUM ALBUMIN CURRENT AND FUTURE TYPE ANALYSIS, 2025–2034, (USD MILLION)
FIGURE 91 SOUTH KOREA RECOMBINANT HUMAN SERUM ALBUMIN CURRENT AND FUTURE END USER ANALYSIS, 2025–2034, (USD MILLION)
FIGURE 92 REST OF EAST ASIA AND PACIFIC RECOMBINANT HUMAN SERUM ALBUMIN CURRENT AND FUTURE TYPE ANALYSIS, 2025–2034, (USD MILLION)
FIGURE 93 REST OF EAST ASIA AND PACIFIC RECOMBINANT HUMAN SERUM ALBUMIN CURRENT AND FUTURE END USER ANALYSIS, 2025–2034, (USD MILLION)
FIGURE 94 SEA AND SOUTH ASIA RECOMBINANT HUMAN SERUM ALBUMIN CURRENT AND FUTURE MARKET VOLUME SHARE REGIONAL ANALYSIS, 2025–2034, (USD MILLION)
FIGURE 95 BANGLADESH RECOMBINANT HUMAN SERUM ALBUMIN CURRENT AND FUTURE TYPE ANALYSIS, 2025–2034, (USD MILLION)
FIGURE 96 BANGLADESH RECOMBINANT HUMAN SERUM ALBUMIN CURRENT AND FUTURE END USER ANALYSIS, 2025–2034, (USD MILLION)
FIGURE 97 NEW ZEALAND RECOMBINANT HUMAN SERUM ALBUMIN CURRENT AND FUTURE TYPE ANALYSIS, 2025–2034, (USD MILLION)
FIGURE 98 NEW ZEALAND RECOMBINANT HUMAN SERUM ALBUMIN CURRENT AND FUTURE END USER ANALYSIS, 2025–2034, (USD MILLION)
FIGURE 99 INDIA RECOMBINANT HUMAN SERUM ALBUMIN CURRENT AND FUTURE TYPE ANALYSIS, 2025–2034, (USD MILLION)
FIGURE 100 INDIA RECOMBINANT HUMAN SERUM ALBUMIN CURRENT AND FUTURE END USER ANALYSIS, 2025–2034, (USD MILLION)
FIGURE 101 SINGAPORE RECOMBINANT HUMAN SERUM ALBUMIN CURRENT AND FUTURE TYPE ANALYSIS, 2025–2034, (USD MILLION)
FIGURE 102 SINGAPORE RECOMBINANT HUMAN SERUM ALBUMIN CURRENT AND FUTURE END USER ANALYSIS, 2025–2034, (USD MILLION)
FIGURE 103 THAILAND RECOMBINANT HUMAN SERUM ALBUMIN CURRENT AND FUTURE TYPE ANALYSIS, 2025–2034, (USD MILLION)
FIGURE 104 THAILAND RECOMBINANT HUMAN SERUM ALBUMIN CURRENT AND FUTURE END USER ANALYSIS, 2025–2034, (USD MILLION)
FIGURE 105 TAIWAN RECOMBINANT HUMAN SERUM ALBUMIN CURRENT AND FUTURE TYPE ANALYSIS, 2025–2034, (USD MILLION)
FIGURE 106 TAIWAN RECOMBINANT HUMAN SERUM ALBUMIN CURRENT AND FUTURE END USER ANALYSIS, 2025–2034, (USD MILLION)
FIGURE 107 MALAYSIA RECOMBINANT HUMAN SERUM ALBUMIN CURRENT AND FUTURE TYPE ANALYSIS, 2025–2034, (USD MILLION)
FIGURE 108 MALAYSIA RECOMBINANT HUMAN SERUM ALBUMIN CURRENT AND FUTURE END USER ANALYSIS, 2025–2034, (USD MILLION)
FIGURE 109 REST OF SEA AND SOUTH ASIA RECOMBINANT HUMAN SERUM ALBUMIN CURRENT AND FUTURE TYPE ANALYSIS, 2025–2034, (USD MILLION)
FIGURE 110 REST OF SEA AND SOUTH ASIA RECOMBINANT HUMAN SERUM ALBUMIN CURRENT AND FUTURE END USER ANALYSIS, 2025–2034, (USD MILLION)
FIGURE 111 MIDDLE EAST AND AFRICA RECOMBINANT HUMAN SERUM ALBUMIN CURRENT AND FUTURE MARKET VOLUME SHARE REGIONAL ANALYSIS, 2025–2034, (USD MILLION)
FIGURE 112 GCC COUNTRIES RECOMBINANT HUMAN SERUM ALBUMIN CURRENT AND FUTURE TYPE ANALYSIS, 2025–2034, (USD MILLION)
FIGURE 113 GCC COUNTRIES RECOMBINANT HUMAN SERUM ALBUMIN CURRENT AND FUTURE END USER ANALYSIS, 2025–2034, (USD MILLION)
FIGURE 114 SAUDI ARABIA RECOMBINANT HUMAN SERUM ALBUMIN CURRENT AND FUTURE TYPE ANALYSIS, 2025–2034, (USD MILLION)
FIGURE 115 SAUDI ARABIA RECOMBINANT HUMAN SERUM ALBUMIN CURRENT AND FUTURE END USER ANALYSIS, 2025–2034, (USD MILLION)
FIGURE 116 UAE RECOMBINANT HUMAN SERUM ALBUMIN CURRENT AND FUTURE TYPE ANALYSIS, 2025–2034, (USD MILLION)
FIGURE 117 UAE RECOMBINANT HUMAN SERUM ALBUMIN CURRENT AND FUTURE END USER ANALYSIS, 2025–2034, (USD MILLION)
FIGURE 118 BAHRAIN RECOMBINANT HUMAN SERUM ALBUMIN CURRENT AND FUTURE TYPE ANALYSIS, 2025–2034, (USD MILLION)
FIGURE 119 BAHRAIN RECOMBINANT HUMAN SERUM ALBUMIN CURRENT AND FUTURE END USER ANALYSIS, 2025–2034, (USD MILLION)
FIGURE 120 KUWAIT RECOMBINANT HUMAN SERUM ALBUMIN CURRENT AND FUTURE TYPE ANALYSIS, 2025–2034, (USD MILLION)
FIGURE 121 KUWAIT RECOMBINANT HUMAN SERUM ALBUMIN CURRENT AND FUTURE END USER ANALYSIS, 2025–2034, (USD MILLION)
FIGURE 122 OMAN RECOMBINANT HUMAN SERUM ALBUMIN CURRENT AND FUTURE TYPE ANALYSIS, 2025–2034, (USD MILLION)
FIGURE 123 OMAN RECOMBINANT HUMAN SERUM ALBUMIN CURRENT AND FUTURE END USER ANALYSIS, 2025–2034, (USD MILLION)
FIGURE 124 QATAR RECOMBINANT HUMAN SERUM ALBUMIN CURRENT AND FUTURE TYPE ANALYSIS, 2025–2034, (USD MILLION)
FIGURE 125 QATAR RECOMBINANT HUMAN SERUM ALBUMIN CURRENT AND FUTURE END USER ANALYSIS, 2025–2034, (USD MILLION)
FIGURE 126 EGYPT RECOMBINANT HUMAN SERUM ALBUMIN CURRENT AND FUTURE TYPE ANALYSIS, 2025–2034, (USD MILLION)
FIGURE 127 EGYPT RECOMBINANT HUMAN SERUM ALBUMIN CURRENT AND FUTURE END USER ANALYSIS, 2025–2034, (USD MILLION)
FIGURE 128 NIGERIA RECOMBINANT HUMAN SERUM ALBUMIN CURRENT AND FUTURE TYPE ANALYSIS, 2025–2034, (USD MILLION)
FIGURE 129 NIGERIA RECOMBINANT HUMAN SERUM ALBUMIN CURRENT AND FUTURE END USER ANALYSIS, 2025–2034, (USD MILLION)
FIGURE 130 SOUTH AFRICA RECOMBINANT HUMAN SERUM ALBUMIN CURRENT AND FUTURE TYPE ANALYSIS, 2025–2034, (USD MILLION)
FIGURE 131 SOUTH AFRICA RECOMBINANT HUMAN SERUM ALBUMIN CURRENT AND FUTURE END USER ANALYSIS, 2025–2034, (USD MILLION)
FIGURE 132 ISRAEL RECOMBINANT HUMAN SERUM ALBUMIN CURRENT AND FUTURE TYPE ANALYSIS, 2025–2034, (USD MILLION)
FIGURE 133 ISRAEL RECOMBINANT HUMAN SERUM ALBUMIN CURRENT AND FUTURE END USER ANALYSIS, 2025–2034, (USD MILLION)
FIGURE 134 REST OF MEA RECOMBINANT HUMAN SERUM ALBUMIN CURRENT AND FUTURE TYPE ANALYSIS, 2025–2034, (USD MILLION)
FIGURE 135 REST OF MEA RECOMBINANT HUMAN SERUM ALBUMIN CURRENT AND FUTURE END USER ANALYSIS, 2025–2034, (USD MILLION)
FIGURE 136 U. S. MARKET SHARE ANALYSIS BY TYPE (2024)
FIGURE 137 U. S. MARKET SHARE ANALYSIS BY END USER (2024)
FIGURE 138 CANADA MARKET SHARE ANALYSIS BY TYPE (2024)
FIGURE 139 CANADA MARKET SHARE ANALYSIS BY END USER (2024)
FIGURE 140 MEXICO MARKET SHARE ANALYSIS BY TYPE (2024)
FIGURE 141 MEXICO MARKET SHARE ANALYSIS BY END USER (2024)
FIGURE 142 CHINA MARKET SHARE ANALYSIS BY TYPE (2024)
FIGURE 143 CHINA MARKET SHARE ANALYSIS BY END USER (2024)
FIGURE 144 JAPAN MARKET SHARE ANALYSIS BY TYPE (2024)
FIGURE 145 JAPAN MARKET SHARE ANALYSIS BY END USER (2024)
FIGURE 146 INDIA MARKET SHARE ANALYSIS BY TYPE (2024)
FIGURE 147 INDIA MARKET SHARE ANALYSIS BY END USER (2024)
FIGURE 148 SOUTH KOREA MARKET SHARE ANALYSIS BY TYPE (2024)
FIGURE 149 SOUTH KOREA MARKET SHARE ANALYSIS BY END USER (2024)
FIGURE 150 SAUDI ARABIA MARKET SHARE ANALYSIS BY TYPE (2024)
FIGURE 151 SAUDI ARABIA MARKET SHARE ANALYSIS BY END USER (2024)
FIGURE 152 UAE MARKET SHARE ANALYSIS BY TYPE (2024)
FIGURE 153 UAE MARKET SHARE ANALYSIS BY END USER (2024)
FIGURE 154 EGYPT MARKET SHARE ANALYSIS BY TYPE (2024)
FIGURE 155 EGYPT MARKET SHARE ANALYSIS BY END USER (2024)
FIGURE 156 NIGERIA MARKET SHARE ANALYSIS BY TYPE (2024)
FIGURE 157 NIGERIA MARKET SHARE ANALYSIS BY END USER (2024)
FIGURE 158 SOUTH AFRICA MARKET SHARE ANALYSIS BY TYPE (2024)
FIGURE 159 SOUTH AFRICA MARKET SHARE ANALYSIS BY END USER (2024)
FIGURE 160 GERMANY MARKET SHARE ANALYSIS BY TYPE (2024)
FIGURE 161 GERMANY MARKET SHARE ANALYSIS BY END USER (2024)
FIGURE 162 FRANCE MARKET SHARE ANALYSIS BY TYPE (2024)
FIGURE 163 FRANCE MARKET SHARE ANALYSIS BY END USER (2024)
FIGURE 164 UK MARKET SHARE ANALYSIS BY TYPE (2024)
FIGURE 165 UK MARKET SHARE ANALYSIS BY END USER (2024)
FIGURE 166 SPAIN MARKET SHARE ANALYSIS BY TYPE (2024)
FIGURE 167 SPAIN MARKET SHARE ANALYSIS BY END USER (2024)
FIGURE 168 ITALY MARKET SHARE ANALYSIS BY TYPE (2024)
FIGURE 169 ITALY MARKET SHARE ANALYSIS BY END USER (2024)
FIGURE 170 BRAZIL MARKET SHARE ANALYSIS BY TYPE (2024)
FIGURE 171 BRAZIL MARKET SHARE ANALYSIS BY END USER (2024)
FIGURE 172 ARGENTINA MARKET SHARE ANALYSIS BY TYPE (2024)
FIGURE 173 ARGENTINA MARKET SHARE ANALYSIS BY END USER (2024)
FIGURE 174 COLUMBIA MARKET SHARE ANALYSIS BY TYPE (2024)
FIGURE 175 COLUMBIA MARKET SHARE ANALYSIS BY END USER (2024)
FIGURE 176 GLOBAL RECOMBINANT HUMAN SERUM ALBUMIN CURRENT AND FUTURE MARKET KEY COUNTRY LEVEL ANALYSIS, 2024–2034, (USD MILLION)
FIGURE 177 FINANCIAL OVERVIEW:
Key Player Analysis
Thermo Fisher Scientific Inc.: Challenger. Thermo Fisher participates in rHSA primarily as an ancillary material embedded in its Cell Therapy Systems portfolio rather than as a standalone excipient line. CTS Dynabeads CD3/CD28 and related immune-cell tools include rHSA as a defined component, with GMP documentation and supply-assurance programs that align with late-stage filings. The company anchors adoption through integrated workflows that pair reagents with automation such as the CTS Rotea counterflow centrifugation system for closed processing. This model ties rHSA consumption to clinical scaling of cell therapies and to standardization of release packages. You benefit from a global GMP footprint and regulatory support that shortens tech-transfer.
Thermo Fisher’s differentiator is platform reach. CTS media, accessories, and documentation enable consistent raw-material specifications across sites, which reduces batch investigations and downtime. The approach positions the company to capture incremental rHSA pull-through as CAR-T and stem-cell programs expand in 2025–2027.
Merck KGaA: Challenger. Merck’s MilliporeSigma business supplies CellPrime rAlbumin, a recombinant HSA expressed in Pichia pastoris and produced in facilities adhering to GMP. The product targets cell culture, cryopreservation, and drug-delivery research, and is provided with COA access and documentation for qualification. This breadth positions Merck as a preferred secondary source where sponsors want dual-vendor strategies for albumin in defined media.
Merck’s edge is portfolio integration across upstream chemicals and media. The company links rHSA supply with ADME tools and bioprocess raw materials, improving continuity for your procurement teams. As serum-free specifications tighten in 2025, CellPrime rAlbumin’s GMP positioning and Pichia expression support faster comparability and reduces change-control risk.
Sartorius AG: Leader. Through Albumedix, Sartorius markets the Recombumin rHSA franchise used as an excipient and process supplement across vaccines, biologics, and advanced therapies. Recombumin is manufactured under ICH Q7 GMP and is USP-NF compliant, with long shelf-life formats for clinical and commercial use. The brand reports extensive in-market dosing, supporting regulatory familiarity and broad qualification.
Strategically, Sartorius has continued to invest in capacity and regional resiliency. The group announced multi-site expansions in 2024–2025, and Albumedix has completed recent upgrade phases at its Nottingham commercial plant in partnership with Scitech to boost throughput. This scale, combined with Sartorius’ bioprocess portfolio and CDMO relationships, gives you a low-risk route to dual-site supply and reliable allocations as cell and gene therapy volumes rise.
ACROBiosystems: Niche player. ACROBiosystems offers recombinant serum albumin across research and premium grades, with product lines validated for FcRn binding, and provides custom GMP-grade protein services aimed at cell-therapy manufacturing. The company’s positioning targets developers that need agile specifications, smaller batch sizes, or rapid turnaround for early clinical programs.
Its differentiator is service flexibility. ACROBiosystems combines catalog rHSA with GMP documentation pathways and tailored specifications, which helps you bridge from preclinical to Phase 1 without a supplier change. As regional programs in Asia and the U.S. scale through 2025, this model captures demand from emerging sponsors that prioritize speed and method fit over long-term volume discounts.
Market Key Players
Abcam Limited
Sartorius AG
Lee Biosolutions, Inc.
Thermo Fisher Scientific Inc.
Atlantis Bioscience Pte Ltd.
Albumin Bioscience
InVitria
ACROBiosystems
Merck KGaA
HiMedia Laboratories
Driver
Rising Critical-Care Demand Accelerates Shift to Recombinant HAS
The demand for recombinant human serum albumin (rHSA) is increasing quickly as global healthcare faces more cases of serious conditions like liver failure and sepsis. With nearly 2 million deaths related to liver issues and 49 million sepsis cases each year, doctors need safer and more reliable sources of albumin to provide effective care. Plasma-derived albumin has limitations in availability, variability between batches, and concerns about transmitting pathogens; rHSA addresses these problems effectively. As a result, hospitals, biopharma companies, and research institutions are increasingly moving toward recombinant solutions to maintain stable supply chains and meet regulatory standards.
rHSA Enhances Consistency and Cuts Variability in Bioprocessing
At the same time, improvements in biomanufacturing and biologic development continue to enhance the importance of rHSA. It is increasingly used in cell culture media, vaccine stabilization, cryopreservation, and injectable formulations, where consistency and purity are vital. Its ability to reduce variability between batches and simplify release investigations lessens the operational load during late-stage development. With spending on biologics research and development rising and regulatory agencies promoting processes free of animal components, the adoption of rHSA is likely to maintain a growth rate of 8–9% annually through 2034, highlighting its strategic value in the pharmaceutical supply chain.
Restraint
High Production Costs and Complex Purification Limit Rapid Adoption
Despite its benefits, the adoption of rHSA faces challenges related to production costs and technical difficulties. Recombinant systems demand advanced fermentation methods, multi-step purification, and stringent quality checks to match or exceed the performance of plasma-derived products. These requirements increase costs by 20–40%, making it harder for manufacturers in cost-sensitive markets, especially in emerging economies. High-density bioprocessing also requires specialized equipment and trained staff, raising both capital and operational expenses for suppliers and users.
Lengthy Supplier Requalification Delays Switching and Increases Risk
Regulatory and operational challenges slow market entry. Transitioning from plasma-derived albumin to rHSA involves extensive comparability studies, supplier audits, and material requalification; these processes can take 12–18 months. Such lengthy timelines deter quick transitions and often benefit established suppliers already integrated into existing processes. As global portfolios of biologics expand, these obstacles can hinder modernization efforts, forcing procurement teams to plan for longer technology transfer periods, increased initial costs, and strict quality control cycles.
Opportunity
Cell & Gene Therapy Workflows Create Major Growth Potential for rHSA
Cell and gene therapy (CGT) offers the most promising growth opportunity for rHSA in the next decade. Regulatory agencies expect double-digit annual approvals for advanced therapies, leading manufacturers to expand allogeneic and autologous platforms that need serum-free, high-purity materials. rHSA is crucial for stabilizing cells, viral vectors, and biologic components during development and production. With CGT workflows expected to grow by 12–15% annually through 2030, demand for rHSA from this area alone could yield an additional US$ 40–45 million in revenue by the end of the decade.
GMP Capacity and Long-Term Supply Deals Offer Strong Revenue Upside
In addition to therapeutic applications, rHSA use is increasing in formulation science, controlled-release technologies, and new cryopreservation systems. Companies that invest early in good manufacturing practice (GMP) production capacity, dual-site manufacturing, and long-term supply contracts will be well-positioned to meet the needs of CGT developers, vaccine producers, and contract development and manufacturing organizations (CDMOs) seeking reliable supply. As the global market approaches US$ 171 million by 2030, vendors with strong compliance support and scalability will gain a lasting competitive advantage with minimal risk of displacement.
Trend
Shift Toward Serum-Free, Chemically Defined Processes Boosts rHSA Use
The biopharmaceutical industry is rapidly moving toward animal component–free (ACF) and chemically defined (CD) workflows to boost consistency and meet regulatory requirements. By 2025, over 60% of new biologics programs will specify serum-free media, placing rHSA at the heart of formulation plans. Yeast-based platforms, especially Pichia pastoris, are becoming the preferred expression systems due to their 5–10 g/L yields, dependable scalability, and strong safety profiles against viruses. This industry shift is changing supplier competitiveness and speeding up the transition to high-purity recombinant excipients.
Yeast-Based Platforms and Localized Capacity Strengthen Supply Security
At the same time, CDMOs and media suppliers are increasing single-use fermentation and perfusion processing capabilities across North America and Asia to localize production and reduce logistical risks. Regulatory demands for transparency, dual-site manufacturing, and validated viral safety documentation are influencing partner choices more than ever before. As procurement leaders focus on sustainability, supply chain stability, and consistent quality, rHSA suppliers that can provide automated, traceable, and globally compliant production will set the stage for the next level of market leadership.
Recent Developments
Dec 2024 – Merck KGaA (MilliporeSigma Process Solutions): Merck signed an agreement to acquire HUB Organoids B.V., a leader in organoid models and services, with closing targeted for late December 2024. The deal expands Merck’s advanced cell modeling portfolio that relies on serum-free workflows where recombinant albumin is a common supplement. It strengthens Merck’s position across upstream media and documentation suites, creating cross-sell pull for CellPrime rAlbumin in organoid and cell therapy programs.
Feb 2025 – InVitria: InVitria introduced Optibumin 25, a 25 percent recombinant human serum albumin offered in closed-system liquid bags for GMP manufacturing. Application notes released the same month highlight performance in low-DMSO cryopreservation and cell retention use cases in CGT workflows. The launch broadens albumin options beyond 10 percent solutions and targets faster tech transfer into closed systems for you and your CDMO partners.
Apr 2025 – Thermo Fisher Scientific: Thermo Fisher opened an Advanced Therapies Collaboration Center in Greater San Diego to accelerate cell therapy development through process design and regulatory support. The center integrates raw-material qualification within end-to-end CTS workflows, which can increase adoption of animal-origin-free excipients such as recombinant HSA in formulation and cryopreservation.
Jul 2025 – Healthgen Biotech (Oryzogen): China’s NMPA approved the first rice-derived recombinant human albumin injection for hypoalbuminemia in cirrhosis, packaged as 10 g (20 percent, 50 mL). Industry groups noted the indication covers a subset of albumin use today, but the approval marks a regulatory milestone that could expand clinical rHSA adoption in Asia.
Sep 2025 – Sartorius (Albumedix): Albumedix completed two phases of expansion at its Nottingham Commercial Albumin Production Plant, adding downstream purification capacity and upgraded clean utilities. The project increases manufacturing resilience for Recombumin supply and improves lead-time reliability for late-stage biologics and CGT customers.

 Aerospace And Defence
 Agriculture
 Automotive And Transportation
 Banking And Finance
 Business
 Chemicals And Materials
 Consumer And Retail
 Electronics And Semiconductors
 Food And Beverages
 Machinery & Equipments
 Manufacturing And Construction
 Medical Devices
 Others
 Pharmaceuticals And Healthcare
 Power And Energy
 Sports
 Technology

, By Application (Cell Culture, Vaccines, Gene Therapy), By End-User (Biopharma, CROs), Industry Outlook & Forecast 2025–2034")
, By Application (Cell Culture, Vaccines, Gene Therapy), By End-User (Biopharma, CROs), Industry Outlook & Forecast 2025–2034")
, By Application (Cell Culture, Vaccines, Gene Therapy), By End-User (Biopharma, CROs), Industry Outlook & Forecast 2025–2034")
, By Application (Cell Culture, Vaccines, Gene Therapy), By End-User (Biopharma, CROs), Industry Outlook & Forecast 2025–2034")

