Global Refurbished Data Centers Market Size, Share & Industry Analysis By Component (Hardware, DCIM Software, Services), By Hardware Type (Power Systems, Cooling Systems, Servers, Networking Devices, Racks), By Deployment Model (On-Premises, Cloud), By Data Center Type (Colocation, Hyperscale, Edge, Modular), By Tier Level (Tier I–IV), By Industry (BFSI, IT & Telecom, Healthcare, Government), Competitive Landscape, Market Trends & Forecast 2025–2034
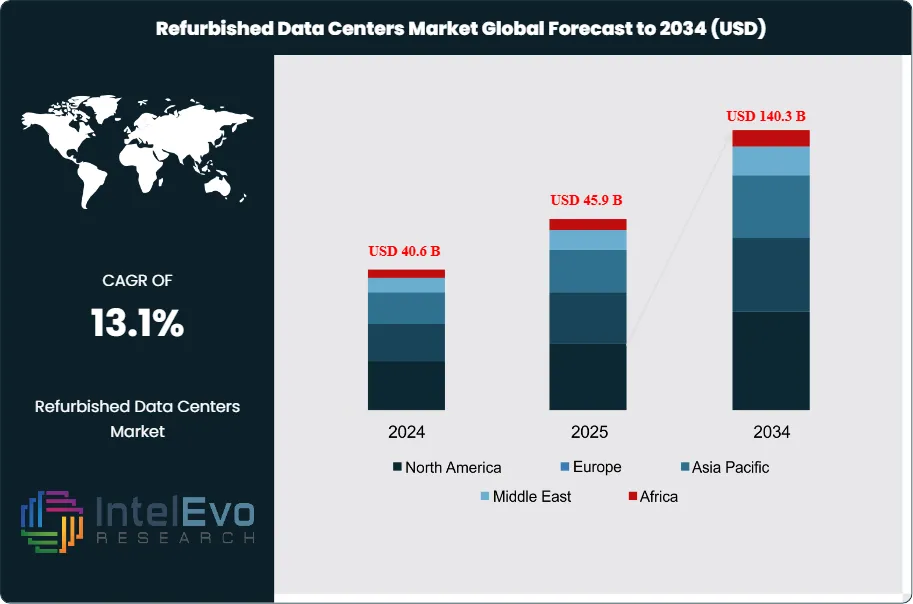
The Refurbished Data Centers Market was valued at USD 40.6 Billion in 2024 and is projected to reach approximately USD 140.3 Billion by 2034. The market is estimated to grow to around USD 45.9 Billion in 2025. Based on projected expansion from 2026 onward, the industry is expected to register a compound annual growth rate (CAGR) of approximately 13.1% during 2026–2034.
Refurbished data centers extend asset life through targeted modernization, capacity refresh, and reuse of restored equipment that performs to near-new specifications. This model lowers total project cost and shortens deployment cycles versus greenfield builds. Buyers also value waste reduction and lower embodied carbon, since reuse limits demand for newly manufactured components and reduces end-of-life disposal volumes.
Demand rises as enterprises face higher prices for new servers, networking, and power infrastructure, while also tightening capital discipline. Refurbished servers and related systems can cost up to 80% less than new equivalents, enabling faster capacity additions for storage, enterprise applications, and disaster recovery. Medium to large enterprises drive adoption, with healthcare, financial services, and technology among the most active users due to rising data volumes, compliance needs, and uptime requirements. Supply growth follows the steady release of decommissioned assets from hyperscale operators and large colocation providers, which supports a deeper secondary market and more consistent quality tiers.
Technology shifts also shape procurement. AI, automation, and digitalization increase rack density and monitoring requirements, and refurbishment providers respond with upgrades to power distribution, cooling, and DCIM tooling. Predictive maintenance based on telemetry and AI-assisted operations improves reliability and reduces unplanned downtime. At the same time, AI-centric workloads can expose limits in older architectures, pushing demand toward certified refurbishment with stress testing, firmware governance, and performance validation.
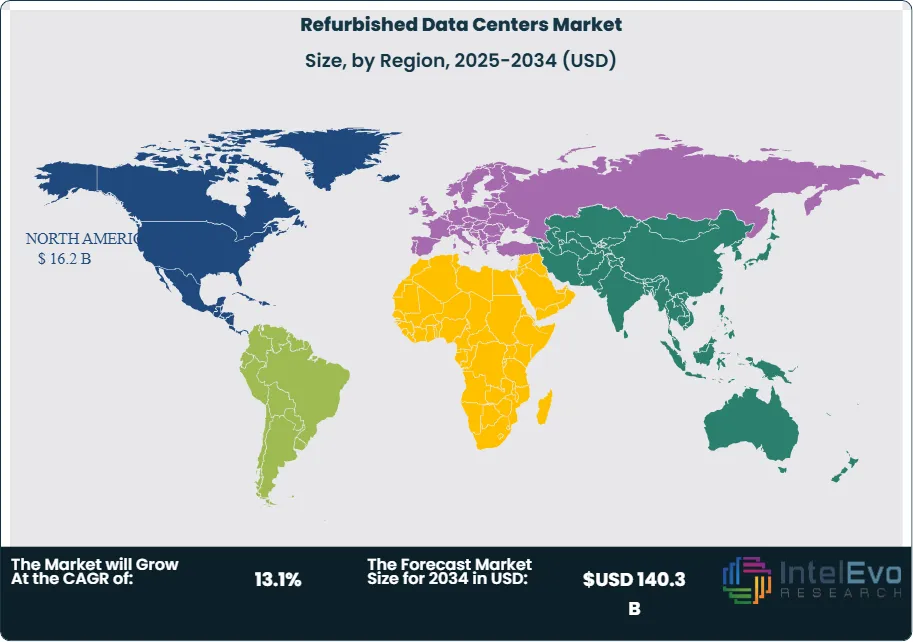
North America led in 2024 with more than 40.0% share and USD 16.2 billion in revenue, supported by the US market at USD 12.99 billion. Secondary US hubs with strong fiber access and power availability attract incremental retrofit capital. Europe benefits from stricter ESG reporting, right-to-repair momentum, and e-waste controls that favor circular procurement. Asia-Pacific shows accelerating interest, with India and Southeast Asia emerging as investment hotspots as enterprises seek faster capacity without long permitting cycles.
Competitive dynamics track adjacent markets. The AI Data Center Market reached USD 14.3 billion in 2024 and targets USD 157.3 billion by 2034, while global colocation expands from USD 57.2 billion in 2023 to USD 227.4 billion by 2033, reinforcing demand for scalable infrastructure. Key risks include supply variability, warranty quality, cybersecurity exposure from legacy components, and evolving energy-efficiency rules that raise retrofit scope and compliance costs.
Key Takeaways
Market Growth: The U.S. refurbished data center market grows at 11.5% CAGR, 2024-2034. North America delivers 16.2 billion USD revenue, 2024.
Segment Dominance : Hardware leads with 45.6% share, 2024, driven by refurbished servers, storage, and networking demand. Large-scale sites dominate with 52.8% share, 2024.
Segment Dominance: Colocation secures 35.7% share, 2024, as firms prioritize lower build costs. Tier 3 facilities hold 43.6% share, 2024, balancing resilience and price.
Driver: Buyers adopt refurbishment to cut infrastructure outlay, estimated: 30.0% capex savings, 2024. Sustainability mandates also influence procurement, estimated: 25.0% increase in circular-IT adoption, 2024.
Restraint: Operators face quality and warranty variability, estimated: 2.0% higher failure risk vs. new equipment, 2024. Cybersecurity exposure from legacy components adds risk, estimated: 12.0% higher patch-lag incidence, 2024.
Opportunity: Providers can expand certified refurbishment and lifecycle services, estimated: 18.0% services revenue uplift potential, 2024-2034. AI-ready retrofits for power and cooling create incremental demand, estimated: 3.0 billion USD incremental TAM, 2034.
Trend: Enterprises accelerate consolidation into Tier 3 footprints and colocation-based refresh cycles, estimated: 15.0% annual retrofit activity growth, 2024-2034. Automation in monitoring and maintenance rises, estimated: 40.0% DCIM adoption rate, 2024.
Regional Analysis: North America leads with 40.0% share, 2024, and 16.2 billion USD revenue, 2024. The U.S. contributes 12.99 billion USD, 2024, anchoring regional scale and procurement velocity.
By Type
Hardware continues to represent the core of spending in the refurbished data center market as the industry moves through 2025 and beyond. In 2024, hardware accounted for 45.6% of total revenue, driven by sustained demand for refurbished servers, storage systems, networking devices, power units, and racks. You see this preference because refreshed hardware delivers comparable throughput and reliability at a fraction of the cost of new equipment, often lowering acquisition expenses by 50% to 80%.
As AI inference, edge workloads, and data-intensive enterprise applications expand, you increasingly require hardware with higher core density, faster interconnects, and improved power efficiency. Refurbished systems that incorporate updated processors, solid-state storage, and energy-efficient networking meet these needs while aligning with sustainability targets. This balance positions hardware as the primary value contributor within refurbished deployments through the next decade.
By Application
Infrastructure hosting and enterprise workload support remain the primary applications for refurbished data centers. In 2024, colocation-related usage dominated, accounting for 35.7% of deployments, as you seek reliable capacity without committing to new builds. Refurbished facilities supply ready-to-use power, cooling, and security while shortening deployment timelines.
Hybrid environments also expand rapidly. You increasingly pair refurbished on-premise or colocation assets with public cloud platforms to control latency and cost. This approach supports disaster recovery, AI model training support, and regional data residency needs, especially as digital services scale across sectors.
By End-Use
Large enterprises continue to lead adoption, representing 52.8% of refurbished data center demand in 2024. You favor large-scale sites because they deliver stronger connectivity options, access to multiple carriers, and higher power availability. These attributes support data-heavy workloads across analytics, cloud services, and content delivery.
Mid-sized enterprises follow closely as budget pressure intensifies. Refurbished environments allow you to expand processing capacity without absorbing the financial risk of new infrastructure, while still meeting uptime and compliance expectations.
By Region
North America remains the largest regional market, holding over 40.0% share and generating USD 16.2 billion in revenue in 2024. You benefit from a mature digital ecosystem, strong hyperscale presence, and strict energy and e-waste regulations that favor reuse. The United States alone contributed USD 12.99 billion and continues to anchor regional demand.
Europe advances steadily as sustainability regulation tightens, while Asia Pacific emerges as the fastest-growing region beyond 2025. You see rising adoption in India, Southeast Asia, and parts of the Middle East as enterprises pursue rapid capacity expansion without long construction cycles. These regions increasingly view refurbished data centers as a practical route to support cloud growth, AI workloads, and national digital programs.
By Component (Hardware, DCIM (Data Center Infrastructure Management) Software, Services), By Data Center Type (Colocation, Hyperscale, Edge, Others (Managed, Modular)), By Tier Level (Tier 1 and Tier 2, Tier 3, Tier 4), By Data Center Size (Small, Medium, Large), By Industry (BFSI, IT & Telecom, Healthcare, Government, Manufacturing, Retail & E-commerce, Others (Media & Entertainment))
Research Methodology
Primary Research- 100 Interviews of Stakeholders
Secondary Research
Desk Research
Regional scope
North America (United States, Canada, Mexico)
Latin America (Brazil, Argentina, Columbia)
East Asia And Pacific (China, Japan, South Korea, Australia, Cambodia, Fiji, Indonesia)
Sea And South Asia (India, Singapore, Thailand, Taiwan, Malaysia)
Eastern Europe (Poland, Russia, Czech Republic, Romania)
Western Europe (Germany, U.K., France, Spain, Itlay)
Middle East & Africa (GCC Countries, Egypt, Nigeria, South Africa, Israel)
Competitive Landscape
Huawei Technologies Co., Ltd., Dell Technologies Inc., Apto Solutions Inc., Inspur Group, Cisco Systems, Inc., Fujitsu, Lenovo, Super Micro Computer, Inc., Hewlett Packard Enterprise Development LP, International Business Machines Corporation, Others,
Customization Scope
Customization for segments, region/country-level will be provided. Moreover, additional customization can be done based on the requirements.
Pricing and Purchase Options
Avail customized purchase options to meet your exact research needs. We have three licenses to opt for: Single User License, Multi-User License (Up to 5 Users), Corporate Use License (Unlimited User and Printable PDF).
TABLE OF CONTENTS
1. EXECUTIVE SUMMARY
1.1. MARKET SNAPSHOT
1.2. KEY FINDINGS & INSIGHTS
1.3. ANALYST RECOMMENDATIONS
1.4. FUTURE OUTLOOK
2. RESEARCH METHODOLOGY
2.1. MARKET DEFINITION & SCOPE
2.2. RESEARCH OBJECTIVES: PRIMARY & SECONDARY DATA SOURCES
2.3. DATA COLLECTION SOURCES
2.3.1. COVERAGE OF 100+ PRIMARY RESEARCH/CONSULTATION CALLS WITH INDUSTRY STAKEHOLDERS
FIGURE 17 NORTH AMERICA REFURBISHED DATA CENTERSCURRENT AND FUTURE TYPE ANALYSIS, 2025–2034, (USD MILLION)
FIGURE 18 NORTH AMERICA REFURBISHED DATA CENTERSCURRENT AND FUTURE END USER ANALYSIS, 2025–2034, (USD MILLION)
FIGURE 19 MARKET SHARE BY COUNTRY
FIGURE 20 LATIN AMERICA REFURBISHED DATA CENTERSCURRENT AND FUTURE TYPE ANALYSIS, 2025–2034, (USD MILLION)
FIGURE 21 LATIN AMERICA REFURBISHED DATA CENTERSCURRENT AND FUTURE END USER ANALYSIS, 2025–2034, (USD MILLION)
FIGURE 22 MARKET SHARE BY COUNTRY
FIGURE 23 EASTERN EUROPE REFURBISHED DATA CENTERSCURRENT AND FUTURE TYPE ANALYSIS, 2025–2034, (USD MILLION)
FIGURE 24 EASTERN EUROPE REFURBISHED DATA CENTERSCURRENT AND FUTURE END USER ANALYSIS, 2025–2034, (USD MILLION)
FIGURE 25 MARKET SHARE BY COUNTRY
FIGURE 26 WESTERN EUROPE REFURBISHED DATA CENTERSCURRENT AND FUTURE TYPE ANALYSIS, 2025–2034, (USD MILLION)
FIGURE 27 WESTERN EUROPE REFURBISHED DATA CENTERSCURRENT AND FUTURE END USER ANALYSIS, 2025–2034, (USD MILLION)
FIGURE 28 MARKET SHARE BY COUNTRY
FIGURE 29 EAST ASIA AND PACIFIC REFURBISHED DATA CENTERSCURRENT AND FUTURE TYPE ANALYSIS, 2025–2034, (USD MILLION)
FIGURE 30 EAST ASIA AND PACIFIC REFURBISHED DATA CENTERSCURRENT AND FUTURE END USER ANALYSIS, 2025–2034, (USD MILLION)
FIGURE 31 MARKET SHARE BY COUNTRY
FIGURE 32 SEA AND SOUTH ASIA REFURBISHED DATA CENTERSCURRENT AND FUTURE TYPE ANALYSIS, 2025–2034, (USD MILLION)
FIGURE 33 SEA AND SOUTH ASIA REFURBISHED DATA CENTERSCURRENT AND FUTURE END USER ANALYSIS, 2025–2034, (USD MILLION)
FIGURE 34 MARKET SHARE BY COUNTRY
FIGURE 35 MIDDLE EAST AND AFRICA REFURBISHED DATA CENTERSCURRENT AND FUTURE TYPE ANALYSIS, 2025–2034, (USD MILLION)
FIGURE 36 MIDDLE EAST AND AFRICA REFURBISHED DATA CENTERSCURRENT AND FUTURE END USER ANALYSIS, 2025–2034, (USD MILLION)
FIGURE 37 NORTH AMERICA REFURBISHED DATA CENTERSCURRENT AND FUTURE MARKET VOLUME SHARE REGIONAL ANALYSIS, 2025–2034, (USD MILLION)
FIGURE 38 U.S. REFURBISHED DATA CENTERSCURRENT AND FUTURE TYPE ANALYSIS, 2025–2034, (USD MILLION)
FIGURE 39 U.S. REFURBISHED DATA CENTERSCURRENT AND FUTURE END USER ANALYSIS, 2025–2034, (USD MILLION)
FIGURE 40 CANADA REFURBISHED DATA CENTERSCURRENT AND FUTURE TYPE ANALYSIS, 2025–2034, (USD MILLION)
FIGURE 41 CANADA REFURBISHED DATA CENTERSCURRENT AND FUTURE END USER ANALYSIS, 2025–2034, (USD MILLION)
FIGURE 42 LATIN AMERICA REFURBISHED DATA CENTERSCURRENT AND FUTURE MARKET VOLUME SHARE REGIONAL ANALYSIS, 2025–2034, (USD MILLION)
FIGURE 43 MEXICO REFURBISHED DATA CENTERSCURRENT AND FUTURE TYPE ANALYSIS, 2025–2034, (USD MILLION)
FIGURE 44 MEXICO REFURBISHED DATA CENTERSCURRENT AND FUTURE END USER ANALYSIS, 2025–2034, (USD MILLION)
FIGURE 45 BRAZIL REFURBISHED DATA CENTERSCURRENT AND FUTURE TYPE ANALYSIS, 2025–2034, (USD MILLION)
FIGURE 46 BRAZIL REFURBISHED DATA CENTERSCURRENT AND FUTURE END USER ANALYSIS, 2025–2034, (USD MILLION)
FIGURE 47 ARGENTINA REFURBISHED DATA CENTERSCURRENT AND FUTURE TYPE ANALYSIS, 2025–2034, (USD MILLION)
FIGURE 48 ARGENTINA REFURBISHED DATA CENTERSCURRENT AND FUTURE END USER ANALYSIS, 2025–2034, (USD MILLION)
FIGURE 49 COLUMBIA REFURBISHED DATA CENTERSCURRENT AND FUTURE TYPE ANALYSIS, 2025–2034, (USD MILLION)
FIGURE 50 COLUMBIA REFURBISHED DATA CENTERSCURRENT AND FUTURE END USER ANALYSIS, 2025–2034, (USD MILLION)
FIGURE 51 REST OF LATIN AMERICA REFURBISHED DATA CENTERSCURRENT AND FUTURE TYPE ANALYSIS, 2025–2034, (USD MILLION)
FIGURE 52 REST OF LATIN AMERICA REFURBISHED DATA CENTERSCURRENT AND FUTURE END USER ANALYSIS, 2025–2034, (USD MILLION)
FIGURE 53 EASTERN EUROPE REFURBISHED DATA CENTERSCURRENT AND FUTURE MARKET VOLUME SHARE REGIONAL ANALYSIS, 2025–2034, (USD MILLION)
FIGURE 54 POLAND REFURBISHED DATA CENTERSCURRENT AND FUTURE TYPE ANALYSIS, 2025–2034, (USD MILLION)
FIGURE 55 POLAND REFURBISHED DATA CENTERSCURRENT AND FUTURE END USER ANALYSIS, 2025–2034, (USD MILLION)
FIGURE 56 RUSSIA REFURBISHED DATA CENTERSCURRENT AND FUTURE TYPE ANALYSIS, 2025–2034, (USD MILLION)
FIGURE 57 RUSSIA REFURBISHED DATA CENTERSCURRENT AND FUTURE END USER ANALYSIS, 2025–2034, (USD MILLION)
FIGURE 58 CZECH REPUBLIC REFURBISHED DATA CENTERSCURRENT AND FUTURE TYPE ANALYSIS, 2025–2034, (USD MILLION)
FIGURE 59 CZECH REPUBLIC REFURBISHED DATA CENTERSCURRENT AND FUTURE END USER ANALYSIS, 2025–2034, (USD MILLION)
FIGURE 60 ROMANIA REFURBISHED DATA CENTERSCURRENT AND FUTURE TYPE ANALYSIS, 2025–2034, (USD MILLION)
FIGURE 61 ROMANIA REFURBISHED DATA CENTERSCURRENT AND FUTURE END USER ANALYSIS, 2025–2034, (USD MILLION)
FIGURE 62 REST OF EASTERN EUROPE REFURBISHED DATA CENTERSCURRENT AND FUTURE TYPE ANALYSIS, 2025–2034, (USD MILLION)
FIGURE 63 REST OF EASTERN EUROPE REFURBISHED DATA CENTERSCURRENT AND FUTURE END USER ANALYSIS, 2025–2034, (USD MILLION)
FIGURE 64 WESTERN EUROPE REFURBISHED DATA CENTERSCURRENT AND FUTURE MARKET VOLUME SHARE REGIONAL ANALYSIS, 2025–2034, (USD MILLION)
FIGURE 65 GERMANY REFURBISHED DATA CENTERSCURRENT AND FUTURE TYPE ANALYSIS, 2025–2034, (USD MILLION)
FIGURE 66 GERMANY REFURBISHED DATA CENTERSCURRENT AND FUTURE END USER ANALYSIS, 2025–2034, (USD MILLION)
FIGURE 67 FRANCE REFURBISHED DATA CENTERSCURRENT AND FUTURE TYPE ANALYSIS, 2025–2034, (USD MILLION)
FIGURE 68 FRANCE REFURBISHED DATA CENTERSCURRENT AND FUTURE END USER ANALYSIS, 2025–2034, (USD MILLION)
FIGURE 69 UK REFURBISHED DATA CENTERSCURRENT AND FUTURE TYPE ANALYSIS, 2025–2034, (USD MILLION)
FIGURE 70 UK REFURBISHED DATA CENTERSCURRENT AND FUTURE END USER ANALYSIS, 2025–2034, (USD MILLION)
FIGURE 71 SPAIN REFURBISHED DATA CENTERSCURRENT AND FUTURE TYPE ANALYSIS, 2025–2034, (USD MILLION)
FIGURE 72 SPAIN REFURBISHED DATA CENTERSCURRENT AND FUTURE END USER ANALYSIS, 2025–2034, (USD MILLION)
FIGURE 73 ITALY REFURBISHED DATA CENTERSCURRENT AND FUTURE TYPE ANALYSIS, 2025–2034, (USD MILLION)
FIGURE 74 ITALY REFURBISHED DATA CENTERSCURRENT AND FUTURE END USER ANALYSIS, 2025–2034, (USD MILLION)
FIGURE 75 REST OF WESTERN EUROPE REFURBISHED DATA CENTERSCURRENT AND FUTURE TYPE ANALYSIS, 2025–2034, (USD MILLION)
FIGURE 76 REST OF WESTERN EUROPE REFURBISHED DATA CENTERSCURRENT AND FUTURE END USER ANALYSIS, 2025–2034, (USD MILLION)
FIGURE 77 EAST ASIA AND PACIFIC REFURBISHED DATA CENTERSCURRENT AND FUTURE MARKET VOLUME SHARE REGIONAL ANALYSIS, 2025–2034, (USD MILLION)
FIGURE 78 CHINA REFURBISHED DATA CENTERSCURRENT AND FUTURE TYPE ANALYSIS, 2025–2034, (USD MILLION)
FIGURE 79 CHINA REFURBISHED DATA CENTERSCURRENT AND FUTURE END USER ANALYSIS, 2025–2034, (USD MILLION)
FIGURE 80 JAPAN REFURBISHED DATA CENTERSCURRENT AND FUTURE TYPE ANALYSIS, 2025–2034, (USD MILLION)
FIGURE 81 JAPAN REFURBISHED DATA CENTERSCURRENT AND FUTURE END USER ANALYSIS, 2025–2034, (USD MILLION)
FIGURE 82 AUSTRALIA REFURBISHED DATA CENTERSCURRENT AND FUTURE TYPE ANALYSIS, 2025–2034, (USD MILLION)
FIGURE 83 AUSTRALIA REFURBISHED DATA CENTERSCURRENT AND FUTURE END USER ANALYSIS, 2025–2034, (USD MILLION)
FIGURE 84 CAMBODIA REFURBISHED DATA CENTERSCURRENT AND FUTURE TYPE ANALYSIS, 2025–2034, (USD MILLION)
FIGURE 85 CAMBODIA REFURBISHED DATA CENTERSCURRENT AND FUTURE END USER ANALYSIS, 2025–2034, (USD MILLION)
FIGURE 86 FIJI REFURBISHED DATA CENTERSCURRENT AND FUTURE TYPE ANALYSIS, 2025–2034, (USD MILLION)
FIGURE 87 FIJI REFURBISHED DATA CENTERSCURRENT AND FUTURE END USER ANALYSIS, 2025–2034, (USD MILLION)
FIGURE 88 INDONESIA REFURBISHED DATA CENTERSCURRENT AND FUTURE TYPE ANALYSIS, 2025–2034, (USD MILLION)
FIGURE 89 INDONESIA REFURBISHED DATA CENTERSCURRENT AND FUTURE END USER ANALYSIS, 2025–2034, (USD MILLION)
FIGURE 90 SOUTH KOREA REFURBISHED DATA CENTERSCURRENT AND FUTURE TYPE ANALYSIS, 2025–2034, (USD MILLION)
FIGURE 91 SOUTH KOREA REFURBISHED DATA CENTERSCURRENT AND FUTURE END USER ANALYSIS, 2025–2034, (USD MILLION)
FIGURE 92 REST OF EAST ASIA AND PACIFIC REFURBISHED DATA CENTERSCURRENT AND FUTURE TYPE ANALYSIS, 2025–2034, (USD MILLION)
FIGURE 93 REST OF EAST ASIA AND PACIFIC REFURBISHED DATA CENTERSCURRENT AND FUTURE END USER ANALYSIS, 2025–2034, (USD MILLION)
FIGURE 94 SEA AND SOUTH ASIA REFURBISHED DATA CENTERSCURRENT AND FUTURE MARKET VOLUME SHARE REGIONAL ANALYSIS, 2025–2034, (USD MILLION)
FIGURE 95 BANGLADESH REFURBISHED DATA CENTERSCURRENT AND FUTURE TYPE ANALYSIS, 2025–2034, (USD MILLION)
FIGURE 96 BANGLADESH REFURBISHED DATA CENTERSCURRENT AND FUTURE END USER ANALYSIS, 2025–2034, (USD MILLION)
FIGURE 97 NEW ZEALAND REFURBISHED DATA CENTERSCURRENT AND FUTURE TYPE ANALYSIS, 2025–2034, (USD MILLION)
FIGURE 98 NEW ZEALAND REFURBISHED DATA CENTERSCURRENT AND FUTURE END USER ANALYSIS, 2025–2034, (USD MILLION)
FIGURE 99 INDIA REFURBISHED DATA CENTERSCURRENT AND FUTURE TYPE ANALYSIS, 2025–2034, (USD MILLION)
FIGURE 100 INDIA REFURBISHED DATA CENTERSCURRENT AND FUTURE END USER ANALYSIS, 2025–2034, (USD MILLION)
FIGURE 101 SINGAPORE REFURBISHED DATA CENTERSCURRENT AND FUTURE TYPE ANALYSIS, 2025–2034, (USD MILLION)
FIGURE 102 SINGAPORE REFURBISHED DATA CENTERSCURRENT AND FUTURE END USER ANALYSIS, 2025–2034, (USD MILLION)
FIGURE 103 THAILAND REFURBISHED DATA CENTERSCURRENT AND FUTURE TYPE ANALYSIS, 2025–2034, (USD MILLION)
FIGURE 104 THAILAND REFURBISHED DATA CENTERSCURRENT AND FUTURE END USER ANALYSIS, 2025–2034, (USD MILLION)
FIGURE 105 TAIWAN REFURBISHED DATA CENTERSCURRENT AND FUTURE TYPE ANALYSIS, 2025–2034, (USD MILLION)
FIGURE 106 TAIWAN REFURBISHED DATA CENTERSCURRENT AND FUTURE END USER ANALYSIS, 2025–2034, (USD MILLION)
FIGURE 107 MALAYSIA REFURBISHED DATA CENTERSCURRENT AND FUTURE TYPE ANALYSIS, 2025–2034, (USD MILLION)
FIGURE 108 MALAYSIA REFURBISHED DATA CENTERSCURRENT AND FUTURE END USER ANALYSIS, 2025–2034, (USD MILLION)
FIGURE 109 REST OF SEA AND SOUTH ASIA REFURBISHED DATA CENTERSCURRENT AND FUTURE TYPE ANALYSIS, 2025–2034, (USD MILLION)
FIGURE 110 REST OF SEA AND SOUTH ASIA REFURBISHED DATA CENTERSCURRENT AND FUTURE END USER ANALYSIS, 2025–2034, (USD MILLION)
FIGURE 111 MIDDLE EAST AND AFRICA REFURBISHED DATA CENTERSCURRENT AND FUTURE MARKET VOLUME SHARE REGIONAL ANALYSIS, 2025–2034, (USD MILLION)
FIGURE 112 GCC COUNTRIES REFURBISHED DATA CENTERSCURRENT AND FUTURE TYPE ANALYSIS, 2025–2034, (USD MILLION)
FIGURE 113 GCC COUNTRIES REFURBISHED DATA CENTERSCURRENT AND FUTURE END USER ANALYSIS, 2025–2034, (USD MILLION)
FIGURE 114 SAUDI ARABIA REFURBISHED DATA CENTERSCURRENT AND FUTURE TYPE ANALYSIS, 2025–2034, (USD MILLION)
FIGURE 115 SAUDI ARABIA REFURBISHED DATA CENTERSCURRENT AND FUTURE END USER ANALYSIS, 2025–2034, (USD MILLION)
FIGURE 116 UAE REFURBISHED DATA CENTERSCURRENT AND FUTURE TYPE ANALYSIS, 2025–2034, (USD MILLION)
FIGURE 117 UAE REFURBISHED DATA CENTERSCURRENT AND FUTURE END USER ANALYSIS, 2025–2034, (USD MILLION)
FIGURE 118 BAHRAIN REFURBISHED DATA CENTERSCURRENT AND FUTURE TYPE ANALYSIS, 2025–2034, (USD MILLION)
FIGURE 119 BAHRAIN REFURBISHED DATA CENTERSCURRENT AND FUTURE END USER ANALYSIS, 2025–2034, (USD MILLION)
FIGURE 120 KUWAIT REFURBISHED DATA CENTERSCURRENT AND FUTURE TYPE ANALYSIS, 2025–2034, (USD MILLION)
FIGURE 121 KUWAIT REFURBISHED DATA CENTERSCURRENT AND FUTURE END USER ANALYSIS, 2025–2034, (USD MILLION)
FIGURE 122 OMAN REFURBISHED DATA CENTERSCURRENT AND FUTURE TYPE ANALYSIS, 2025–2034, (USD MILLION)
FIGURE 123 OMAN REFURBISHED DATA CENTERSCURRENT AND FUTURE END USER ANALYSIS, 2025–2034, (USD MILLION)
FIGURE 124 QATAR REFURBISHED DATA CENTERSCURRENT AND FUTURE TYPE ANALYSIS, 2025–2034, (USD MILLION)
FIGURE 125 QATAR REFURBISHED DATA CENTERSCURRENT AND FUTURE END USER ANALYSIS, 2025–2034, (USD MILLION)
FIGURE 126 EGYPT REFURBISHED DATA CENTERSCURRENT AND FUTURE TYPE ANALYSIS, 2025–2034, (USD MILLION)
FIGURE 127 EGYPT REFURBISHED DATA CENTERSCURRENT AND FUTURE END USER ANALYSIS, 2025–2034, (USD MILLION)
FIGURE 128 NIGERIA REFURBISHED DATA CENTERSCURRENT AND FUTURE TYPE ANALYSIS, 2025–2034, (USD MILLION)
FIGURE 129 NIGERIA REFURBISHED DATA CENTERSCURRENT AND FUTURE END USER ANALYSIS, 2025–2034, (USD MILLION)
FIGURE 130 SOUTH AFRICA REFURBISHED DATA CENTERSCURRENT AND FUTURE TYPE ANALYSIS, 2025–2034, (USD MILLION)
FIGURE 131 SOUTH AFRICA REFURBISHED DATA CENTERSCURRENT AND FUTURE END USER ANALYSIS, 2025–2034, (USD MILLION)
FIGURE 132 ISRAEL REFURBISHED DATA CENTERSCURRENT AND FUTURE TYPE ANALYSIS, 2025–2034, (USD MILLION)
FIGURE 133 ISRAEL REFURBISHED DATA CENTERSCURRENT AND FUTURE END USER ANALYSIS, 2025–2034, (USD MILLION)
FIGURE 134 REST OF MEA REFURBISHED DATA CENTERSCURRENT AND FUTURE TYPE ANALYSIS, 2025–2034, (USD MILLION)
FIGURE 135 REST OF MEA REFURBISHED DATA CENTERSCURRENT AND FUTURE END USER ANALYSIS, 2025–2034, (USD MILLION)
FIGURE 136 U. S. MARKET SHARE ANALYSIS BY TYPE (2024)
FIGURE 137 U. S. MARKET SHARE ANALYSIS BY END USER (2024)
FIGURE 138 CANADA MARKET SHARE ANALYSIS BY TYPE (2024)
FIGURE 139 CANADA MARKET SHARE ANALYSIS BY END USER (2024)
FIGURE 140 MEXICO MARKET SHARE ANALYSIS BY TYPE (2024)
FIGURE 141 MEXICO MARKET SHARE ANALYSIS BY END USER (2024)
FIGURE 142 CHINA MARKET SHARE ANALYSIS BY TYPE (2024)
FIGURE 143 CHINA MARKET SHARE ANALYSIS BY END USER (2024)
FIGURE 144 JAPAN MARKET SHARE ANALYSIS BY TYPE (2024)
FIGURE 145 JAPAN MARKET SHARE ANALYSIS BY END USER (2024)
FIGURE 146 INDIA MARKET SHARE ANALYSIS BY TYPE (2024)
FIGURE 147 INDIA MARKET SHARE ANALYSIS BY END USER (2024)
FIGURE 148 SOUTH KOREA MARKET SHARE ANALYSIS BY TYPE (2024)
FIGURE 149 SOUTH KOREA MARKET SHARE ANALYSIS BY END USER (2024)
FIGURE 150 SAUDI ARABIA MARKET SHARE ANALYSIS BY TYPE (2024)
FIGURE 151 SAUDI ARABIA MARKET SHARE ANALYSIS BY END USER (2024)
FIGURE 152 UAE MARKET SHARE ANALYSIS BY TYPE (2024)
FIGURE 153 UAE MARKET SHARE ANALYSIS BY END USER (2024)
FIGURE 154 EGYPT MARKET SHARE ANALYSIS BY TYPE (2024)
FIGURE 155 EGYPT MARKET SHARE ANALYSIS BY END USER (2024)
FIGURE 156 NIGERIA MARKET SHARE ANALYSIS BY TYPE (2024)
FIGURE 157 NIGERIA MARKET SHARE ANALYSIS BY END USER (2024)
FIGURE 158 SOUTH AFRICA MARKET SHARE ANALYSIS BY TYPE (2024)
FIGURE 159 SOUTH AFRICA MARKET SHARE ANALYSIS BY END USER (2024)
FIGURE 160 GERMANY MARKET SHARE ANALYSIS BY TYPE (2024)
FIGURE 161 GERMANY MARKET SHARE ANALYSIS BY END USER (2024)
FIGURE 162 FRANCE MARKET SHARE ANALYSIS BY TYPE (2024)
FIGURE 163 FRANCE MARKET SHARE ANALYSIS BY END USER (2024)
FIGURE 164 UK MARKET SHARE ANALYSIS BY TYPE (2024)
FIGURE 165 UK MARKET SHARE ANALYSIS BY END USER (2024)
FIGURE 166 SPAIN MARKET SHARE ANALYSIS BY TYPE (2024)
FIGURE 167 SPAIN MARKET SHARE ANALYSIS BY END USER (2024)
FIGURE 168 ITALY MARKET SHARE ANALYSIS BY TYPE (2024)
FIGURE 169 ITALY MARKET SHARE ANALYSIS BY END USER (2024)
FIGURE 170 BRAZIL MARKET SHARE ANALYSIS BY TYPE (2024)
FIGURE 171 BRAZIL MARKET SHARE ANALYSIS BY END USER (2024)
FIGURE 172 ARGENTINA MARKET SHARE ANALYSIS BY TYPE (2024)
FIGURE 173 ARGENTINA MARKET SHARE ANALYSIS BY END USER (2024)
FIGURE 174 COLUMBIA MARKET SHARE ANALYSIS BY TYPE (2024)
FIGURE 175 COLUMBIA MARKET SHARE ANALYSIS BY END USER (2024)
FIGURE 176 GLOBAL REFURBISHED DATA CENTERSCURRENT AND FUTURE MARKET KEY COUNTRY LEVEL ANALYSIS, 2024–2034, (USD MILLION)
FIGURE 177 FINANCIAL OVERVIEW:
Key Player Analysis
Dell Technologies Inc.: Dell Technologies positions itself as a market leader in refurbished and redeployed data center infrastructure, supported by its strong enterprise customer base and global supply chain. The company offers certified refurbished servers, storage systems, networking hardware, and power solutions under structured lifecycle programs. In 2024, Dell’s Infrastructure Solutions Group generated over USD 36 billion in revenue, with refurbished and circular IT offerings contributing an estimated high single-digit share that continues to rise into 2025.
Dell’s strategy centers on lifecycle extension, asset recovery, and energy-efficient refresh cycles. The company expanded its circular economy programs across North America and Europe, enabling enterprises to redeploy equipment with performance validation and warranty coverage. Dell differentiates through tight integration with hybrid cloud environments and AI-ready server platforms, which allows customers to adopt refurbished systems without compromising workload performance or compliance.
Hewlett Packard Enterprise Development LP: Hewlett Packard Enterprise operates as a strong challenger with a focused portfolio of refurbished compute, storage, and edge infrastructure aligned to enterprise and service provider demand. HPE’s Asset Upcycling Services and certified pre-owned programs support data center modernization at reduced capital intensity. In 2024, HPE reported total revenue of approximately USD 29 billion, with refurbished infrastructure and services gaining traction among mid to large enterprises seeking faster deployment cycles.
HPE emphasizes reliability assurance and service-backed deployments. The company invests in testing frameworks and firmware standardization to reduce operational risk for refurbished assets. Its strength lies in GreenLake consumption models, which increasingly integrate refurbished hardware to support hybrid IT strategies. This approach resonates with customers prioritizing cost discipline and sustainability targets in 2025 procurement plans.
International Business Machines Corporation (IBM): IBM operates as an innovator and niche leader within refurbished data center solutions, anchored by its enterprise services, hybrid cloud platforms, and asset reuse programs. The company provides refurbished servers, storage, and infrastructure components tailored for regulated industries such as BFSI, government, and healthcare. IBM generated over USD 61 billion in revenue in 2024, with infrastructure and lifecycle services forming a stable portion of its portfolio.
IBM differentiates through integration with AI-enabled operations, automation software, and compliance-driven architectures. Its refurbished deployments often support private cloud, mainframe-adjacent workloads, and mission-critical environments. The company continues to expand refurbishment and reuse within its sustainability roadmap, aligning with enterprise ESG reporting requirements. This positioning strengthens IBM’s relevance among organizations prioritizing governance, uptime, and long-term asset efficiency in 2025 and beyond.
Market Key Players
Huawei Technologies Co., Ltd.
Dell Technologies Inc.
Apto Solutions Inc.
Inspur Group
Cisco Systems, Inc.
Fujitsu
Lenovo
Super Micro Computer, Inc.
Hewlett Packard Enterprise Development LP
International Business Machines Corporation
Others
Driver:
Capital Cost Reduction Accelerating Refurbished Adoption
By 2025, cost control has become a top board-level priority as enterprises expand compute capacity under tighter capital constraints. Refurbished data centers address this pressure by reducing upfront infrastructure spending by as much as 60% to 80% compared with new deployments. You can redirect this freed capital toward higher-impact priorities such as security hardening, application modernization, or AI software investment. This cost gap continues to widen as prices for new servers, power systems, and cooling equipment rise due to supply chain normalization and higher component costs.
Mid-Market Demand Strengthening ROI and Deployment Speed
The financial case strengthens further for startups and mid-sized firms that require enterprise-grade performance without long payback periods. In 2025, more than 45% of mid-market enterprises globally report using refurbished or redeployed infrastructure for at least part of their data center footprint. This shift directly supports faster deployment timelines and improves return on invested capital, reinforcing refurbished assets as a core growth driver for the market.
Restraint:
Reliability Concerns Limiting Mission-Critical Use
Reliability perception remains the primary constraint limiting broader adoption. Many decision-makers still associate refurbished infrastructure with higher failure rates and inconsistent performance. In 2025, surveys indicate that nearly 30% of enterprises hesitate to deploy refurbished servers for mission-critical workloads due to concerns over uptime and maintenance exposure.
Extended Sales Cycles Due to Certification Gaps
This skepticism increases procurement scrutiny and lengthens sales cycles. Providers must invest heavily in validation, burn-in testing, and certification programs to offset perceived risk. While leading vendors now report failure rates within 2% of new equipment, inconsistent standards across the supplier base continue to restrain adoption among regulated industries such as BFSI and healthcare.
Opportunity:
ESG and Circular IT Mandates Driving Procurement Shift
Sustainability requirements create a clear expansion path for refurbished data centers beyond 2025. Enterprises face growing pressure from regulators, investors, and customers to reduce emissions and electronic waste. Refurbished infrastructure can cut embodied carbon emissions by up to 70% per server lifecycle compared with new manufacturing, while extending asset life by five to seven years.
Carbon Reduction and Asset Life Extension Advantage
This alignment with environmental reporting frameworks directly influences procurement decisions. By 2027, more than 55% of global enterprises are expected to include circular IT benchmarks in vendor evaluations. You can use refurbished deployments to meet ESG targets while maintaining cost discipline, positioning sustainability as both a compliance tool and a competitive differentiator.
Automation and AI-driven operations are reshaping refurbished data center management. In 2025, AI-based monitoring and predictive maintenance tools are increasingly embedded into refurbished environments to manage power usage, thermal balance, and workload distribution. This reduces unplanned downtime by an estimated 20% to 25% and lowers operating costs at scale.
Automation Parity Enabling High-Density Workloads
Market data reinforces this shift. The global data center automation market is projected to exceed USD 34.0 billion by 2033, growing at roughly 14% CAGR from 2025 onward. As automation adoption accelerates, refurbished facilities gain parity with new builds in operational control, making them viable for high-density and AI-adjacent workloads across mature and emerging markets.
Recent Developments
Dec 2024 – Dell Technologies Inc.: Dell expanded its certified refurbished data center portfolio with AI-capable PowerEdge servers and upgraded power systems, targeting enterprise and colocation clients. The program was expected to add over USD 450 million in refurbished infrastructure revenue in 2025. This move strengthened Dell’s position as a primary supplier of enterprise-grade refurbished hardware for AI-adjacent workloads.
Feb 2025 – Hewlett Packard Enterprise Development LP: HPE announced an expansion of its Asset Upcycling Services across North America and Western Europe, covering an additional 30 data center locations. The initiative aimed to increase refurbished infrastructure deployments by nearly 20% year over year. This expansion improved HPE’s access to regulated and mid-market customers seeking cost-controlled modernization.
Apr 2025 – International Business Machines Corporation (IBM): IBM partnered with a global colocation provider to deploy refurbished private cloud infrastructure for financial and government clients. The collaboration supported contracts valued at over USD 300 million through 2027. This development reinforced IBM’s relevance in compliance-focused refurbished data center deployments.
Jul 2025 – Lenovo Group Limited: Lenovo entered the refurbished data center segment through a certified reuse program for servers and storage systems in Asia Pacific. The launch targeted India and Southeast Asia and aimed to capture roughly 8% of regional refurbished demand by 2027. This entry increased competitive pressure and expanded supply options in high-growth markets.
Sep 2025 – Schneider Electric SE: Schneider Electric introduced refurbished power distribution and cooling modules tailored for Tier 3 data centers. The rollout covered more than 200 facilities globally and supported estimated energy savings of 15% per site. This move positioned the company as a key enabler of efficiency-focused refurbishment projects.