Renewable Energy Credit Market Size, Growth & Forecast 2025–2034
Global Renewable Energy Credit Market Size, Share, Analysis Report By Type(Solar, Wind, Biomass, Hydro, Other Renewables), Application(Commercial, Residential, Industrial), End User(Corporates, Government, Non-Profit Organizations), Region and Key Players - Industry Segment Overview, Market Dynamics, Competitive Strategies, Trends and Forecast 2025-2034
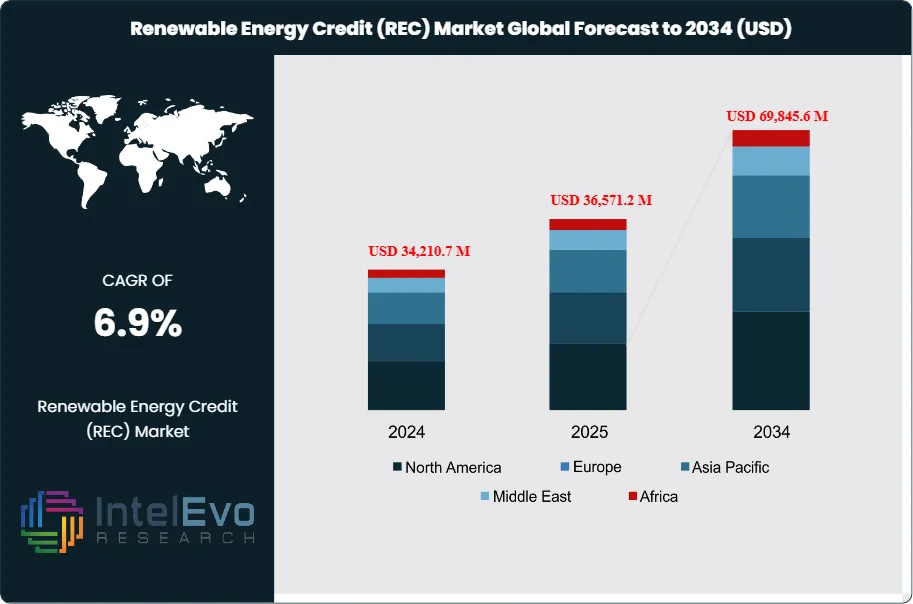
The Global Renewable Energy Credit (REC) Market size is projected to be worth around USD 69,845.6 million by 2034, up from USD 34,210.7 million in 2024, growing at a CAGR of 6.9% during 2025–2034. This growth reflects the increasing demand for corporate sustainability commitments, government-backed renewable energy policies, and rising adoption of carbon-neutral strategies worldwide. With businesses and consumers alike pushing for greener energy choices, RECs are set to become a cornerstone of global clean energy transition and net-zero initiatives.
This refers to the certificates issued by renewable energy producers regarding the verification of the fact that some definite amount of energy was generated from renewable sources. These credits help in trading in energy markets and play a vital role for regulatory compliance in terms of the use of renewable energy. Increase investments in renewable energy infrastructure with the current trend driven by the efforts of government policies in reducing carbon emissions and promoting sustainability. Major players include Statkraft AS, Constellation Energy Corporation, and NextEra Energy Inc, that have enhanced the market size to an estimated USD 35,084.40 million in 2024.
The market is expected to grow based on the strength of demand and is likely to register an approximate USD 67,329.82 million by 2034 with a compound annual growth rate (CAGR) of 6.9%. Demand growth is due to increasing awareness toward the effects of climate change, technological advancement in the renewable energy production process, and growing need for clean energy solutions. The government incentives like tax credit and subsidy enhance the attractiveness of the market. Switching from fossil fuels to renewable energy sources is both important for the environment and for the economy, because it stimulates investment in solar, wind, and other renewable energies.
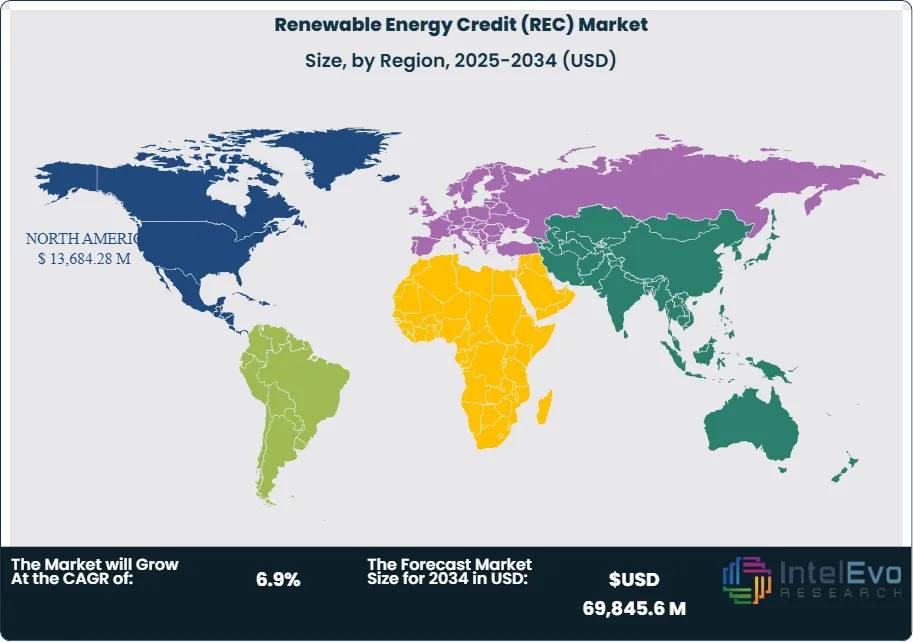
Regionally, North America and Europe are the leaders of this market because of the ready support frameworks by the regulatory authorities and government policies for renewable energy projects. The U.S. is at the forefront in renewable energy generation, and most states are enforcing renewable portfolio standards (RPS), which set a percentage of renewable energy to be generated as a component of the overall state energy mix. Renewables in the Asia-Pacific region are getting bolstered by growing energy demands there, as well as active support from governments for renewable energy development. The investments in solar and wind energy of the respective countries of China and India have a significant impact on the global REC market.
The COVID-19 pandemic had both positive and negative impacts on the REC market. Of course, a decline in economic activities had slowed the pace of renewable energy projects, and they also delayed issuing certificates. It has also promoted and enhanced the importance of sustainable energy solutions, with governments and organizations intensifying commitments toward transitioning to greener sources. And so, the trend bounces back with a focus on recovery, clean energy, and sustainable development, which propels the adoption of RECs.
Key Takeaways:
Market Growth: The Global Renewable Energy Credit market is projected to reach USD 67,329.82 million by 2034, growing at a robust CAGR of 6.9%, indicating strong market expansion driven by sustainability initiatives and regulatory support.
Type Segment Analysis: The solar segment is anticipated to dominate the market due to its widespread adoption and efficiency improvements. Solar energy credits are increasingly recognized, leading to significant investments and development in solar energy projects globally.
Application Segment Analysis: The commercial application segment is expected to hold a significant share, as businesses seek renewable energy credits to meet regulatory requirements and enhance their sustainability profiles, aligning with corporate social responsibility goals.
Driver: The increasing focus on reducing carbon emissions and transitioning to renewable energy sources is a key driver for the REC market. Government incentives and public awareness of climate change are propelling investments in renewable technologies.
Restraint: The complexity of regulatory frameworks and varying standards across regions can act as a restraint on the REC market. These inconsistencies may hinder the effective trading of renewable energy credits and create barriers for new entrants.
Opportunity: The rising demand for renewable energy in emerging markets, particularly in Asia-Pacific, presents significant growth opportunities. Expanding government support and investments in renewable infrastructure are likely to boost the adoption of RECs.
Trend: There is a growing trend toward digital platforms for trading renewable energy credits, improving transparency and efficiency in transactions within the market.
Regional Analysis: North America and Europe are expected to lead the market, driven by supportive regulatory frameworks and high investments in renewable energy. The Asia-Pacific region is also poised for rapid growth due to increasing energy demands and governmental support for renewable initiatives.
Type Analysis:
The Renewable Energy Credit market is categorized based on type. It includes solar, wind, biomass, hydro, and other renewable sources. The solar segment is found to be the market leader because of a rise in photovoltaic technology uptake and various incentives offered by the government sectors for their projects in solar energy. Wind energy credits are also gaining traction as countries invest more in wind farms for sustainability. Biomass and hydro segments offer diversification of the market for varying geographies and environmental conditions. There is an increasing requirement for renewable energy solutions and awareness about climate change, both of which will propel consumption in all segments; solar, however, takes the lead.
Application Analysis:
The application segment for the REC industry includes commercial, residential, and industrial applications. Commercially, there will be a sizable market share because the companies would have no choice but to bank on renewable energy credits for complying with regulations and as a corporate means of improving their sustainability profiles. Residentially, applications are rising with the popularity of decentralized energy through rooftop solar installations. The industrial sector also sees large corporations using RECs as a way to balance their carbon footprint with sustainability goals. This increasing demand across all applications speaks of the overall social imperative toward adopting renewable energy and sustainable practices.
End User Analysis:
The end-users include corporates, government entities, and non-profit organizations. Increasingly, the corporates have been using renewable energy credits as part of their environmental, social and governance (ESG) policies to reduce carbon footprint and enhance reputation. Government bodies fulfill a dual role as regulators and market players in the renewable energy markets, with RECs helping demonstrate compliance and leadership by example with participation of the private sector. Similar to that, non-profit organizations influence the market, especially in the promotion of sustainability and partnerships that further use of renewable energy, and end-users collectively form a very potent force in driving demand for RECs and furthering the cause of renewable energy.
Region Analysis:
North America Leads With Significant Market Share in the Renewable Energy Credit Market: North America dominates the largest market share at an estimated 40% of the market. This is because of strong government incentives, full regulatory structures, and increasing corporate commitment to sustainability. As such, in the United States, many states have adopted renewable portfolio standards that obligate specified levels of renewable energy utilization, thereby increasing the demand for RECs. Major participants in the market of renewable energy, and significant investments in projects involving solar and wind energy, further substantiate North America's dominance in the market.
Renewables in the Asia-Pacific region are the market that is anticipated to grow, and expected to develop with a CAGR of over 8% during the forecast period. Factors that enhance growth in this market include the rise in demand for energy, increasing investments in renewable energy infrastructure, as well as government policies aimed at reducing the carbon footprint. Nations such as China and India are highly investing in solar and wind projects thus carrying huge opportunities for REC adoption. Increasing consumer awareness towards climate change and sustainability and garnering more corporations' interest in sourcing renewable energy credits is making the region grow further. Although Europe remains an important market, severe climate regulations and ambitious sustainability objectives. Latin America and Middle East and Africa are steadily growing in their share supported by the shift toward renewable energy solutions.
By Type (Compliance RECs, Voluntary RECs), By Technology (Wind Energy, Solar Energy, Biomass Energy, Hydro Power, Geothermal Energy, Others), By Trading Platform (Spot Market, Long-term Contracts), By Distribution Channel (Direct Sales, Brokers & Traders, Online Platforms), By End User (Corporates, Government, Non-Profit Organizations), By Application (Utilities & Power Providers, Industrial Sector, Commercial Sector, Residential Consumers)
Research Methodology
Primary Research- 100 Interviews of Stakeholders
Secondary Research
Desk Research
Regional scope
North America (United States, Canada, Mexico)
Latin America (Brazil, Argentina, Columbia)
East Asia And Pacific (China, Japan, South Korea, Australia, Cambodia, Fiji, Indonesia)
Sea And South Asia (India, Singapore, Thailand, Taiwan, Malaysia)
Eastern Europe (Poland, Russia, Czech Republic, Romania)
Western Europe (Germany, U.K., France, Spain, Itlay)
Middle East & Africa (GCC Countries, Egypt, Nigeria, South Africa, Israel)
Competitive Landscape
NextEra Energy Resources LLC, Green Mountain Energy Company, 3Degrees Group Inc., Nexamp Inc., Arcadia, EcoEnclose, MidAmerican Energy Company, Renewable Energy Group Inc., Sierra Club, Walmart Inc., Tesla Inc., Duke Energy Corporation, Constellation Energy, Exelon Corporation, EDP Renewables North America LLC, Calpine Corporation, Dominion Energy Inc., American Electric Power Company Inc., Pacific Gas and Electric Company (PG&E), Xcel Energy Inc.
Customization Scope
Customization for segments, region/country-level will be provided. Moreover, additional customization can be done based on the requirements.
Pricing and Purchase Options
Avail customized purchase options to meet your exact research needs. We have three licenses to opt for: Single User License, Multi-User License (Up to 5 Users), Corporate Use License (Unlimited User and Printable PDF).
TABLE OF CONTENTS
1. EXECUTIVE SUMMARY
1.1. MARKET SNAPSHOT
1.2. KEY FINDINGS & INSIGHTS
1.3. ANALYST RECOMMENDATIONS
1.4. FUTURE OUTLOOK
2. RESEARCH METHODOLOGY
2.1. MARKET DEFINITION & SCOPE
2.2. RESEARCH OBJECTIVES: PRIMARY & SECONDARY DATA SOURCES
2.3. DATA COLLECTION SOURCES
2.3.1. COVERAGE OF 100+ PRIMARY RESEARCH/CONSULTATION CALLS WITH INDUSTRY STAKEHOLDERS
FIGURE 17 NORTH AMERICA RENEWABLE ENERGY CREDIT CURRENT AND FUTURE TYPE ANALYSIS, 2025–2034, (USD MILLION)
FIGURE 18 NORTH AMERICA RENEWABLE ENERGY CREDIT CURRENT AND FUTURE END USER ANALYSIS, 2025–2034, (USD MILLION)
FIGURE 19 MARKET SHARE BY COUNTRY
FIGURE 20 LATIN AMERICA RENEWABLE ENERGY CREDIT CURRENT AND FUTURE TYPE ANALYSIS, 2025–2034, (USD MILLION)
FIGURE 21 LATIN AMERICA RENEWABLE ENERGY CREDIT CURRENT AND FUTURE END USER ANALYSIS, 2025–2034, (USD MILLION)
FIGURE 22 MARKET SHARE BY COUNTRY
FIGURE 23 EASTERN EUROPE RENEWABLE ENERGY CREDIT CURRENT AND FUTURE TYPE ANALYSIS, 2025–2034, (USD MILLION)
FIGURE 24 EASTERN EUROPE RENEWABLE ENERGY CREDIT CURRENT AND FUTURE END USER ANALYSIS, 2025–2034, (USD MILLION)
FIGURE 25 MARKET SHARE BY COUNTRY
FIGURE 26 WESTERN EUROPE RENEWABLE ENERGY CREDIT CURRENT AND FUTURE TYPE ANALYSIS, 2025–2034, (USD MILLION)
FIGURE 27 WESTERN EUROPE RENEWABLE ENERGY CREDIT CURRENT AND FUTURE END USER ANALYSIS, 2025–2034, (USD MILLION)
FIGURE 28 MARKET SHARE BY COUNTRY
FIGURE 29 EAST ASIA AND PACIFIC RENEWABLE ENERGY CREDIT CURRENT AND FUTURE TYPE ANALYSIS, 2025–2034, (USD MILLION)
FIGURE 30 EAST ASIA AND PACIFIC RENEWABLE ENERGY CREDIT CURRENT AND FUTURE END USER ANALYSIS, 2025–2034, (USD MILLION)
FIGURE 31 MARKET SHARE BY COUNTRY
FIGURE 32 SEA AND SOUTH ASIA RENEWABLE ENERGY CREDIT CURRENT AND FUTURE TYPE ANALYSIS, 2025–2034, (USD MILLION)
FIGURE 33 SEA AND SOUTH ASIA RENEWABLE ENERGY CREDIT CURRENT AND FUTURE END USER ANALYSIS, 2025–2034, (USD MILLION)
FIGURE 34 MARKET SHARE BY COUNTRY
FIGURE 35 MIDDLE EAST AND AFRICA RENEWABLE ENERGY CREDIT CURRENT AND FUTURE TYPE ANALYSIS, 2025–2034, (USD MILLION)
FIGURE 36 MIDDLE EAST AND AFRICA RENEWABLE ENERGY CREDIT CURRENT AND FUTURE END USER ANALYSIS, 2025–2034, (USD MILLION)
FIGURE 37 NORTH AMERICA RENEWABLE ENERGY CREDIT CURRENT AND FUTURE MARKET VOLUME SHARE REGIONAL ANALYSIS, 2025–2034, (USD MILLION)
FIGURE 38 U.S. RENEWABLE ENERGY CREDIT CURRENT AND FUTURE TYPE ANALYSIS, 2025–2034, (USD MILLION)
FIGURE 39 U.S. RENEWABLE ENERGY CREDIT CURRENT AND FUTURE END USER ANALYSIS, 2025–2034, (USD MILLION)
FIGURE 40 CANADA RENEWABLE ENERGY CREDIT CURRENT AND FUTURE TYPE ANALYSIS, 2025–2034, (USD MILLION)
FIGURE 41 CANADA RENEWABLE ENERGY CREDIT CURRENT AND FUTURE END USER ANALYSIS, 2025–2034, (USD MILLION)
FIGURE 42 LATIN AMERICA RENEWABLE ENERGY CREDIT CURRENT AND FUTURE MARKET VOLUME SHARE REGIONAL ANALYSIS, 2025–2034, (USD MILLION)
FIGURE 43 MEXICO RENEWABLE ENERGY CREDIT CURRENT AND FUTURE TYPE ANALYSIS, 2025–2034, (USD MILLION)
FIGURE 44 MEXICO RENEWABLE ENERGY CREDIT CURRENT AND FUTURE END USER ANALYSIS, 2025–2034, (USD MILLION)
FIGURE 45 BRAZIL RENEWABLE ENERGY CREDIT CURRENT AND FUTURE TYPE ANALYSIS, 2025–2034, (USD MILLION)
FIGURE 46 BRAZIL RENEWABLE ENERGY CREDIT CURRENT AND FUTURE END USER ANALYSIS, 2025–2034, (USD MILLION)
FIGURE 47 ARGENTINA RENEWABLE ENERGY CREDIT CURRENT AND FUTURE TYPE ANALYSIS, 2025–2034, (USD MILLION)
FIGURE 48 ARGENTINA RENEWABLE ENERGY CREDIT CURRENT AND FUTURE END USER ANALYSIS, 2025–2034, (USD MILLION)
FIGURE 49 COLUMBIA RENEWABLE ENERGY CREDIT CURRENT AND FUTURE TYPE ANALYSIS, 2025–2034, (USD MILLION)
FIGURE 50 COLUMBIA RENEWABLE ENERGY CREDIT CURRENT AND FUTURE END USER ANALYSIS, 2025–2034, (USD MILLION)
FIGURE 51 REST OF LATIN AMERICA RENEWABLE ENERGY CREDIT CURRENT AND FUTURE TYPE ANALYSIS, 2025–2034, (USD MILLION)
FIGURE 52 REST OF LATIN AMERICA RENEWABLE ENERGY CREDIT CURRENT AND FUTURE END USER ANALYSIS, 2025–2034, (USD MILLION)
FIGURE 53 EASTERN EUROPE RENEWABLE ENERGY CREDIT CURRENT AND FUTURE MARKET VOLUME SHARE REGIONAL ANALYSIS, 2025–2034, (USD MILLION)
FIGURE 54 POLAND RENEWABLE ENERGY CREDIT CURRENT AND FUTURE TYPE ANALYSIS, 2025–2034, (USD MILLION)
FIGURE 55 POLAND RENEWABLE ENERGY CREDIT CURRENT AND FUTURE END USER ANALYSIS, 2025–2034, (USD MILLION)
FIGURE 56 RUSSIA RENEWABLE ENERGY CREDIT CURRENT AND FUTURE TYPE ANALYSIS, 2025–2034, (USD MILLION)
FIGURE 57 RUSSIA RENEWABLE ENERGY CREDIT CURRENT AND FUTURE END USER ANALYSIS, 2025–2034, (USD MILLION)
FIGURE 58 CZECH REPUBLIC RENEWABLE ENERGY CREDIT CURRENT AND FUTURE TYPE ANALYSIS, 2025–2034, (USD MILLION)
FIGURE 59 CZECH REPUBLIC RENEWABLE ENERGY CREDIT CURRENT AND FUTURE END USER ANALYSIS, 2025–2034, (USD MILLION)
FIGURE 60 ROMANIA RENEWABLE ENERGY CREDIT CURRENT AND FUTURE TYPE ANALYSIS, 2025–2034, (USD MILLION)
FIGURE 61 ROMANIA RENEWABLE ENERGY CREDIT CURRENT AND FUTURE END USER ANALYSIS, 2025–2034, (USD MILLION)
FIGURE 62 REST OF EASTERN EUROPE RENEWABLE ENERGY CREDIT CURRENT AND FUTURE TYPE ANALYSIS, 2025–2034, (USD MILLION)
FIGURE 63 REST OF EASTERN EUROPE RENEWABLE ENERGY CREDIT CURRENT AND FUTURE END USER ANALYSIS, 2025–2034, (USD MILLION)
FIGURE 64 WESTERN EUROPE RENEWABLE ENERGY CREDIT CURRENT AND FUTURE MARKET VOLUME SHARE REGIONAL ANALYSIS, 2025–2034, (USD MILLION)
FIGURE 65 GERMANY RENEWABLE ENERGY CREDIT CURRENT AND FUTURE TYPE ANALYSIS, 2025–2034, (USD MILLION)
FIGURE 66 GERMANY RENEWABLE ENERGY CREDIT CURRENT AND FUTURE END USER ANALYSIS, 2025–2034, (USD MILLION)
FIGURE 67 FRANCE RENEWABLE ENERGY CREDIT CURRENT AND FUTURE TYPE ANALYSIS, 2025–2034, (USD MILLION)
FIGURE 68 FRANCE RENEWABLE ENERGY CREDIT CURRENT AND FUTURE END USER ANALYSIS, 2025–2034, (USD MILLION)
FIGURE 69 UK RENEWABLE ENERGY CREDIT CURRENT AND FUTURE TYPE ANALYSIS, 2025–2034, (USD MILLION)
FIGURE 70 UK RENEWABLE ENERGY CREDIT CURRENT AND FUTURE END USER ANALYSIS, 2025–2034, (USD MILLION)
FIGURE 71 SPAIN RENEWABLE ENERGY CREDIT CURRENT AND FUTURE TYPE ANALYSIS, 2025–2034, (USD MILLION)
FIGURE 72 SPAIN RENEWABLE ENERGY CREDIT CURRENT AND FUTURE END USER ANALYSIS, 2025–2034, (USD MILLION)
FIGURE 73 ITALY RENEWABLE ENERGY CREDIT CURRENT AND FUTURE TYPE ANALYSIS, 2025–2034, (USD MILLION)
FIGURE 74 ITALY RENEWABLE ENERGY CREDIT CURRENT AND FUTURE END USER ANALYSIS, 2025–2034, (USD MILLION)
FIGURE 75 REST OF WESTERN EUROPE RENEWABLE ENERGY CREDIT CURRENT AND FUTURE TYPE ANALYSIS, 2025–2034, (USD MILLION)
FIGURE 76 REST OF WESTERN EUROPE RENEWABLE ENERGY CREDIT CURRENT AND FUTURE END USER ANALYSIS, 2025–2034, (USD MILLION)
FIGURE 77 EAST ASIA AND PACIFIC RENEWABLE ENERGY CREDIT CURRENT AND FUTURE MARKET VOLUME SHARE REGIONAL ANALYSIS, 2025–2034, (USD MILLION)
FIGURE 78 CHINA RENEWABLE ENERGY CREDIT CURRENT AND FUTURE TYPE ANALYSIS, 2025–2034, (USD MILLION)
FIGURE 79 CHINA RENEWABLE ENERGY CREDIT CURRENT AND FUTURE END USER ANALYSIS, 2025–2034, (USD MILLION)
FIGURE 80 JAPAN RENEWABLE ENERGY CREDIT CURRENT AND FUTURE TYPE ANALYSIS, 2025–2034, (USD MILLION)
FIGURE 81 JAPAN RENEWABLE ENERGY CREDIT CURRENT AND FUTURE END USER ANALYSIS, 2025–2034, (USD MILLION)
FIGURE 82 AUSTRALIA RENEWABLE ENERGY CREDIT CURRENT AND FUTURE TYPE ANALYSIS, 2025–2034, (USD MILLION)
FIGURE 83 AUSTRALIA RENEWABLE ENERGY CREDIT CURRENT AND FUTURE END USER ANALYSIS, 2025–2034, (USD MILLION)
FIGURE 84 CAMBODIA RENEWABLE ENERGY CREDIT CURRENT AND FUTURE TYPE ANALYSIS, 2025–2034, (USD MILLION)
FIGURE 85 CAMBODIA RENEWABLE ENERGY CREDIT CURRENT AND FUTURE END USER ANALYSIS, 2025–2034, (USD MILLION)
FIGURE 86 FIJI RENEWABLE ENERGY CREDIT CURRENT AND FUTURE TYPE ANALYSIS, 2025–2034, (USD MILLION)
FIGURE 87 FIJI RENEWABLE ENERGY CREDIT CURRENT AND FUTURE END USER ANALYSIS, 2025–2034, (USD MILLION)
FIGURE 88 INDONESIA RENEWABLE ENERGY CREDIT CURRENT AND FUTURE TYPE ANALYSIS, 2025–2034, (USD MILLION)
FIGURE 89 INDONESIA RENEWABLE ENERGY CREDIT CURRENT AND FUTURE END USER ANALYSIS, 2025–2034, (USD MILLION)
FIGURE 90 SOUTH KOREA RENEWABLE ENERGY CREDIT CURRENT AND FUTURE TYPE ANALYSIS, 2025–2034, (USD MILLION)
FIGURE 91 SOUTH KOREA RENEWABLE ENERGY CREDIT CURRENT AND FUTURE END USER ANALYSIS, 2025–2034, (USD MILLION)
FIGURE 92 REST OF EAST ASIA AND PACIFIC RENEWABLE ENERGY CREDIT CURRENT AND FUTURE TYPE ANALYSIS, 2025–2034, (USD MILLION)
FIGURE 93 REST OF EAST ASIA AND PACIFIC RENEWABLE ENERGY CREDIT CURRENT AND FUTURE END USER ANALYSIS, 2025–2034, (USD MILLION)
FIGURE 94 SEA AND SOUTH ASIA RENEWABLE ENERGY CREDIT CURRENT AND FUTURE MARKET VOLUME SHARE REGIONAL ANALYSIS, 2025–2034, (USD MILLION)
FIGURE 95 BANGLADESH RENEWABLE ENERGY CREDIT CURRENT AND FUTURE TYPE ANALYSIS, 2025–2034, (USD MILLION)
FIGURE 96 BANGLADESH RENEWABLE ENERGY CREDIT CURRENT AND FUTURE END USER ANALYSIS, 2025–2034, (USD MILLION)
FIGURE 97 NEW ZEALAND RENEWABLE ENERGY CREDIT CURRENT AND FUTURE TYPE ANALYSIS, 2025–2034, (USD MILLION)
FIGURE 98 NEW ZEALAND RENEWABLE ENERGY CREDIT CURRENT AND FUTURE END USER ANALYSIS, 2025–2034, (USD MILLION)
FIGURE 99 INDIA RENEWABLE ENERGY CREDIT CURRENT AND FUTURE TYPE ANALYSIS, 2025–2034, (USD MILLION)
FIGURE 100 INDIA RENEWABLE ENERGY CREDIT CURRENT AND FUTURE END USER ANALYSIS, 2025–2034, (USD MILLION)
FIGURE 101 SINGAPORE RENEWABLE ENERGY CREDIT CURRENT AND FUTURE TYPE ANALYSIS, 2025–2034, (USD MILLION)
FIGURE 102 SINGAPORE RENEWABLE ENERGY CREDIT CURRENT AND FUTURE END USER ANALYSIS, 2025–2034, (USD MILLION)
FIGURE 103 THAILAND RENEWABLE ENERGY CREDIT CURRENT AND FUTURE TYPE ANALYSIS, 2025–2034, (USD MILLION)
FIGURE 104 THAILAND RENEWABLE ENERGY CREDIT CURRENT AND FUTURE END USER ANALYSIS, 2025–2034, (USD MILLION)
FIGURE 105 TAIWAN RENEWABLE ENERGY CREDIT CURRENT AND FUTURE TYPE ANALYSIS, 2025–2034, (USD MILLION)
FIGURE 106 TAIWAN RENEWABLE ENERGY CREDIT CURRENT AND FUTURE END USER ANALYSIS, 2025–2034, (USD MILLION)
FIGURE 107 MALAYSIA RENEWABLE ENERGY CREDIT CURRENT AND FUTURE TYPE ANALYSIS, 2025–2034, (USD MILLION)
FIGURE 108 MALAYSIA RENEWABLE ENERGY CREDIT CURRENT AND FUTURE END USER ANALYSIS, 2025–2034, (USD MILLION)
FIGURE 109 REST OF SEA AND SOUTH ASIA RENEWABLE ENERGY CREDIT CURRENT AND FUTURE TYPE ANALYSIS, 2025–2034, (USD MILLION)
FIGURE 110 REST OF SEA AND SOUTH ASIA RENEWABLE ENERGY CREDIT CURRENT AND FUTURE END USER ANALYSIS, 2025–2034, (USD MILLION)
FIGURE 111 MIDDLE EAST AND AFRICA RENEWABLE ENERGY CREDIT CURRENT AND FUTURE MARKET VOLUME SHARE REGIONAL ANALYSIS, 2025–2034, (USD MILLION)
FIGURE 112 GCC COUNTRIES RENEWABLE ENERGY CREDIT CURRENT AND FUTURE TYPE ANALYSIS, 2025–2034, (USD MILLION)
FIGURE 113 GCC COUNTRIES RENEWABLE ENERGY CREDIT CURRENT AND FUTURE END USER ANALYSIS, 2025–2034, (USD MILLION)
FIGURE 114 SAUDI ARABIA RENEWABLE ENERGY CREDIT CURRENT AND FUTURE TYPE ANALYSIS, 2025–2034, (USD MILLION)
FIGURE 115 SAUDI ARABIA RENEWABLE ENERGY CREDIT CURRENT AND FUTURE END USER ANALYSIS, 2025–2034, (USD MILLION)
FIGURE 116 UAE RENEWABLE ENERGY CREDIT CURRENT AND FUTURE TYPE ANALYSIS, 2025–2034, (USD MILLION)
FIGURE 117 UAE RENEWABLE ENERGY CREDIT CURRENT AND FUTURE END USER ANALYSIS, 2025–2034, (USD MILLION)
FIGURE 118 BAHRAIN RENEWABLE ENERGY CREDIT CURRENT AND FUTURE TYPE ANALYSIS, 2025–2034, (USD MILLION)
FIGURE 119 BAHRAIN RENEWABLE ENERGY CREDIT CURRENT AND FUTURE END USER ANALYSIS, 2025–2034, (USD MILLION)
FIGURE 120 KUWAIT RENEWABLE ENERGY CREDIT CURRENT AND FUTURE TYPE ANALYSIS, 2025–2034, (USD MILLION)
FIGURE 121 KUWAIT RENEWABLE ENERGY CREDIT CURRENT AND FUTURE END USER ANALYSIS, 2025–2034, (USD MILLION)
FIGURE 122 OMAN RENEWABLE ENERGY CREDIT CURRENT AND FUTURE TYPE ANALYSIS, 2025–2034, (USD MILLION)
FIGURE 123 OMAN RENEWABLE ENERGY CREDIT CURRENT AND FUTURE END USER ANALYSIS, 2025–2034, (USD MILLION)
FIGURE 124 QATAR RENEWABLE ENERGY CREDIT CURRENT AND FUTURE TYPE ANALYSIS, 2025–2034, (USD MILLION)
FIGURE 125 QATAR RENEWABLE ENERGY CREDIT CURRENT AND FUTURE END USER ANALYSIS, 2025–2034, (USD MILLION)
FIGURE 126 EGYPT RENEWABLE ENERGY CREDIT CURRENT AND FUTURE TYPE ANALYSIS, 2025–2034, (USD MILLION)
FIGURE 127 EGYPT RENEWABLE ENERGY CREDIT CURRENT AND FUTURE END USER ANALYSIS, 2025–2034, (USD MILLION)
FIGURE 128 NIGERIA RENEWABLE ENERGY CREDIT CURRENT AND FUTURE TYPE ANALYSIS, 2025–2034, (USD MILLION)
FIGURE 129 NIGERIA RENEWABLE ENERGY CREDIT CURRENT AND FUTURE END USER ANALYSIS, 2025–2034, (USD MILLION)
FIGURE 130 SOUTH AFRICA RENEWABLE ENERGY CREDIT CURRENT AND FUTURE TYPE ANALYSIS, 2025–2034, (USD MILLION)
FIGURE 131 SOUTH AFRICA RENEWABLE ENERGY CREDIT CURRENT AND FUTURE END USER ANALYSIS, 2025–2034, (USD MILLION)
FIGURE 132 ISRAEL RENEWABLE ENERGY CREDIT CURRENT AND FUTURE TYPE ANALYSIS, 2025–2034, (USD MILLION)
FIGURE 133 ISRAEL RENEWABLE ENERGY CREDIT CURRENT AND FUTURE END USER ANALYSIS, 2025–2034, (USD MILLION)
FIGURE 134 REST OF MEA RENEWABLE ENERGY CREDIT CURRENT AND FUTURE TYPE ANALYSIS, 2025–2034, (USD MILLION)
FIGURE 135 REST OF MEA RENEWABLE ENERGY CREDIT CURRENT AND FUTURE END USER ANALYSIS, 2025–2034, (USD MILLION)
FIGURE 136 U. S. MARKET SHARE ANALYSIS BY TYPE (2024)
FIGURE 137 U. S. MARKET SHARE ANALYSIS BY END USER (2024)
FIGURE 138 CANADA MARKET SHARE ANALYSIS BY TYPE (2024)
FIGURE 139 CANADA MARKET SHARE ANALYSIS BY END USER (2024)
FIGURE 140 MEXICO MARKET SHARE ANALYSIS BY TYPE (2024)
FIGURE 141 MEXICO MARKET SHARE ANALYSIS BY END USER (2024)
FIGURE 142 CHINA MARKET SHARE ANALYSIS BY TYPE (2024)
FIGURE 143 CHINA MARKET SHARE ANALYSIS BY END USER (2024)
FIGURE 144 JAPAN MARKET SHARE ANALYSIS BY TYPE (2024)
FIGURE 145 JAPAN MARKET SHARE ANALYSIS BY END USER (2024)
FIGURE 146 INDIA MARKET SHARE ANALYSIS BY TYPE (2024)
FIGURE 147 INDIA MARKET SHARE ANALYSIS BY END USER (2024)
FIGURE 148 SOUTH KOREA MARKET SHARE ANALYSIS BY TYPE (2024)
FIGURE 149 SOUTH KOREA MARKET SHARE ANALYSIS BY END USER (2024)
FIGURE 150 SAUDI ARABIA MARKET SHARE ANALYSIS BY TYPE (2024)
FIGURE 151 SAUDI ARABIA MARKET SHARE ANALYSIS BY END USER (2024)
FIGURE 152 UAE MARKET SHARE ANALYSIS BY TYPE (2024)
FIGURE 153 UAE MARKET SHARE ANALYSIS BY END USER (2024)
FIGURE 154 EGYPT MARKET SHARE ANALYSIS BY TYPE (2024)
FIGURE 155 EGYPT MARKET SHARE ANALYSIS BY END USER (2024)
FIGURE 156 NIGERIA MARKET SHARE ANALYSIS BY TYPE (2024)
FIGURE 157 NIGERIA MARKET SHARE ANALYSIS BY END USER (2024)
FIGURE 158 SOUTH AFRICA MARKET SHARE ANALYSIS BY TYPE (2024)
FIGURE 159 SOUTH AFRICA MARKET SHARE ANALYSIS BY END USER (2024)
FIGURE 160 GERMANY MARKET SHARE ANALYSIS BY TYPE (2024)
FIGURE 161 GERMANY MARKET SHARE ANALYSIS BY END USER (2024)
FIGURE 162 FRANCE MARKET SHARE ANALYSIS BY TYPE (2024)
FIGURE 163 FRANCE MARKET SHARE ANALYSIS BY END USER (2024)
FIGURE 164 UK MARKET SHARE ANALYSIS BY TYPE (2024)
FIGURE 165 UK MARKET SHARE ANALYSIS BY END USER (2024)
FIGURE 166 SPAIN MARKET SHARE ANALYSIS BY TYPE (2024)
FIGURE 167 SPAIN MARKET SHARE ANALYSIS BY END USER (2024)
FIGURE 168 ITALY MARKET SHARE ANALYSIS BY TYPE (2024)
FIGURE 169 ITALY MARKET SHARE ANALYSIS BY END USER (2024)
FIGURE 170 BRAZIL MARKET SHARE ANALYSIS BY TYPE (2024)
FIGURE 171 BRAZIL MARKET SHARE ANALYSIS BY END USER (2024)
FIGURE 172 ARGENTINA MARKET SHARE ANALYSIS BY TYPE (2024)
FIGURE 173 ARGENTINA MARKET SHARE ANALYSIS BY END USER (2024)
FIGURE 174 COLUMBIA MARKET SHARE ANALYSIS BY TYPE (2024)
FIGURE 175 COLUMBIA MARKET SHARE ANALYSIS BY END USER (2024)
FIGURE 176 GLOBAL RENEWABLE ENERGY CREDIT CURRENT AND FUTURE MARKET KEY COUNTRY LEVEL ANALYSIS, 2024–2034, (USD MILLION)
FIGURE 177 FINANCIAL OVERVIEW:
Key Players Analysis:
NextEra Energy Resources, LLC: NextEra Energy Resources, based in Juno Beach, Florida, is one of the largest producers of renewable energy from wind and solar. The company focuses on developing and managing renewable energy projects and is heavily invested in clean energy technologies. Its business strategy centers around expanding its renewable portfolio and utilizing advanced technologies to enhance efficiency and sustainability.
Green Mountain Energy Company: Founded in 1997 and headquartered in Houston, Texas, Green Mountain Energy is a retail electricity provider that offers renewable energy products. The company provides services like energy efficiency solutions and carbon offsets. Green Mountain's strategy emphasizes customer engagement through education about renewable energy options and community initiatives to promote sustainability.
3Degrees Group, Inc.: 3Degrees, based in San Francisco, California, specializes in renewable energy and carbon offset solutions. The company works with organizations to implement sustainability strategies, including REC purchasing and management. 3Degrees focuses on building partnerships with businesses to enhance their environmental impact while promoting renewable energy adoption across various sectors.
Nexamp, Inc.: Nexamp, headquartered in Boston, Massachusetts, offers solar energy solutions and community solar programs. The company develops, finances, and operates solar projects, allowing consumers to access renewable energy without the need for on-site installations. Nexamp's strategy is to democratize access to solar power, making it available to a broader audience through innovative financing and community involvement.
Arcadia: Arcadia, based in Washington, D.C., provides technology-driven solutions for accessing renewable energy. The company offers services such as community solar subscriptions and energy bill management, enabling consumers to support clean energy initiatives. Arcadia's business strategy focuses on leveraging technology to simplify renewable energy access and enhance consumer engagement in sustainability efforts.
EcoEnclose: EcoEnclose, located in Louisville, Colorado, specializes in sustainable packaging solutions. The company offers eco-friendly packaging materials and services to businesses seeking to reduce their environmental impact. EcoEnclose's strategy revolves around innovation in sustainable packaging, promoting circular economy practices, and educating clients on reducing waste through eco-conscious choices.
MidAmerican Energy Company: Headquartered in Des Moines, Iowa, MidAmerican Energy is a subsidiary of Berkshire Hathaway Energy. The company provides electric and natural gas services and is a leader in renewable energy generation, primarily focusing on wind power. MidAmerican's strategy includes significant investments in renewable projects to achieve sustainability goals and meet regulatory requirements for clean energy.
Renewable Energy Group, Inc.: Based in Ames, Iowa, Renewable Energy Group (REG) specializes in biofuels and renewable diesel production. The company offers various renewable energy products and services, including consulting and project management. REG's business strategy focuses on expanding its production capacity and leveraging technological advancements to improve the efficiency and sustainability of biofuel operations.
Sierra Club: Founded in 1892 and headquartered in San Francisco, California, the Sierra Club is one of the oldest and largest environmental organizations in the U.S. While primarily an advocacy group, the Sierra Club promotes renewable energy initiatives and educates the public on environmental issues. Their strategy includes grassroots mobilization and policy advocacy to drive the transition to renewable energy.
Walmart Inc.: Walmart, headquartered in Bentonville, Arkansas, is a retail giant that has committed to 100% renewable energy across its global operations. The company invests in solar and wind energy projects and encourages its suppliers to adopt sustainable practices. Walmart's business strategy centers on integrating sustainability into its supply chain and operations, leveraging its scale to drive significant change in the retail industry.
Market Key Players
NextEra Energy Resources, LLC
Green Mountain Energy Company
3Degrees Group, Inc.
Nexamp, Inc.
Arcadia
EcoEnclose
MidAmerican Energy Company
Renewable Energy Group, Inc.
Sierra Club
Walmart Inc.
Tesla, Inc.
Duke Energy Corporation
Constellation Energy
Exelon Corporation
EDP Renewables North America LLC
Calpine Corporation
Dominion Energy, Inc.
American Electric Power Company, Inc.
Pacific Gas and Electric Company (PG&E)
Xcel Energy Inc.
Driver:
Government Incentives and Regulations
Government incentives and regulations play a crucial role in driving the Renewable Energy Credit (REC) market. Many countries have implemented renewable portfolio standards (RPS) and offer tax credits, grants, and subsidies to promote renewable energy adoption. These policies encourage utilities and businesses to invest in renewable energy sources like solar and wind. As regulatory frameworks become more stringent regarding carbon emissions, the demand for RECs will increase. This trend is particularly evident in North America and Europe, where ambitious climate goals and supportive legislation create a favorable environment for REC growth.
Corporate Sustainability Goals
An increasing number of corporations are adopting sustainability goals, significantly driving the REC market. Companies are recognizing the importance of reducing their carbon footprints and enhancing their corporate social responsibility (CSR) profiles. As a result, many organizations are purchasing RECs to offset their greenhouse gas emissions and demonstrate their commitment to renewable energy. This trend is particularly pronounced among large corporations in industries such as technology and manufacturing, which are under pressure from consumers and investors to operate sustainably. The focus on sustainability is expected to continue, further fueling the demand for RECs .
Rising Demand for Sustainable Products
The growing demand for sustainable and eco-friendly products is another key driver for the smart fabrics market. Consumers are becoming increasingly conscious of the environmental impact of their purchases, leading to a preference for textiles made from recycled or organic materials. Smart fabrics can contribute to sustainability through innovative production techniques that minimize waste and energy consumption. Brands that incorporate sustainable practices into their smart textile offerings can differentiate themselves in a competitive market, attracting environmentally conscious consumers. This shift towards sustainability is expected to propel market growth in the coming years further.
Restrain:
Complex Regulatory Frameworks
The complexity of regulatory frameworks can pose a significant restraint on the Renewable Energy Credit market. Variability in regulations across different regions and countries can create confusion for businesses and investors. Some regions may have unclear or inconsistent policies regarding the generation, trading, and utilization of RECs. This inconsistency can hinder the effective trading of credits and limit market participation, especially for smaller businesses that may lack the resources to navigate complicated regulatory environments. As a result, the market could experience slower growth due to these barriers.
High Costs of Renewable Energy Projects
The initial high costs associated with renewable energy projects can be a major restraint for the REC market. While the long-term benefits of renewable energy are well-documented, the upfront capital required for solar, wind, and other renewable projects can be substantial. This financial barrier can deter potential investors and limit the number of new projects being developed. In regions where financing options are limited or interest rates are high, this challenge becomes even more pronounced, potentially slowing the overall adoption of renewable energy and consequently the demand for RECs.
Opportunities:
Expansion in Emerging Markets
The growing demand for renewable energy in emerging markets presents a significant opportunity for the REC market. Countries in Asia-Pacific, Latin America, and Africa are increasingly investing in renewable energy infrastructure to meet rising energy demands and improve energy access. This shift towards sustainability creates a fertile ground for the adoption of RECs, as governments and businesses look to capitalize on renewable resources. With ongoing investments and government support, the REC market is expected to see substantial growth in these regions, allowing for a wider implementation of renewable energy projects.
Technological Advancements in Renewable Energy
Technological advancements in renewable energy generation and storage are creating new opportunities for the REC market. Innovations such as improved solar panel efficiency, enhanced wind turbine designs, and advanced battery storage solutions are making renewable energy more accessible and cost-effective. As technology continues to evolve, it can lead to a decrease in production costs, thereby encouraging further investment in renewable energy projects. This will not only increase the supply of renewable energy but also boost the market for RECs, as more entities will seek to acquire credits to meet their sustainability goals.
Trends:
Increasing Adoption of Renewable Energy Certificates by Corporations
A prominent trend in the Renewable Energy Credit (REC) market is the increasing adoption of RECs by corporations as part of their sustainability initiatives. Many companies are committing to carbon neutrality and sustainability goals, often influenced by consumer preferences and investor expectations. To meet these targets, corporations are purchasing RECs to offset their carbon emissions and demonstrate their commitment to renewable energy. This trend is particularly strong in industries such as technology and manufacturing, where large firms are actively seeking ways to enhance their environmental credentials. As corporate social responsibility (CSR) becomes more important, the demand for RECs is expected to rise significantly.
Recent Development:
In September 2024: A consortium of renewable energy companies has formed a partnership aimed at improving the efficiency of renewable energy credit trading. This collaboration focuses on leveraging blockchain technology to enhance transparency and traceability in REC transactions. By integrating advanced digital solutions, the consortium aims to streamline the buying and selling process of RECs, making it more accessible for smaller renewable energy producers.
In July 2024: The U.S. renewable energy credit market is projected to reach nearly $40 billion by 2033, driven by favorable policies like the Inflation Reduction Act and increasing state-level clean energy goals. This growth highlights the rising demand for renewable energy credits, which is expected to triple in size compared to 2022.

 Aerospace And Defence
 Agriculture
 Automotive And Transportation
 Banking And Finance
 Business
 Chemicals And Materials
 Consumer And Retail
 Electronics And Semiconductors
 Food And Beverages
 Machinery & Equipments
 Manufacturing And Construction
 Medical Devices
 Others
 Pharmaceuticals And Healthcare
 Power And Energy
 Sports
 Technology

, Application(Commercial, Residential, Industrial), End User(Corporates, Government, Non-Profit Organizations), Region and Key Players - Industry Segment Overview, Market Dynamics, Competitive Strategies, Trends and Forecast 2025-2034")
, Application(Commercial, Residential, Industrial), End User(Corporates, Government, Non-Profit Organizations), Region and Key Players - Industry Segment Overview, Market Dynamics, Competitive Strategies, Trends and Forecast 2025-2034")
, Application(Commercial, Residential, Industrial), End User(Corporates, Government, Non-Profit Organizations), Region and Key Players - Industry Segment Overview, Market Dynamics, Competitive Strategies, Trends and Forecast 2025-2034")
, Application(Commercial, Residential, Industrial), End User(Corporates, Government, Non-Profit Organizations), Region and Key Players - Industry Segment Overview, Market Dynamics, Competitive Strategies, Trends and Forecast 2025-2034")

