Rental Apps for Real Estate Market Size & Forecast 2034 | 12.9% CAGR
Global Rental Apps for Real Estate Market Size, Share, Analysis Report By Property Type (Commercial, Residential), Platform (Web-Based Platform, Mobile Application), Rental Duration (Long-Term Rentals, Short-Term Rentals), End-Use (Businesses & Organizations, Individual Consumers), Region and Key Players - Industry Segment Overview, Market Dynamics, Competitive Strategies, Trends and Forecast 2025-2034
The Rental Apps for Real Estate Market size is projected to reach approximately USD 41.25 Billion by 2034, up from USD 12.36 Billion in 2024, growing at a CAGR of 12.9% during the forecast period from 2025 to 2034. This growth is driven by the rapid adoption of digital property management solutions, the rise of AI-driven tenant matching systems, and the increasing reliance on mobile-first real estate platforms among millennials and Gen Z renters. With expanding urbanization and cross-border rental activity, rental apps are reshaping how landlords, brokers, and tenants interact — making real estate more transparent, efficient, and data-driven. The integration of AI, blockchain, and predictive analytics will further enhance user trust and streamline property transactions, propelling the market to new heights.
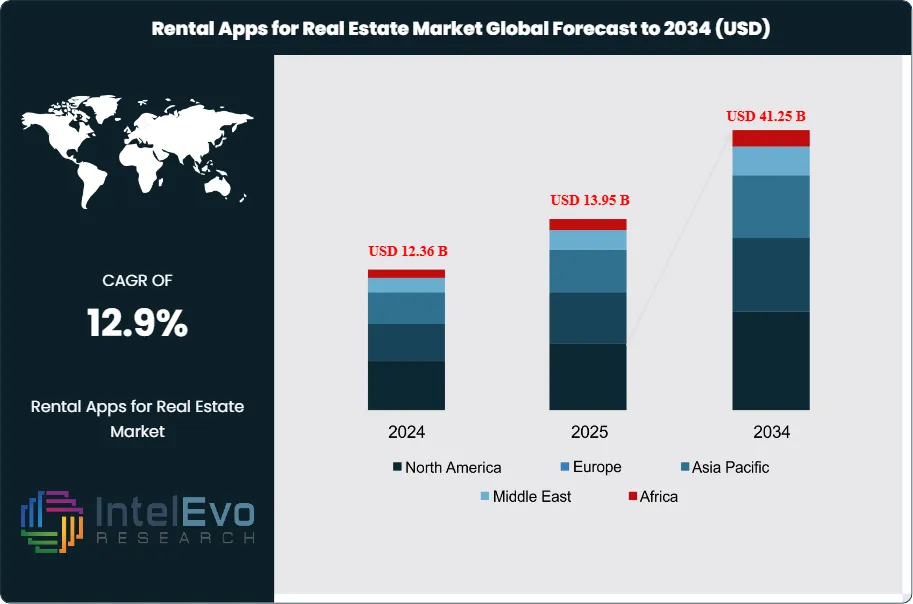
The rental apps market for real estate has undergone substantial transformation over the last decade. Rental apps defined as software platforms designed to connect property owners and tenants for residential or commercial rentals have streamlined transactions, improved visibility, and democratized property access. These solutions typically include Web-Based Platforms and Mobile Applications, providing features like virtual tours, payment gateways, and AI-powered recommendations. Factors driving growth include the rise of mobile internet penetration, demand for short-term rentals, and heightened consumer preference for seamless, contactless renting experiences. Additionally, demographic shifts especially millennial and Gen Z consumers prioritizing flexibility have accelerated platform adoption.
Several elements impact the market: regulatory frameworks, which vary across regions; platform trust and security concerns, critical for user engagement; and rapidly evolving technology, such as machine learning algorithms that personalize property suggestions. Furthermore, fluctuations in housing affordability, urban migration, and the expansion of gig economy lifestyles contribute to sustained demand for rental applications, especially those catering to short-term and individual consumer segments.
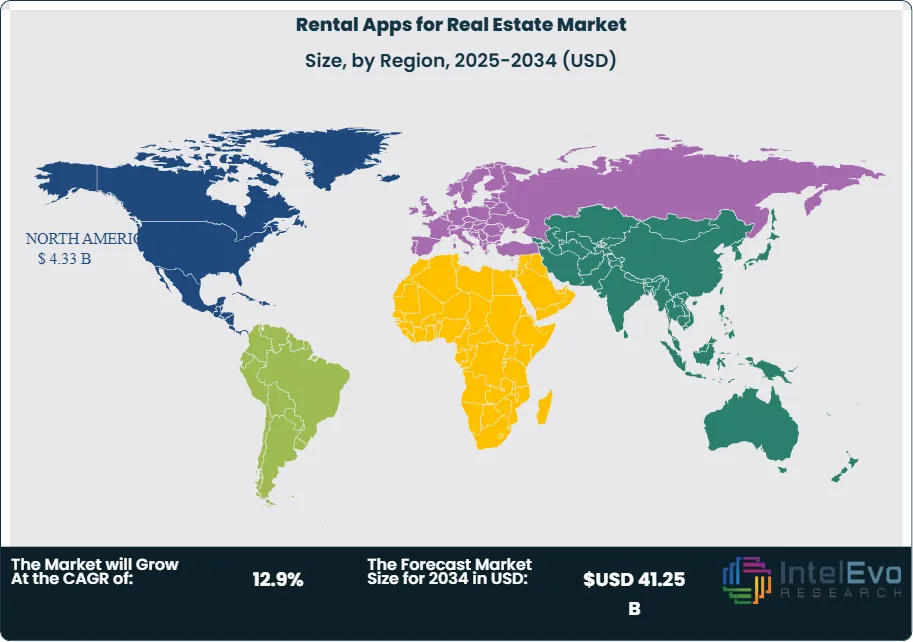
Regionally, North America leads the rental apps market, attributed to high smartphone usage, large volumes of rental transactions, and the prominence of platforms like Zillow, Trulia, and Airbnb. Europe follows closely, with strong growth in Germany and the UK, while Asia Pacific is an emerging frontier propelled by urbanization and technological adoption.
COVID-19 significantly impacted the market, catalyzing digital adoption as in-person property tours declined. Short-term rentals saw volatile demand due to lockdowns, while long-term rentals and relocation services remained resilient. Platforms adapted by offering virtual viewings, flexible cancellations, and enhanced cleaning protocols, establishing lasting shifts in consumer expectations.
Key Takeaways
Market Growth: The Rental Apps for Real Estate Market is expected to reach USD 41.25 Billion by 2034, driven by the convergence of technological innovation, shifting consumer preferences, and increased demand for flexible leasing arrangements.
Property Type Dominance: Residential rental apps dominate the market due to a surge in demand for both long-term and short-term accommodations, especially among millennials and young professionals. The preference for digital-first solutions and remote transactions has further consolidated this segment’s strength.
Platform Dominance: Mobile applications have outpaced web platforms, as consumers increasingly prefer accessing listings, completing transactions, and communicating with landlords via smartphones. Mobile-first design and intuitive user interfaces have cemented their popularity.
Rental Duration Dominance: Short-term rentals, led by platforms like Airbnb, have captured significant market share. Consumers favor the flexibility and convenience these services offer, whether for business travel, relocation, or tourism.
End-Use Dominance: Individual consumers represent the largest end-user group, as private tenants seek a wide variety of property types and durations through convenient digital channels. Platforms tailor experiences to individual needs, strengthening this segment.
Driver: Technological advancements, including AI-powered recommendations, virtual tours, and integrated payment solutions, are key growth drivers. The growing comfort with digital platforms and the demand for frictionless experiences further propel market adoption.
Restraint: Data security concerns and fragmented regulations pose significant restraints. Issues related to user privacy, platform liability, and local compliance often slow market penetration, particularly across multiple jurisdictions.
Opportunity: Rising urbanization in emerging economies presents massive untapped potential. Additionally, the growing popularity of hybrid work models fuels demand for short-term and flexible rental solutions.
Trend: Sustainability and eco-conscious rentals are becoming influential trends. Many platforms are promoting energy-efficient listings and socially responsible practices to attract environmentally minded consumers.
Regional Analysis: North America dominates the market owing to its mature technological ecosystem, high smartphone penetration, and established rental culture. Europe follows, with strong adoption in metropolitan areas, while Asia Pacific shows high growth potential, especially in India and Southeast Asia.
Property Type Analysis:
Residential Leads With nearly 60% Market Share In Rental Apps for Real Estate Market. Residential rental apps are the backbone of the digital real estate ecosystem. They cater to a vast audience of renters looking for apartments, single-family homes, and co-living spaces. Platforms such as Zillow, Redfin, and Trulia have become household names, enabling tenants to compare listings, schedule virtual tours, and finalize leases entirely online. This segment’s dominance is underpinned by affordability challenges in homeownership, which push consumers toward rentals, and by shifting lifestyle preferences that prioritize mobility and convenience. Short-term rentals also fall under residential but differ in purpose and duration, which has allowed platforms like Airbnb and Nestpick to carve out distinct niches.
Platform Analysis:
Mobile applications have revolutionized how property rentals operate. Most major players have invested heavily in mobile-first experiences, recognizing that renters increasingly rely on their smartphones for search, communication, and payments. Apps offer advanced features such as location-based search, push notifications about new listings, and secure messaging between landlords and tenants. The convenience of instant access to property data and the ability to complete transactions on-the-go have made mobile platforms the preferred channel. Additionally, mobile apps often integrate customer reviews, fostering transparency and trust—essential factors driving adoption.
Rental Duration Analysis:
Short-term rentals represent one of the most dynamic and fast-growing areas of the rental apps market. Platforms such as Airbnb have transformed vacation stays and temporary housing, enabling property owners to monetize underutilized spaces. Travelers and remote workers benefit from flexible durations and a broad range of property types, from city apartments to rural cabins. COVID-19 caused short-term rentals to fluctuate dramatically, but the rebound has been strong, with demand recovering faster than traditional hotels in many regions. As hybrid work models become more common, consumers are expected to maintain their preference for short-term, flexible accommodations.
End-Use Analysis:
Individual consumers dominate end-use segments by volume. Unlike businesses and organizations that rent primarily for corporate housing, individuals account for the majority of residential and short-term leases. They often prioritize convenience, affordability, and a wide selection of properties. Rental apps targeting individual consumers focus on creating seamless experiences with features like instant booking, secure payment, and tenant screening. The growth of this segment is also driven by demographic trends, such as millennials delaying homeownership and the rise of digital nomads seeking flexible living arrangements.
Region Analysis:
North America Leads With more than 35% Market Share In Rental Apps for Real Estate Market. North America leads the global rental apps market due to several convergent factors including advanced technological infrastructure, high smartphone penetration rates, established venture capital funding, and mature real estate markets that readily embrace digital innovation. The United States specifically dominates with sophisticated PropTech ecosystems in major metropolitan areas like San Francisco, New York, and Austin. Canada contributes significantly through tech-forward cities like Toronto and Vancouver, where government initiatives support digital real estate transformation.
Europe represents the second-largest market, driven by progressive regulatory frameworks, strong consumer protection laws, and high internet penetration rates. Countries like Germany, United Kingdom, and Netherlands lead European adoption through comprehensive digital infrastructure and tech-savvy populations. The European market emphasizes data privacy compliance and sustainable housing solutions, creating unique opportunities for specialized applications.
Asia-Pacific emerges as the fastest-growing region, fueled by rapid urbanization, expanding middle-class populations, and increasing smartphone adoption. China and India lead this growth through massive urban migration, government smart city initiatives, and venture capital investment in PropTech solutions. The region's diverse regulatory environments create both opportunities and challenges for market expansion.
By App Type (Property Rental Listing Apps, Tenant Management Apps, Real Estate Brokerage Apps, Vacation and Short-Term Rental Apps, Property Investment Apps, Hybrid Real Estate Apps), By Platform Type (Android, iOS, Web-based Platforms, Cross-platform and Cloud-based Solutions), By Property Type (Residential Rentals, Commercial Rentals, Industrial and Warehouse Properties, Co-Living and Shared Spaces, Vacation and Short-Term Rentals), By Rental Duration (Long-Term Rentals, Short-Term Rentals), By Deployment Mode (Cloud-Based, On-Premises), By End User (Property Owners and Landlords, Real Estate Agents and Brokers, Tenants and Renters, Property Management Companies, Real Estate Investors), By Application (Businesses & Organizations, Individual Consumers)
Research Methodology
Primary Research- 100 Interviews of Stakeholders
Secondary Research
Desk Research
Regional scope
North America (United States, Canada, Mexico)
Latin America (Brazil, Argentina, Columbia)
East Asia And Pacific (China, Japan, South Korea, Australia, Cambodia, Fiji, Indonesia)
Sea And South Asia (India, Singapore, Thailand, Taiwan, Malaysia)
Eastern Europe (Poland, Russia, Czech Republic, Romania)
Western Europe (Germany, U.K., France, Spain, Itlay)
Middle East & Africa (GCC Countries, Egypt, Nigeria, South Africa, Israel)
Customization for segments, region/country-level will be provided. Moreover, additional customization can be done based on the requirements.
Pricing and Purchase Options
Avail customized purchase options to meet your exact research needs. We have three licenses to opt for: Single User License, Multi-User License (Up to 5 Users), Corporate Use License (Unlimited User and Printable PDF).
TABLE OF CONTENTS
1. EXECUTIVE SUMMARY
1.1. MARKET SNAPSHOT
1.2. KEY FINDINGS & INSIGHTS
1.3. ANALYST RECOMMENDATIONS
1.4. FUTURE OUTLOOK
2. RESEARCH METHODOLOGY
2.1. MARKET DEFINITION & SCOPE
2.2. RESEARCH OBJECTIVES: PRIMARY & SECONDARY DATA SOURCES
2.3. DATA COLLECTION SOURCES
2.3.1. COVERAGE OF 100+ PRIMARY RESEARCH/CONSULTATION CALLS WITH INDUSTRY STAKEHOLDERS
FIGURE 17 NORTH AMERICA RENTAL APPS FOR REAL ESTATE CURRENT AND FUTURE TYPE ANALYSIS, 2025–2034, (USD MILLION)
FIGURE 18 NORTH AMERICA RENTAL APPS FOR REAL ESTATE CURRENT AND FUTURE END USER ANALYSIS, 2025–2034, (USD MILLION)
FIGURE 19 MARKET SHARE BY COUNTRY
FIGURE 20 LATIN AMERICA RENTAL APPS FOR REAL ESTATE CURRENT AND FUTURE TYPE ANALYSIS, 2025–2034, (USD MILLION)
FIGURE 21 LATIN AMERICA RENTAL APPS FOR REAL ESTATE CURRENT AND FUTURE END USER ANALYSIS, 2025–2034, (USD MILLION)
FIGURE 22 MARKET SHARE BY COUNTRY
FIGURE 23 EASTERN EUROPE RENTAL APPS FOR REAL ESTATE CURRENT AND FUTURE TYPE ANALYSIS, 2025–2034, (USD MILLION)
FIGURE 24 EASTERN EUROPE RENTAL APPS FOR REAL ESTATE CURRENT AND FUTURE END USER ANALYSIS, 2025–2034, (USD MILLION)
FIGURE 25 MARKET SHARE BY COUNTRY
FIGURE 26 WESTERN EUROPE RENTAL APPS FOR REAL ESTATE CURRENT AND FUTURE TYPE ANALYSIS, 2025–2034, (USD MILLION)
FIGURE 27 WESTERN EUROPE RENTAL APPS FOR REAL ESTATE CURRENT AND FUTURE END USER ANALYSIS, 2025–2034, (USD MILLION)
FIGURE 28 MARKET SHARE BY COUNTRY
FIGURE 29 EAST ASIA AND PACIFIC RENTAL APPS FOR REAL ESTATE CURRENT AND FUTURE TYPE ANALYSIS, 2025–2034, (USD MILLION)
FIGURE 30 EAST ASIA AND PACIFIC RENTAL APPS FOR REAL ESTATE CURRENT AND FUTURE END USER ANALYSIS, 2025–2034, (USD MILLION)
FIGURE 31 MARKET SHARE BY COUNTRY
FIGURE 32 SEA AND SOUTH ASIA RENTAL APPS FOR REAL ESTATE CURRENT AND FUTURE TYPE ANALYSIS, 2025–2034, (USD MILLION)
FIGURE 33 SEA AND SOUTH ASIA RENTAL APPS FOR REAL ESTATE CURRENT AND FUTURE END USER ANALYSIS, 2025–2034, (USD MILLION)
FIGURE 34 MARKET SHARE BY COUNTRY
FIGURE 35 MIDDLE EAST AND AFRICA RENTAL APPS FOR REAL ESTATE CURRENT AND FUTURE TYPE ANALYSIS, 2025–2034, (USD MILLION)
FIGURE 36 MIDDLE EAST AND AFRICA RENTAL APPS FOR REAL ESTATE CURRENT AND FUTURE END USER ANALYSIS, 2025–2034, (USD MILLION)
FIGURE 37 NORTH AMERICA RENTAL APPS FOR REAL ESTATE CURRENT AND FUTURE MARKET VOLUME SHARE REGIONAL ANALYSIS, 2025–2034, (USD MILLION)
FIGURE 38 U.S. RENTAL APPS FOR REAL ESTATE CURRENT AND FUTURE TYPE ANALYSIS, 2025–2034, (USD MILLION)
FIGURE 39 U.S. RENTAL APPS FOR REAL ESTATE CURRENT AND FUTURE END USER ANALYSIS, 2025–2034, (USD MILLION)
FIGURE 40 CANADA RENTAL APPS FOR REAL ESTATE CURRENT AND FUTURE TYPE ANALYSIS, 2025–2034, (USD MILLION)
FIGURE 41 CANADA RENTAL APPS FOR REAL ESTATE CURRENT AND FUTURE END USER ANALYSIS, 2025–2034, (USD MILLION)
FIGURE 42 LATIN AMERICA RENTAL APPS FOR REAL ESTATE CURRENT AND FUTURE MARKET VOLUME SHARE REGIONAL ANALYSIS, 2025–2034, (USD MILLION)
FIGURE 43 MEXICO RENTAL APPS FOR REAL ESTATE CURRENT AND FUTURE TYPE ANALYSIS, 2025–2034, (USD MILLION)
FIGURE 44 MEXICO RENTAL APPS FOR REAL ESTATE CURRENT AND FUTURE END USER ANALYSIS, 2025–2034, (USD MILLION)
FIGURE 45 BRAZIL RENTAL APPS FOR REAL ESTATE CURRENT AND FUTURE TYPE ANALYSIS, 2025–2034, (USD MILLION)
FIGURE 46 BRAZIL RENTAL APPS FOR REAL ESTATE CURRENT AND FUTURE END USER ANALYSIS, 2025–2034, (USD MILLION)
FIGURE 47 ARGENTINA RENTAL APPS FOR REAL ESTATE CURRENT AND FUTURE TYPE ANALYSIS, 2025–2034, (USD MILLION)
FIGURE 48 ARGENTINA RENTAL APPS FOR REAL ESTATE CURRENT AND FUTURE END USER ANALYSIS, 2025–2034, (USD MILLION)
FIGURE 49 COLUMBIA RENTAL APPS FOR REAL ESTATE CURRENT AND FUTURE TYPE ANALYSIS, 2025–2034, (USD MILLION)
FIGURE 50 COLUMBIA RENTAL APPS FOR REAL ESTATE CURRENT AND FUTURE END USER ANALYSIS, 2025–2034, (USD MILLION)
FIGURE 51 REST OF LATIN AMERICA RENTAL APPS FOR REAL ESTATE CURRENT AND FUTURE TYPE ANALYSIS, 2025–2034, (USD MILLION)
FIGURE 52 REST OF LATIN AMERICA RENTAL APPS FOR REAL ESTATE CURRENT AND FUTURE END USER ANALYSIS, 2025–2034, (USD MILLION)
FIGURE 53 EASTERN EUROPE RENTAL APPS FOR REAL ESTATE CURRENT AND FUTURE MARKET VOLUME SHARE REGIONAL ANALYSIS, 2025–2034, (USD MILLION)
FIGURE 54 POLAND RENTAL APPS FOR REAL ESTATE CURRENT AND FUTURE TYPE ANALYSIS, 2025–2034, (USD MILLION)
FIGURE 55 POLAND RENTAL APPS FOR REAL ESTATE CURRENT AND FUTURE END USER ANALYSIS, 2025–2034, (USD MILLION)
FIGURE 56 RUSSIA RENTAL APPS FOR REAL ESTATE CURRENT AND FUTURE TYPE ANALYSIS, 2025–2034, (USD MILLION)
FIGURE 57 RUSSIA RENTAL APPS FOR REAL ESTATE CURRENT AND FUTURE END USER ANALYSIS, 2025–2034, (USD MILLION)
FIGURE 58 CZECH REPUBLIC RENTAL APPS FOR REAL ESTATE CURRENT AND FUTURE TYPE ANALYSIS, 2025–2034, (USD MILLION)
FIGURE 59 CZECH REPUBLIC RENTAL APPS FOR REAL ESTATE CURRENT AND FUTURE END USER ANALYSIS, 2025–2034, (USD MILLION)
FIGURE 60 ROMANIA RENTAL APPS FOR REAL ESTATE CURRENT AND FUTURE TYPE ANALYSIS, 2025–2034, (USD MILLION)
FIGURE 61 ROMANIA RENTAL APPS FOR REAL ESTATE CURRENT AND FUTURE END USER ANALYSIS, 2025–2034, (USD MILLION)
FIGURE 62 REST OF EASTERN EUROPE RENTAL APPS FOR REAL ESTATE CURRENT AND FUTURE TYPE ANALYSIS, 2025–2034, (USD MILLION)
FIGURE 63 REST OF EASTERN EUROPE RENTAL APPS FOR REAL ESTATE CURRENT AND FUTURE END USER ANALYSIS, 2025–2034, (USD MILLION)
FIGURE 64 WESTERN EUROPE RENTAL APPS FOR REAL ESTATE CURRENT AND FUTURE MARKET VOLUME SHARE REGIONAL ANALYSIS, 2025–2034, (USD MILLION)
FIGURE 65 GERMANY RENTAL APPS FOR REAL ESTATE CURRENT AND FUTURE TYPE ANALYSIS, 2025–2034, (USD MILLION)
FIGURE 66 GERMANY RENTAL APPS FOR REAL ESTATE CURRENT AND FUTURE END USER ANALYSIS, 2025–2034, (USD MILLION)
FIGURE 67 FRANCE RENTAL APPS FOR REAL ESTATE CURRENT AND FUTURE TYPE ANALYSIS, 2025–2034, (USD MILLION)
FIGURE 68 FRANCE RENTAL APPS FOR REAL ESTATE CURRENT AND FUTURE END USER ANALYSIS, 2025–2034, (USD MILLION)
FIGURE 69 UK RENTAL APPS FOR REAL ESTATE CURRENT AND FUTURE TYPE ANALYSIS, 2025–2034, (USD MILLION)
FIGURE 70 UK RENTAL APPS FOR REAL ESTATE CURRENT AND FUTURE END USER ANALYSIS, 2025–2034, (USD MILLION)
FIGURE 71 SPAIN RENTAL APPS FOR REAL ESTATE CURRENT AND FUTURE TYPE ANALYSIS, 2025–2034, (USD MILLION)
FIGURE 72 SPAIN RENTAL APPS FOR REAL ESTATE CURRENT AND FUTURE END USER ANALYSIS, 2025–2034, (USD MILLION)
FIGURE 73 ITALY RENTAL APPS FOR REAL ESTATE CURRENT AND FUTURE TYPE ANALYSIS, 2025–2034, (USD MILLION)
FIGURE 74 ITALY RENTAL APPS FOR REAL ESTATE CURRENT AND FUTURE END USER ANALYSIS, 2025–2034, (USD MILLION)
FIGURE 75 REST OF WESTERN EUROPE RENTAL APPS FOR REAL ESTATE CURRENT AND FUTURE TYPE ANALYSIS, 2025–2034, (USD MILLION)
FIGURE 76 REST OF WESTERN EUROPE RENTAL APPS FOR REAL ESTATE CURRENT AND FUTURE END USER ANALYSIS, 2025–2034, (USD MILLION)
FIGURE 77 EAST ASIA AND PACIFIC RENTAL APPS FOR REAL ESTATE CURRENT AND FUTURE MARKET VOLUME SHARE REGIONAL ANALYSIS, 2025–2034, (USD MILLION)
FIGURE 78 CHINA RENTAL APPS FOR REAL ESTATE CURRENT AND FUTURE TYPE ANALYSIS, 2025–2034, (USD MILLION)
FIGURE 79 CHINA RENTAL APPS FOR REAL ESTATE CURRENT AND FUTURE END USER ANALYSIS, 2025–2034, (USD MILLION)
FIGURE 80 JAPAN RENTAL APPS FOR REAL ESTATE CURRENT AND FUTURE TYPE ANALYSIS, 2025–2034, (USD MILLION)
FIGURE 81 JAPAN RENTAL APPS FOR REAL ESTATE CURRENT AND FUTURE END USER ANALYSIS, 2025–2034, (USD MILLION)
FIGURE 82 AUSTRALIA RENTAL APPS FOR REAL ESTATE CURRENT AND FUTURE TYPE ANALYSIS, 2025–2034, (USD MILLION)
FIGURE 83 AUSTRALIA RENTAL APPS FOR REAL ESTATE CURRENT AND FUTURE END USER ANALYSIS, 2025–2034, (USD MILLION)
FIGURE 84 CAMBODIA RENTAL APPS FOR REAL ESTATE CURRENT AND FUTURE TYPE ANALYSIS, 2025–2034, (USD MILLION)
FIGURE 85 CAMBODIA RENTAL APPS FOR REAL ESTATE CURRENT AND FUTURE END USER ANALYSIS, 2025–2034, (USD MILLION)
FIGURE 86 FIJI RENTAL APPS FOR REAL ESTATE CURRENT AND FUTURE TYPE ANALYSIS, 2025–2034, (USD MILLION)
FIGURE 87 FIJI RENTAL APPS FOR REAL ESTATE CURRENT AND FUTURE END USER ANALYSIS, 2025–2034, (USD MILLION)
FIGURE 88 INDONESIA RENTAL APPS FOR REAL ESTATE CURRENT AND FUTURE TYPE ANALYSIS, 2025–2034, (USD MILLION)
FIGURE 89 INDONESIA RENTAL APPS FOR REAL ESTATE CURRENT AND FUTURE END USER ANALYSIS, 2025–2034, (USD MILLION)
FIGURE 90 SOUTH KOREA RENTAL APPS FOR REAL ESTATE CURRENT AND FUTURE TYPE ANALYSIS, 2025–2034, (USD MILLION)
FIGURE 91 SOUTH KOREA RENTAL APPS FOR REAL ESTATE CURRENT AND FUTURE END USER ANALYSIS, 2025–2034, (USD MILLION)
FIGURE 92 REST OF EAST ASIA AND PACIFIC RENTAL APPS FOR REAL ESTATE CURRENT AND FUTURE TYPE ANALYSIS, 2025–2034, (USD MILLION)
FIGURE 93 REST OF EAST ASIA AND PACIFIC RENTAL APPS FOR REAL ESTATE CURRENT AND FUTURE END USER ANALYSIS, 2025–2034, (USD MILLION)
FIGURE 94 SEA AND SOUTH ASIA RENTAL APPS FOR REAL ESTATE CURRENT AND FUTURE MARKET VOLUME SHARE REGIONAL ANALYSIS, 2025–2034, (USD MILLION)
FIGURE 95 BANGLADESH RENTAL APPS FOR REAL ESTATE CURRENT AND FUTURE TYPE ANALYSIS, 2025–2034, (USD MILLION)
FIGURE 96 BANGLADESH RENTAL APPS FOR REAL ESTATE CURRENT AND FUTURE END USER ANALYSIS, 2025–2034, (USD MILLION)
FIGURE 97 NEW ZEALAND RENTAL APPS FOR REAL ESTATE CURRENT AND FUTURE TYPE ANALYSIS, 2025–2034, (USD MILLION)
FIGURE 98 NEW ZEALAND RENTAL APPS FOR REAL ESTATE CURRENT AND FUTURE END USER ANALYSIS, 2025–2034, (USD MILLION)
FIGURE 99 INDIA RENTAL APPS FOR REAL ESTATE CURRENT AND FUTURE TYPE ANALYSIS, 2025–2034, (USD MILLION)
FIGURE 100 INDIA RENTAL APPS FOR REAL ESTATE CURRENT AND FUTURE END USER ANALYSIS, 2025–2034, (USD MILLION)
FIGURE 101 SINGAPORE RENTAL APPS FOR REAL ESTATE CURRENT AND FUTURE TYPE ANALYSIS, 2025–2034, (USD MILLION)
FIGURE 102 SINGAPORE RENTAL APPS FOR REAL ESTATE CURRENT AND FUTURE END USER ANALYSIS, 2025–2034, (USD MILLION)
FIGURE 103 THAILAND RENTAL APPS FOR REAL ESTATE CURRENT AND FUTURE TYPE ANALYSIS, 2025–2034, (USD MILLION)
FIGURE 104 THAILAND RENTAL APPS FOR REAL ESTATE CURRENT AND FUTURE END USER ANALYSIS, 2025–2034, (USD MILLION)
FIGURE 105 TAIWAN RENTAL APPS FOR REAL ESTATE CURRENT AND FUTURE TYPE ANALYSIS, 2025–2034, (USD MILLION)
FIGURE 106 TAIWAN RENTAL APPS FOR REAL ESTATE CURRENT AND FUTURE END USER ANALYSIS, 2025–2034, (USD MILLION)
FIGURE 107 MALAYSIA RENTAL APPS FOR REAL ESTATE CURRENT AND FUTURE TYPE ANALYSIS, 2025–2034, (USD MILLION)
FIGURE 108 MALAYSIA RENTAL APPS FOR REAL ESTATE CURRENT AND FUTURE END USER ANALYSIS, 2025–2034, (USD MILLION)
FIGURE 109 REST OF SEA AND SOUTH ASIA RENTAL APPS FOR REAL ESTATE CURRENT AND FUTURE TYPE ANALYSIS, 2025–2034, (USD MILLION)
FIGURE 110 REST OF SEA AND SOUTH ASIA RENTAL APPS FOR REAL ESTATE CURRENT AND FUTURE END USER ANALYSIS, 2025–2034, (USD MILLION)
FIGURE 111 MIDDLE EAST AND AFRICA RENTAL APPS FOR REAL ESTATE CURRENT AND FUTURE MARKET VOLUME SHARE REGIONAL ANALYSIS, 2025–2034, (USD MILLION)
FIGURE 112 GCC COUNTRIES RENTAL APPS FOR REAL ESTATE CURRENT AND FUTURE TYPE ANALYSIS, 2025–2034, (USD MILLION)
FIGURE 113 GCC COUNTRIES RENTAL APPS FOR REAL ESTATE CURRENT AND FUTURE END USER ANALYSIS, 2025–2034, (USD MILLION)
FIGURE 114 SAUDI ARABIA RENTAL APPS FOR REAL ESTATE CURRENT AND FUTURE TYPE ANALYSIS, 2025–2034, (USD MILLION)
FIGURE 115 SAUDI ARABIA RENTAL APPS FOR REAL ESTATE CURRENT AND FUTURE END USER ANALYSIS, 2025–2034, (USD MILLION)
FIGURE 116 UAE RENTAL APPS FOR REAL ESTATE CURRENT AND FUTURE TYPE ANALYSIS, 2025–2034, (USD MILLION)
FIGURE 117 UAE RENTAL APPS FOR REAL ESTATE CURRENT AND FUTURE END USER ANALYSIS, 2025–2034, (USD MILLION)
FIGURE 118 BAHRAIN RENTAL APPS FOR REAL ESTATE CURRENT AND FUTURE TYPE ANALYSIS, 2025–2034, (USD MILLION)
FIGURE 119 BAHRAIN RENTAL APPS FOR REAL ESTATE CURRENT AND FUTURE END USER ANALYSIS, 2025–2034, (USD MILLION)
FIGURE 120 KUWAIT RENTAL APPS FOR REAL ESTATE CURRENT AND FUTURE TYPE ANALYSIS, 2025–2034, (USD MILLION)
FIGURE 121 KUWAIT RENTAL APPS FOR REAL ESTATE CURRENT AND FUTURE END USER ANALYSIS, 2025–2034, (USD MILLION)
FIGURE 122 OMAN RENTAL APPS FOR REAL ESTATE CURRENT AND FUTURE TYPE ANALYSIS, 2025–2034, (USD MILLION)
FIGURE 123 OMAN RENTAL APPS FOR REAL ESTATE CURRENT AND FUTURE END USER ANALYSIS, 2025–2034, (USD MILLION)
FIGURE 124 QATAR RENTAL APPS FOR REAL ESTATE CURRENT AND FUTURE TYPE ANALYSIS, 2025–2034, (USD MILLION)
FIGURE 125 QATAR RENTAL APPS FOR REAL ESTATE CURRENT AND FUTURE END USER ANALYSIS, 2025–2034, (USD MILLION)
FIGURE 126 EGYPT RENTAL APPS FOR REAL ESTATE CURRENT AND FUTURE TYPE ANALYSIS, 2025–2034, (USD MILLION)
FIGURE 127 EGYPT RENTAL APPS FOR REAL ESTATE CURRENT AND FUTURE END USER ANALYSIS, 2025–2034, (USD MILLION)
FIGURE 128 NIGERIA RENTAL APPS FOR REAL ESTATE CURRENT AND FUTURE TYPE ANALYSIS, 2025–2034, (USD MILLION)
FIGURE 129 NIGERIA RENTAL APPS FOR REAL ESTATE CURRENT AND FUTURE END USER ANALYSIS, 2025–2034, (USD MILLION)
FIGURE 130 SOUTH AFRICA RENTAL APPS FOR REAL ESTATE CURRENT AND FUTURE TYPE ANALYSIS, 2025–2034, (USD MILLION)
FIGURE 131 SOUTH AFRICA RENTAL APPS FOR REAL ESTATE CURRENT AND FUTURE END USER ANALYSIS, 2025–2034, (USD MILLION)
FIGURE 132 ISRAEL RENTAL APPS FOR REAL ESTATE CURRENT AND FUTURE TYPE ANALYSIS, 2025–2034, (USD MILLION)
FIGURE 133 ISRAEL RENTAL APPS FOR REAL ESTATE CURRENT AND FUTURE END USER ANALYSIS, 2025–2034, (USD MILLION)
FIGURE 134 REST OF MEA RENTAL APPS FOR REAL ESTATE CURRENT AND FUTURE TYPE ANALYSIS, 2025–2034, (USD MILLION)
FIGURE 135 REST OF MEA RENTAL APPS FOR REAL ESTATE CURRENT AND FUTURE END USER ANALYSIS, 2025–2034, (USD MILLION)
FIGURE 136 U. S. MARKET SHARE ANALYSIS BY TYPE (2024)
FIGURE 137 U. S. MARKET SHARE ANALYSIS BY END USER (2024)
FIGURE 138 CANADA MARKET SHARE ANALYSIS BY TYPE (2024)
FIGURE 139 CANADA MARKET SHARE ANALYSIS BY END USER (2024)
FIGURE 140 MEXICO MARKET SHARE ANALYSIS BY TYPE (2024)
FIGURE 141 MEXICO MARKET SHARE ANALYSIS BY END USER (2024)
FIGURE 142 CHINA MARKET SHARE ANALYSIS BY TYPE (2024)
FIGURE 143 CHINA MARKET SHARE ANALYSIS BY END USER (2024)
FIGURE 144 JAPAN MARKET SHARE ANALYSIS BY TYPE (2024)
FIGURE 145 JAPAN MARKET SHARE ANALYSIS BY END USER (2024)
FIGURE 146 INDIA MARKET SHARE ANALYSIS BY TYPE (2024)
FIGURE 147 INDIA MARKET SHARE ANALYSIS BY END USER (2024)
FIGURE 148 SOUTH KOREA MARKET SHARE ANALYSIS BY TYPE (2024)
FIGURE 149 SOUTH KOREA MARKET SHARE ANALYSIS BY END USER (2024)
FIGURE 150 SAUDI ARABIA MARKET SHARE ANALYSIS BY TYPE (2024)
FIGURE 151 SAUDI ARABIA MARKET SHARE ANALYSIS BY END USER (2024)
FIGURE 152 UAE MARKET SHARE ANALYSIS BY TYPE (2024)
FIGURE 153 UAE MARKET SHARE ANALYSIS BY END USER (2024)
FIGURE 154 EGYPT MARKET SHARE ANALYSIS BY TYPE (2024)
FIGURE 155 EGYPT MARKET SHARE ANALYSIS BY END USER (2024)
FIGURE 156 NIGERIA MARKET SHARE ANALYSIS BY TYPE (2024)
FIGURE 157 NIGERIA MARKET SHARE ANALYSIS BY END USER (2024)
FIGURE 158 SOUTH AFRICA MARKET SHARE ANALYSIS BY TYPE (2024)
FIGURE 159 SOUTH AFRICA MARKET SHARE ANALYSIS BY END USER (2024)
FIGURE 160 GERMANY MARKET SHARE ANALYSIS BY TYPE (2024)
FIGURE 161 GERMANY MARKET SHARE ANALYSIS BY END USER (2024)
FIGURE 162 FRANCE MARKET SHARE ANALYSIS BY TYPE (2024)
FIGURE 163 FRANCE MARKET SHARE ANALYSIS BY END USER (2024)
FIGURE 164 UK MARKET SHARE ANALYSIS BY TYPE (2024)
FIGURE 165 UK MARKET SHARE ANALYSIS BY END USER (2024)
FIGURE 166 SPAIN MARKET SHARE ANALYSIS BY TYPE (2024)
FIGURE 167 SPAIN MARKET SHARE ANALYSIS BY END USER (2024)
FIGURE 168 ITALY MARKET SHARE ANALYSIS BY TYPE (2024)
FIGURE 169 ITALY MARKET SHARE ANALYSIS BY END USER (2024)
FIGURE 170 BRAZIL MARKET SHARE ANALYSIS BY TYPE (2024)
FIGURE 171 BRAZIL MARKET SHARE ANALYSIS BY END USER (2024)
FIGURE 172 ARGENTINA MARKET SHARE ANALYSIS BY TYPE (2024)
FIGURE 173 ARGENTINA MARKET SHARE ANALYSIS BY END USER (2024)
FIGURE 174 COLUMBIA MARKET SHARE ANALYSIS BY TYPE (2024)
FIGURE 175 COLUMBIA MARKET SHARE ANALYSIS BY END USER (2024)
FIGURE 176 GLOBAL RENTAL APPS FOR REAL ESTATE CURRENT AND FUTURE MARKET KEY COUNTRY LEVEL ANALYSIS, 2024–2034, (USD MILLION)
FIGURE 177 FINANCIAL OVERVIEW:
Key Players Analysis:
Airbnb, Inc. - Airbnb stands as the undisputed giant in the short-term rental segment, revolutionizing the hospitality industry through its peer-to-peer platform that connects property owners with travelers seeking unique accommodation experiences. The company's market dominance stems from its first-mover advantage, global reach spanning over 220 countries and regions, and comprehensive ecosystem that includes host services, guest protections, and integrated payment systems. Airbnb's platform facilitates millions of bookings annually, generating substantial revenue through commission fees while maintaining relatively low operational overhead compared to traditional hospitality companies.
Zillow Group, Inc. - Zillow Group represents a dominant force in the North American real estate technology sector, operating comprehensive platforms that serve both rental and sales markets through integrated solutions. The company's rental division benefits from massive traffic generation through its popular real estate portal, providing substantial lead generation capabilities and market visibility. Zillow's extensive property database, combined with proprietary valuation models and market analytics, creates significant competitive advantages in property recommendation and pricing intelligence.
Nestpick GmbH - Nestpick has established itself as a significant player in the European mid-term rental market, specializing in furnished apartments and co-living spaces that cater to digital nomads, relocating professionals, and students. The company's focus on quality-curated properties and comprehensive tenant services differentiates it from broader marketplace approaches, creating premium positioning and higher customer satisfaction rates. Nestpick's platform combines traditional rental services with modern technology, offering features like virtual tours, digital lease signing, and integrated utility management.
Zumper, Inc.- Zumper has carved out a strong position in the North American rental market through its mobile-first platform that emphasizes user experience, comprehensive property listings, and integrated application processes. The company's focus on major metropolitan markets and partnership strategies with property management companies and landlords provides access to high-quality inventory and exclusive listings. Zumper's platform includes features like 3D tours, instant messaging, and streamlined application processes that significantly reduce time-to-lease for both tenants and property owners.
Market Key Players
Airbnb, Inc.
Nestpick GmbH
Zillow Group, Inc.
RentHop, Inc.
Move, Inc.
Rentberry, Inc.
Trulia, Inc.
PropertyNest, Inc.
Redfin Corporation
StreetEasy, LLC
Apartment Finder, LLC
RentPath, LLC
Compass, Inc.
Homesnap, Inc.
Zumper, Inc.
Oodle, Inc.
Apartments.com LLC
Roomster Corporation
Driver:
Technological Advancements:
Technology has been instrumental in redefining the rental experience. Platforms now leverage AI and big data to provide personalized recommendations, improving match quality between tenants and landlords. Virtual and augmented reality allow prospective tenants to tour properties remotely, reducing the time and cost of decision-making. Integrated payment systems have streamlined transactions, while AI-powered chatbots ensure round-the-clock support. These innovations address major friction points in traditional renting, encouraging more users to adopt digital solutions.
Shifting Consumer Preferences:
Modern consumers, especially millennials and Gen Z, expect seamless, on-demand services across industries. The rise of remote work and the gig economy has driven demand for flexible living arrangements, with many tenants preferring monthly rentals over long-term commitments. Rental apps that offer intuitive interfaces, transparent pricing, and rapid onboarding have a competitive advantage. As digital-first behaviors become entrenched, this driver will continue to fuel market expansion.
Restrain:
Data Security and Privacy Concerns:
Data breaches, identity theft, and misuse of personal information remain significant threats to rental app adoption. Platforms collect sensitive data, including banking details and identification documents, making them targets for cybercriminals. Regulatory frameworks like GDPR impose strict compliance requirements, increasing operational complexity. Any compromise in data security can erode consumer trust, slow adoption, and result in financial penalties.
Regulatory Fragmentation:
The rental market is heavily regulated and varies by jurisdiction. Short-term rental regulations differ widely between cities, creating compliance challenges for platforms operating in multiple regions. Zoning laws, licensing requirements, and tax obligations often change, making it difficult for companies to scale consistently. This fragmented regulatory landscape constrains growth and increases legal risks for rental app providers.
Opportunities:
Urbanization in Emerging Markets
Rapid urbanization in developing countries offers a vast, untapped customer base. As more people migrate to cities, the need for rental housing—and platforms that facilitate transactions—rises sharply. Asia Pacific, Latin America, and parts of Africa present immense growth potential, especially for mobile-first rental applications catering to young, tech-savvy populations.
Expansion of Hybrid Work Models
The shift toward hybrid and remote work has created sustained demand for short-term, flexible rentals. Digital nomads and traveling professionals are increasingly seeking platforms that enable monthly rentals with minimal paperwork. Companies that can tailor offerings to this segment will benefit from recurring demand and long-term customer relationships.
Trends:
Sustainability and Eco-Friendly Listings
Consumers are prioritizing environmental considerations when choosing rentals. Platforms are responding by highlighting properties with energy-efficient appliances, sustainable materials, and eco-certifications. This trend not only addresses consumer preferences but also differentiates platforms in a crowded market.
Integration of Value-Added Services
Beyond listing properties, rental apps are integrating services such as insurance, furnishing rentals, utility management, and credit reporting. This end-to-end approach enhances customer loyalty and creates additional revenue streams, signaling a shift toward platform ecosystems rather than standalone applications.
Recent Development
In June 2025: AppFolio unveiled two advanced AI agents Realm‑X Leasing Performer and Realm‑X Maintenance Performer—at the NAA Apartmentalize conference, marking a significant leap in property management technology. These new tools are designed to automate and streamline critical workflows for property managers, delivering both efficiency and improved resident experiences.
In March 2025: Rocket Companies, a leading mortgage lender, has announced its agreement to acquire Redfin, a prominent online real estate brokerage, in an all-stock transaction valued at $1.75 billion. This strategic move brings together two major players in the home buying and financing ecosystem, combining Rocket’s expertise in digital mortgage solutions with Redfin’s technology-driven real estate services.