Global RFID Tags Market Size, Share & Technology Analysis By Type (Passive, Active, Semi-Passive), By Frequency (LF, HF, UHF), By Application (Retail, Logistics, Healthcare, Industrial), By End User, Global Adoption Trends, Key Players & Forecast 2025–2034
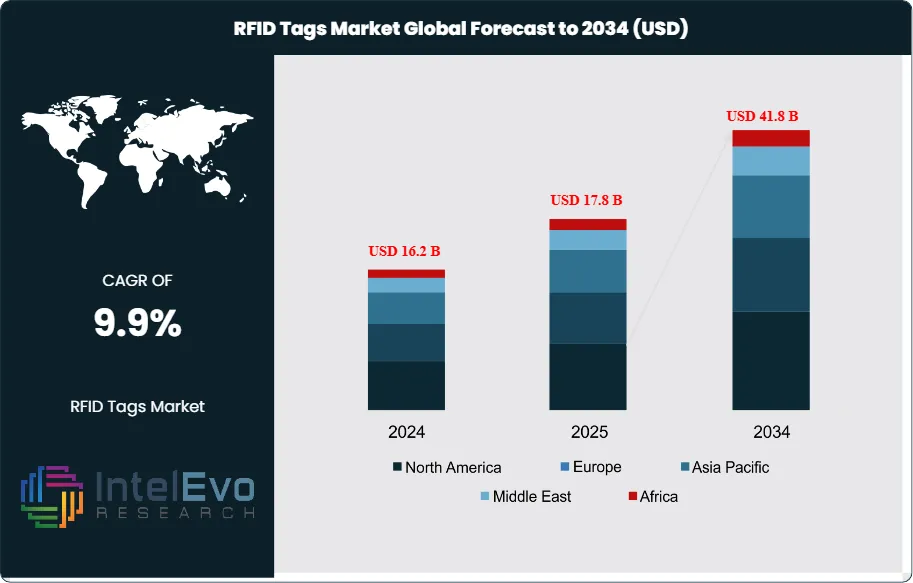
The RFID Tags Market is estimated at USD 16.2 billion in 2024 and is projected to reach approximately USD 41.8 billion by 2034, registering a CAGR of about 9.9% during 2025–2034. Growth is underpinned by large-scale deployment of item-level tagging across retail, logistics, healthcare, and manufacturing, supported by declining tag costs and expanding interoperability standards.
The market expanded steadily between 2020 and 2023 as retailers, logistics operators, healthcare providers, and automotive manufacturers embedded RFID tags to improve inventory accuracy and reduce shrinkage. In 2023, North America led the market with a 34.8% share, generating approximately USD 4.9 billion in revenue, driven by early adoption in retail apparel, omnichannel fulfillment, and asset-intensive industries. Europe remained resilient, supported by growing apparel and industrial deployments, while Asia Pacific emerged as the fastest-growing region on the back of manufacturing upgrades in China and India and rising investments in public and private logistics infrastructure.
Demand is anchored in measurable operational and financial benefits. Industry data indicate that 52% of RFID tags are deployed for traceability and efficiency, with implementations delivering up to a 93% reduction in inventory management costs, a 60% decline in losses, and inventory accuracy improvements exceeding 25%. Retailers such as Inditex have highlighted unknown product losses of up to 0.8% of sales (around €100 million), while Grupo Éxito reported dramatic reductions in inventory costs and shrinkage following RFID rollout. These quantifiable gains continue to justify large-scale, multi-site implementations.
On the supply side, passive UHF RFID tags dominate global volumes, supported by economies of scale that have pushed high-volume inlay prices below USD 0.10 per unit. Active and battery-assisted tags address specialized use cases such as long-range tracking, cold-chain monitoring, and high-value asset management. Widespread adoption of standards including EPC Gen2, ISO/IEC 18000-6C, and the RAIN RFID ecosystem ensures interoperability, enabling enterprises to scale deployments across geographies and applications with reduced vendor lock-in.
Hardware and system capabilities continue to advance, expanding RFID’s addressable market. Vendors are introducing ruggedized readers and specialized tags designed for metal surfaces, high temperatures, and outdoor environments. For example, ID Tech Solutions launched the IDT 87 UHF reader in July 2024, targeting mine gates, factory entrances, and weighbridges in India. Integration with IoT platforms, AI-driven analytics, and cloud-based event management systems is further extending RFID adoption into smart manufacturing, automated warehouses, and city-scale logistics networks.
Looking ahead, near-term growth pools include apparel, pharmaceuticals, cold-chain logistics, automotive parts, and parcel delivery networks. Asia Pacific—particularly India—along with select Middle Eastern logistics hubs, is expected to attract the highest investment activity over the next decade. However, key risks remain, including upfront system costs, legacy IT integration challenges, RF performance issues near metal and liquids, spectrum and data-privacy compliance, and end-of-life materials management. Vendors that combine low-cost tags, robust hardware, and analytics-driven platforms will be best positioned to capture sustained growth through 2034.
Key Takeaways
Market Growth: The market will grow from USD 16.2 billion in 2024 to USD 41.8 billion by 2034. This implies a 9.9% CAGR, driven by item-level retail deployments, logistics automation, and healthcare asset tracking.
By Tag Type: Passive tags led with a 71.4% share in 2023 due to low unit cost and broad use cases. Inlay prices commonly fall below USD 0.10, which supports large-scale rollouts.
By Frequency: UHF tags held 58.1% share in 2023 as they support long-range portal reads and high throughput. RAIN RFID standards enable interoperability across supply chains.
Driver: Deployments lift inventory accuracy by 25.4% and cut inventory management costs by up to 93%, with losses down 60%. 52% of tags target traceability and efficiency, which sustains repeat spending.
Restraint: Upfront system cost and integration complexity slow multi-site rollouts. Adoption remains early in parts of Europe, with only 22.58% of Spanish firms using RFID post production; GDPR penalties can reach 4% of global turnover.
Opportunity: The market will add USD 21.3 billion in incremental value over 2023–2033. Healthcare and pharma tracking, cold chain, and India’s logistics upgrades present near-term wins you can target.
Trend: IoT and AI-enabled analytics are shifting RFID to real-time event management in the cloud. Vendors are releasing outdoor readers such as ID Tech Solutions’ IDT-87 in July 2024, while smaller on-metal and high-temperature tags broaden use cases.
Regional Analysis: North America led with a 34.8% share and USD 4.9 billion revenue in 2023. Asia Pacific is set to grow fastest on manufacturing and logistics investments in China and India; you should watch India and select Middle Eastern hubs, while Europe shows steady scaling with Spain’s 22.58% adoption signaling runway.
Type Analysis
Passive RFID tags remain the volume and value anchor in 2025. They held about 71.4% share in 2023 and are on track to stay above 70% through 2027 as inlay prices frequently sit below USD 0.10. Apparel, parcel, and warehouse deployments account for the bulk of units, with tens of billions of RAIN RFID tags shipped globally each year. You can expect continued migration from barcodes to item-level tagging across general merchandise and pharmaceuticals.
Active RFID tags deliver lower unit volumes but higher revenue per device. Typical prices range from USD 5 to USD 50 depending on battery life, sensors, and ruggedness. Growth concentrates in high-value asset tracking, cold chain, RTLS in hospitals, and yard management. Battery-assisted passive tags bridge the gap for cold chain and metal-rich environments and are set to outpace the broader market with low-teens CAGR through 2030.
Looking ahead, passive tags should grow in line with the market near 9 to 10% CAGR, supported by retailer mandates and logistics automation. Active tags are poised for faster gains in healthcare and industrial campuses where location accuracy and condition monitoring justify higher spend.
Frequency Analysis
UHF RFID tags continue to lead by a wide margin. They captured 58.1% share in 2023 and are likely to exceed 60% by 2025 as 860 to 960 MHz systems deliver longer read ranges and high throughput. Regulatory bands such as FCC 902 to 928 MHz and ETSI 865 to 868 MHz underpin global rollouts. UHF remains the preferred choice for portals, dock doors, and conveyor-based reads.
HF tags, including NFC at 13.56 MHz, hold steady in consumer and security use cases. With billions of NFC-enabled smartphones in use, HF supports ticketing, payments, and brand authentication at the item level. You gain reach into consumer engagement programs while maintaining short read ranges for controlled interactions.
LF tags serve access control, livestock identification, and vehicle immobilizers. They offer robust performance near metal and liquids, though read ranges are short. Growth remains modest and specialized, with deployments concentrated in regulated identification and industrial environments.
End-Use Industry Analysis
Transportation and logistics will account for the largest incremental spend through 2030. Operators deploy UHF at gates and cross-docks to raise throughput and shrink lead times. Studies indicate 52% of RFID tags target traceability and efficiency, with users reporting up to a 93% cut in inventory management costs and a 60% drop in losses after rollout.
Retail held over 25.3% share in 2023 and expanded its footprint in 2025 as omnichannel fulfillment scales. Item-level tagging raises inventory accuracy by 25.4% and reduces shrink. Inditex reported unknown losses near 0.8% of sales, or around EUR 100 million, highlighting the savings potential when you track every item across stores and DCs.
Healthcare adoption accelerates on medication tracking, surgical kit management, and RTLS for equipment and patients. Hospitals favor active and battery-assisted tags for room-level accuracy and condition monitoring, supporting double-digit growth. Agriculture and other industries add steady demand for livestock tagging, returnable transport items, and MRO parts bins.
Regional Analysis
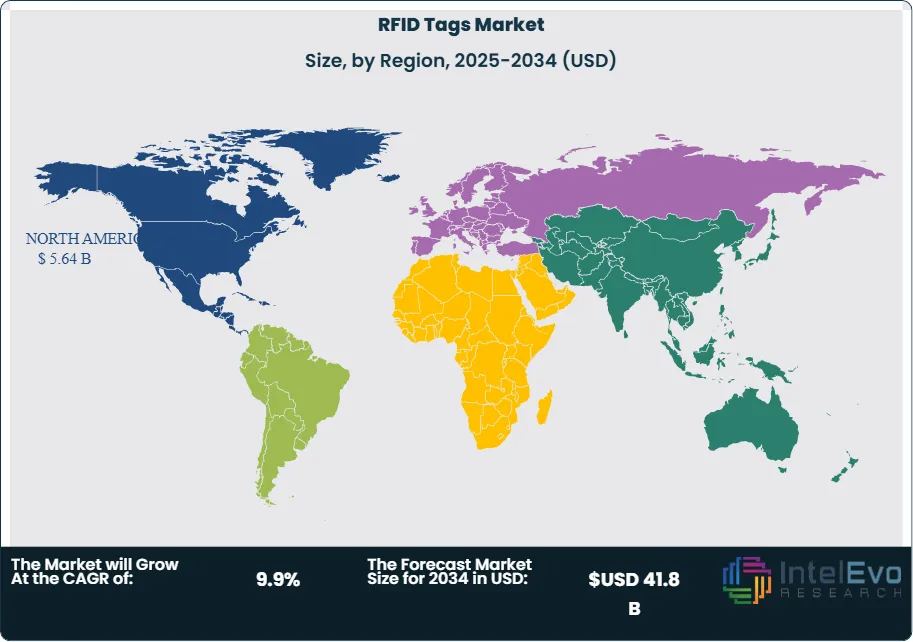
North America led with 34.8% share and USD 4.9 billion revenue in 2023. Based on the market trajectory, regional revenues are set to approach USD 5.8 to 6.0 billion in 2025 as retailers broaden mandates and parcel networks expand automation. Healthcare providers scale RTLS and pharmacy tracking, reinforcing recurring spend on tags and readers.
Europe advances on manufacturing and automotive use cases. Surveys show 94% of European decision-makers expect RFID to be critical for supply chain visibility within five years. Adoption remains uneven by country; in Spain, 22.58% of firms use RFID after production, pointing to significant runway. Compliance needs and data governance shape deployments across the EU and UK.
Asia Pacific delivers the fastest CAGR through 2030 on manufacturing upgrades in China, retail and logistics adoption in India, and regional e-commerce growth. Latin America sees traction in apparel and grocery, with cases such as Grupo Éxito reporting a 93% drop in inventory costs and a 60% decline in losses. The Middle East and Africa gain momentum in GCC logistics hubs and national ID and access programs, creating targeted opportunities for you in ports, airports, and industrial parks.
By Type, Passive RFID Tags, Active RFID Tags, By Frequency, Ultra-High Frequency (UHF) RFID Tags, Low-Frequency (LF) RFID Tags, High-Frequency (HF) RFID Tags, By End-Use Industry, Transportation and Logistics, Retail, Agriculture, Healthcare, Other End-Use Industrie
Research Methodology
Primary Research- 100 Interviews of Stakeholders
Secondary Research
Desk Research
Regional scope
North America (United States, Canada, Mexico)
Latin America (Brazil, Argentina, Columbia)
East Asia And Pacific (China, Japan, South Korea, Australia, Cambodia, Fiji, Indonesia)
Sea And South Asia (India, Singapore, Thailand, Taiwan, Malaysia)
Eastern Europe (Poland, Russia, Czech Republic, Romania)
Western Europe (Germany, U.K., France, Spain, Itlay)
Middle East & Africa (GCC Countries, Egypt, Nigeria, South Africa, Israel)
Customization for segments, region/country-level will be provided. Moreover, additional customization can be done based on the requirements.
Pricing and Purchase Options
Avail customized purchase options to meet your exact research needs. We have three licenses to opt for: Single User License, Multi-User License (Up to 5 Users), Corporate Use License (Unlimited User and Printable PDF).
TABLE OF CONTENTS
1. EXECUTIVE SUMMARY
1.1. MARKET SNAPSHOT
1.2. KEY FINDINGS & INSIGHTS
1.3. ANALYST RECOMMENDATIONS
1.4. FUTURE OUTLOOK
2. RESEARCH METHODOLOGY
2.1. MARKET DEFINITION & SCOPE
2.2. RESEARCH OBJECTIVES: PRIMARY & SECONDARY DATA SOURCES
2.3. DATA COLLECTION SOURCES
2.3.1. COVERAGE OF 100+ PRIMARY RESEARCH/CONSULTATION CALLS WITH INDUSTRY STAKEHOLDERS
FIGURE 17 NORTH AMERICA RFID TAGS CURRENT AND FUTURE TYPE ANALYSIS, 2025–2034, (USD MILLION)
FIGURE 18 NORTH AMERICA RFID TAGS CURRENT AND FUTURE END USER ANALYSIS, 2025–2034, (USD MILLION)
FIGURE 19 MARKET SHARE BY COUNTRY
FIGURE 20 LATIN AMERICA RFID TAGS CURRENT AND FUTURE TYPE ANALYSIS, 2025–2034, (USD MILLION)
FIGURE 21 LATIN AMERICA RFID TAGS CURRENT AND FUTURE END USER ANALYSIS, 2025–2034, (USD MILLION)
FIGURE 22 MARKET SHARE BY COUNTRY
FIGURE 23 EASTERN EUROPE RFID TAGS CURRENT AND FUTURE TYPE ANALYSIS, 2025–2034, (USD MILLION)
FIGURE 24 EASTERN EUROPE RFID TAGS CURRENT AND FUTURE END USER ANALYSIS, 2025–2034, (USD MILLION)
FIGURE 25 MARKET SHARE BY COUNTRY
FIGURE 26 WESTERN EUROPE RFID TAGS CURRENT AND FUTURE TYPE ANALYSIS, 2025–2034, (USD MILLION)
FIGURE 27 WESTERN EUROPE RFID TAGS CURRENT AND FUTURE END USER ANALYSIS, 2025–2034, (USD MILLION)
FIGURE 28 MARKET SHARE BY COUNTRY
FIGURE 29 EAST ASIA AND PACIFIC RFID TAGS CURRENT AND FUTURE TYPE ANALYSIS, 2025–2034, (USD MILLION)
FIGURE 30 EAST ASIA AND PACIFIC RFID TAGS CURRENT AND FUTURE END USER ANALYSIS, 2025–2034, (USD MILLION)
FIGURE 31 MARKET SHARE BY COUNTRY
FIGURE 32 SEA AND SOUTH ASIA RFID TAGS CURRENT AND FUTURE TYPE ANALYSIS, 2025–2034, (USD MILLION)
FIGURE 33 SEA AND SOUTH ASIA RFID TAGS CURRENT AND FUTURE END USER ANALYSIS, 2025–2034, (USD MILLION)
FIGURE 34 MARKET SHARE BY COUNTRY
FIGURE 35 MIDDLE EAST AND AFRICA RFID TAGS CURRENT AND FUTURE TYPE ANALYSIS, 2025–2034, (USD MILLION)
FIGURE 36 MIDDLE EAST AND AFRICA RFID TAGS CURRENT AND FUTURE END USER ANALYSIS, 2025–2034, (USD MILLION)
FIGURE 37 NORTH AMERICA RFID TAGS CURRENT AND FUTURE MARKET VOLUME SHARE REGIONAL ANALYSIS, 2025–2034, (USD MILLION)
FIGURE 38 U.S. RFID TAGS CURRENT AND FUTURE TYPE ANALYSIS, 2025–2034, (USD MILLION)
FIGURE 39 U.S. RFID TAGS CURRENT AND FUTURE END USER ANALYSIS, 2025–2034, (USD MILLION)
FIGURE 40 CANADA RFID TAGS CURRENT AND FUTURE TYPE ANALYSIS, 2025–2034, (USD MILLION)
FIGURE 41 CANADA RFID TAGS CURRENT AND FUTURE END USER ANALYSIS, 2025–2034, (USD MILLION)
FIGURE 42 LATIN AMERICA RFID TAGS CURRENT AND FUTURE MARKET VOLUME SHARE REGIONAL ANALYSIS, 2025–2034, (USD MILLION)
FIGURE 43 MEXICO RFID TAGS CURRENT AND FUTURE TYPE ANALYSIS, 2025–2034, (USD MILLION)
FIGURE 44 MEXICO RFID TAGS CURRENT AND FUTURE END USER ANALYSIS, 2025–2034, (USD MILLION)
FIGURE 45 BRAZIL RFID TAGS CURRENT AND FUTURE TYPE ANALYSIS, 2025–2034, (USD MILLION)
FIGURE 46 BRAZIL RFID TAGS CURRENT AND FUTURE END USER ANALYSIS, 2025–2034, (USD MILLION)
FIGURE 47 ARGENTINA RFID TAGS CURRENT AND FUTURE TYPE ANALYSIS, 2025–2034, (USD MILLION)
FIGURE 48 ARGENTINA RFID TAGS CURRENT AND FUTURE END USER ANALYSIS, 2025–2034, (USD MILLION)
FIGURE 49 COLUMBIA RFID TAGS CURRENT AND FUTURE TYPE ANALYSIS, 2025–2034, (USD MILLION)
FIGURE 50 COLUMBIA RFID TAGS CURRENT AND FUTURE END USER ANALYSIS, 2025–2034, (USD MILLION)
FIGURE 51 REST OF LATIN AMERICA RFID TAGS CURRENT AND FUTURE TYPE ANALYSIS, 2025–2034, (USD MILLION)
FIGURE 52 REST OF LATIN AMERICA RFID TAGS CURRENT AND FUTURE END USER ANALYSIS, 2025–2034, (USD MILLION)
FIGURE 53 EASTERN EUROPE RFID TAGS CURRENT AND FUTURE MARKET VOLUME SHARE REGIONAL ANALYSIS, 2025–2034, (USD MILLION)
FIGURE 54 POLAND RFID TAGS CURRENT AND FUTURE TYPE ANALYSIS, 2025–2034, (USD MILLION)
FIGURE 55 POLAND RFID TAGS CURRENT AND FUTURE END USER ANALYSIS, 2025–2034, (USD MILLION)
FIGURE 56 RUSSIA RFID TAGS CURRENT AND FUTURE TYPE ANALYSIS, 2025–2034, (USD MILLION)
FIGURE 57 RUSSIA RFID TAGS CURRENT AND FUTURE END USER ANALYSIS, 2025–2034, (USD MILLION)
FIGURE 58 CZECH REPUBLIC RFID TAGS CURRENT AND FUTURE TYPE ANALYSIS, 2025–2034, (USD MILLION)
FIGURE 59 CZECH REPUBLIC RFID TAGS CURRENT AND FUTURE END USER ANALYSIS, 2025–2034, (USD MILLION)
FIGURE 60 ROMANIA RFID TAGS CURRENT AND FUTURE TYPE ANALYSIS, 2025–2034, (USD MILLION)
FIGURE 61 ROMANIA RFID TAGS CURRENT AND FUTURE END USER ANALYSIS, 2025–2034, (USD MILLION)
FIGURE 62 REST OF EASTERN EUROPE RFID TAGS CURRENT AND FUTURE TYPE ANALYSIS, 2025–2034, (USD MILLION)
FIGURE 63 REST OF EASTERN EUROPE RFID TAGS CURRENT AND FUTURE END USER ANALYSIS, 2025–2034, (USD MILLION)
FIGURE 64 WESTERN EUROPE RFID TAGS CURRENT AND FUTURE MARKET VOLUME SHARE REGIONAL ANALYSIS, 2025–2034, (USD MILLION)
FIGURE 65 GERMANY RFID TAGS CURRENT AND FUTURE TYPE ANALYSIS, 2025–2034, (USD MILLION)
FIGURE 66 GERMANY RFID TAGS CURRENT AND FUTURE END USER ANALYSIS, 2025–2034, (USD MILLION)
FIGURE 67 FRANCE RFID TAGS CURRENT AND FUTURE TYPE ANALYSIS, 2025–2034, (USD MILLION)
FIGURE 68 FRANCE RFID TAGS CURRENT AND FUTURE END USER ANALYSIS, 2025–2034, (USD MILLION)
FIGURE 69 UK RFID TAGS CURRENT AND FUTURE TYPE ANALYSIS, 2025–2034, (USD MILLION)
FIGURE 70 UK RFID TAGS CURRENT AND FUTURE END USER ANALYSIS, 2025–2034, (USD MILLION)
FIGURE 71 SPAIN RFID TAGS CURRENT AND FUTURE TYPE ANALYSIS, 2025–2034, (USD MILLION)
FIGURE 72 SPAIN RFID TAGS CURRENT AND FUTURE END USER ANALYSIS, 2025–2034, (USD MILLION)
FIGURE 73 ITALY RFID TAGS CURRENT AND FUTURE TYPE ANALYSIS, 2025–2034, (USD MILLION)
FIGURE 74 ITALY RFID TAGS CURRENT AND FUTURE END USER ANALYSIS, 2025–2034, (USD MILLION)
FIGURE 75 REST OF WESTERN EUROPE RFID TAGS CURRENT AND FUTURE TYPE ANALYSIS, 2025–2034, (USD MILLION)
FIGURE 76 REST OF WESTERN EUROPE RFID TAGS CURRENT AND FUTURE END USER ANALYSIS, 2025–2034, (USD MILLION)
FIGURE 77 EAST ASIA AND PACIFIC RFID TAGS CURRENT AND FUTURE MARKET VOLUME SHARE REGIONAL ANALYSIS, 2025–2034, (USD MILLION)
FIGURE 78 CHINA RFID TAGS CURRENT AND FUTURE TYPE ANALYSIS, 2025–2034, (USD MILLION)
FIGURE 79 CHINA RFID TAGS CURRENT AND FUTURE END USER ANALYSIS, 2025–2034, (USD MILLION)
FIGURE 80 JAPAN RFID TAGS CURRENT AND FUTURE TYPE ANALYSIS, 2025–2034, (USD MILLION)
FIGURE 81 JAPAN RFID TAGS CURRENT AND FUTURE END USER ANALYSIS, 2025–2034, (USD MILLION)
FIGURE 82 AUSTRALIA RFID TAGS CURRENT AND FUTURE TYPE ANALYSIS, 2025–2034, (USD MILLION)
FIGURE 83 AUSTRALIA RFID TAGS CURRENT AND FUTURE END USER ANALYSIS, 2025–2034, (USD MILLION)
FIGURE 84 CAMBODIA RFID TAGS CURRENT AND FUTURE TYPE ANALYSIS, 2025–2034, (USD MILLION)
FIGURE 85 CAMBODIA RFID TAGS CURRENT AND FUTURE END USER ANALYSIS, 2025–2034, (USD MILLION)
FIGURE 86 FIJI RFID TAGS CURRENT AND FUTURE TYPE ANALYSIS, 2025–2034, (USD MILLION)
FIGURE 87 FIJI RFID TAGS CURRENT AND FUTURE END USER ANALYSIS, 2025–2034, (USD MILLION)
FIGURE 88 INDONESIA RFID TAGS CURRENT AND FUTURE TYPE ANALYSIS, 2025–2034, (USD MILLION)
FIGURE 89 INDONESIA RFID TAGS CURRENT AND FUTURE END USER ANALYSIS, 2025–2034, (USD MILLION)
FIGURE 90 SOUTH KOREA RFID TAGS CURRENT AND FUTURE TYPE ANALYSIS, 2025–2034, (USD MILLION)
FIGURE 91 SOUTH KOREA RFID TAGS CURRENT AND FUTURE END USER ANALYSIS, 2025–2034, (USD MILLION)
FIGURE 92 REST OF EAST ASIA AND PACIFIC RFID TAGS CURRENT AND FUTURE TYPE ANALYSIS, 2025–2034, (USD MILLION)
FIGURE 93 REST OF EAST ASIA AND PACIFIC RFID TAGS CURRENT AND FUTURE END USER ANALYSIS, 2025–2034, (USD MILLION)
FIGURE 94 SEA AND SOUTH ASIA RFID TAGS CURRENT AND FUTURE MARKET VOLUME SHARE REGIONAL ANALYSIS, 2025–2034, (USD MILLION)
FIGURE 95 BANGLADESH RFID TAGS CURRENT AND FUTURE TYPE ANALYSIS, 2025–2034, (USD MILLION)
FIGURE 96 BANGLADESH RFID TAGS CURRENT AND FUTURE END USER ANALYSIS, 2025–2034, (USD MILLION)
FIGURE 97 NEW ZEALAND RFID TAGS CURRENT AND FUTURE TYPE ANALYSIS, 2025–2034, (USD MILLION)
FIGURE 98 NEW ZEALAND RFID TAGS CURRENT AND FUTURE END USER ANALYSIS, 2025–2034, (USD MILLION)
FIGURE 99 INDIA RFID TAGS CURRENT AND FUTURE TYPE ANALYSIS, 2025–2034, (USD MILLION)
FIGURE 100 INDIA RFID TAGS CURRENT AND FUTURE END USER ANALYSIS, 2025–2034, (USD MILLION)
FIGURE 101 SINGAPORE RFID TAGS CURRENT AND FUTURE TYPE ANALYSIS, 2025–2034, (USD MILLION)
FIGURE 102 SINGAPORE RFID TAGS CURRENT AND FUTURE END USER ANALYSIS, 2025–2034, (USD MILLION)
FIGURE 103 THAILAND RFID TAGS CURRENT AND FUTURE TYPE ANALYSIS, 2025–2034, (USD MILLION)
FIGURE 104 THAILAND RFID TAGS CURRENT AND FUTURE END USER ANALYSIS, 2025–2034, (USD MILLION)
FIGURE 105 TAIWAN RFID TAGS CURRENT AND FUTURE TYPE ANALYSIS, 2025–2034, (USD MILLION)
FIGURE 106 TAIWAN RFID TAGS CURRENT AND FUTURE END USER ANALYSIS, 2025–2034, (USD MILLION)
FIGURE 107 MALAYSIA RFID TAGS CURRENT AND FUTURE TYPE ANALYSIS, 2025–2034, (USD MILLION)
FIGURE 108 MALAYSIA RFID TAGS CURRENT AND FUTURE END USER ANALYSIS, 2025–2034, (USD MILLION)
FIGURE 109 REST OF SEA AND SOUTH ASIA RFID TAGS CURRENT AND FUTURE TYPE ANALYSIS, 2025–2034, (USD MILLION)
FIGURE 110 REST OF SEA AND SOUTH ASIA RFID TAGS CURRENT AND FUTURE END USER ANALYSIS, 2025–2034, (USD MILLION)
FIGURE 111 MIDDLE EAST AND AFRICA RFID TAGS CURRENT AND FUTURE MARKET VOLUME SHARE REGIONAL ANALYSIS, 2025–2034, (USD MILLION)
FIGURE 112 GCC COUNTRIES RFID TAGS CURRENT AND FUTURE TYPE ANALYSIS, 2025–2034, (USD MILLION)
FIGURE 113 GCC COUNTRIES RFID TAGS CURRENT AND FUTURE END USER ANALYSIS, 2025–2034, (USD MILLION)
FIGURE 114 SAUDI ARABIA RFID TAGS CURRENT AND FUTURE TYPE ANALYSIS, 2025–2034, (USD MILLION)
FIGURE 115 SAUDI ARABIA RFID TAGS CURRENT AND FUTURE END USER ANALYSIS, 2025–2034, (USD MILLION)
FIGURE 116 UAE RFID TAGS CURRENT AND FUTURE TYPE ANALYSIS, 2025–2034, (USD MILLION)
FIGURE 117 UAE RFID TAGS CURRENT AND FUTURE END USER ANALYSIS, 2025–2034, (USD MILLION)
FIGURE 118 BAHRAIN RFID TAGS CURRENT AND FUTURE TYPE ANALYSIS, 2025–2034, (USD MILLION)
FIGURE 119 BAHRAIN RFID TAGS CURRENT AND FUTURE END USER ANALYSIS, 2025–2034, (USD MILLION)
FIGURE 120 KUWAIT RFID TAGS CURRENT AND FUTURE TYPE ANALYSIS, 2025–2034, (USD MILLION)
FIGURE 121 KUWAIT RFID TAGS CURRENT AND FUTURE END USER ANALYSIS, 2025–2034, (USD MILLION)
FIGURE 122 OMAN RFID TAGS CURRENT AND FUTURE TYPE ANALYSIS, 2025–2034, (USD MILLION)
FIGURE 123 OMAN RFID TAGS CURRENT AND FUTURE END USER ANALYSIS, 2025–2034, (USD MILLION)
FIGURE 124 QATAR RFID TAGS CURRENT AND FUTURE TYPE ANALYSIS, 2025–2034, (USD MILLION)
FIGURE 125 QATAR RFID TAGS CURRENT AND FUTURE END USER ANALYSIS, 2025–2034, (USD MILLION)
FIGURE 126 EGYPT RFID TAGS CURRENT AND FUTURE TYPE ANALYSIS, 2025–2034, (USD MILLION)
FIGURE 127 EGYPT RFID TAGS CURRENT AND FUTURE END USER ANALYSIS, 2025–2034, (USD MILLION)
FIGURE 128 NIGERIA RFID TAGS CURRENT AND FUTURE TYPE ANALYSIS, 2025–2034, (USD MILLION)
FIGURE 129 NIGERIA RFID TAGS CURRENT AND FUTURE END USER ANALYSIS, 2025–2034, (USD MILLION)
FIGURE 130 SOUTH AFRICA RFID TAGS CURRENT AND FUTURE TYPE ANALYSIS, 2025–2034, (USD MILLION)
FIGURE 131 SOUTH AFRICA RFID TAGS CURRENT AND FUTURE END USER ANALYSIS, 2025–2034, (USD MILLION)
FIGURE 132 ISRAEL RFID TAGS CURRENT AND FUTURE TYPE ANALYSIS, 2025–2034, (USD MILLION)
FIGURE 133 ISRAEL RFID TAGS CURRENT AND FUTURE END USER ANALYSIS, 2025–2034, (USD MILLION)
FIGURE 134 REST OF MEA RFID TAGS CURRENT AND FUTURE TYPE ANALYSIS, 2025–2034, (USD MILLION)
FIGURE 135 REST OF MEA RFID TAGS CURRENT AND FUTURE END USER ANALYSIS, 2025–2034, (USD MILLION)
FIGURE 136 U. S. MARKET SHARE ANALYSIS BY TYPE (2024)
FIGURE 137 U. S. MARKET SHARE ANALYSIS BY END USER (2024)
FIGURE 138 CANADA MARKET SHARE ANALYSIS BY TYPE (2024)
FIGURE 139 CANADA MARKET SHARE ANALYSIS BY END USER (2024)
FIGURE 140 MEXICO MARKET SHARE ANALYSIS BY TYPE (2024)
FIGURE 141 MEXICO MARKET SHARE ANALYSIS BY END USER (2024)
FIGURE 142 CHINA MARKET SHARE ANALYSIS BY TYPE (2024)
FIGURE 143 CHINA MARKET SHARE ANALYSIS BY END USER (2024)
FIGURE 144 JAPAN MARKET SHARE ANALYSIS BY TYPE (2024)
FIGURE 145 JAPAN MARKET SHARE ANALYSIS BY END USER (2024)
FIGURE 146 INDIA MARKET SHARE ANALYSIS BY TYPE (2024)
FIGURE 147 INDIA MARKET SHARE ANALYSIS BY END USER (2024)
FIGURE 148 SOUTH KOREA MARKET SHARE ANALYSIS BY TYPE (2024)
FIGURE 149 SOUTH KOREA MARKET SHARE ANALYSIS BY END USER (2024)
FIGURE 150 SAUDI ARABIA MARKET SHARE ANALYSIS BY TYPE (2024)
FIGURE 151 SAUDI ARABIA MARKET SHARE ANALYSIS BY END USER (2024)
FIGURE 152 UAE MARKET SHARE ANALYSIS BY TYPE (2024)
FIGURE 153 UAE MARKET SHARE ANALYSIS BY END USER (2024)
FIGURE 154 EGYPT MARKET SHARE ANALYSIS BY TYPE (2024)
FIGURE 155 EGYPT MARKET SHARE ANALYSIS BY END USER (2024)
FIGURE 156 NIGERIA MARKET SHARE ANALYSIS BY TYPE (2024)
FIGURE 157 NIGERIA MARKET SHARE ANALYSIS BY END USER (2024)
FIGURE 158 SOUTH AFRICA MARKET SHARE ANALYSIS BY TYPE (2024)
FIGURE 159 SOUTH AFRICA MARKET SHARE ANALYSIS BY END USER (2024)
FIGURE 160 GERMANY MARKET SHARE ANALYSIS BY TYPE (2024)
FIGURE 161 GERMANY MARKET SHARE ANALYSIS BY END USER (2024)
FIGURE 162 FRANCE MARKET SHARE ANALYSIS BY TYPE (2024)
FIGURE 163 FRANCE MARKET SHARE ANALYSIS BY END USER (2024)
FIGURE 164 UK MARKET SHARE ANALYSIS BY TYPE (2024)
FIGURE 165 UK MARKET SHARE ANALYSIS BY END USER (2024)
FIGURE 166 SPAIN MARKET SHARE ANALYSIS BY TYPE (2024)
FIGURE 167 SPAIN MARKET SHARE ANALYSIS BY END USER (2024)
FIGURE 168 ITALY MARKET SHARE ANALYSIS BY TYPE (2024)
FIGURE 169 ITALY MARKET SHARE ANALYSIS BY END USER (2024)
FIGURE 170 BRAZIL MARKET SHARE ANALYSIS BY TYPE (2024)
FIGURE 171 BRAZIL MARKET SHARE ANALYSIS BY END USER (2024)
FIGURE 172 ARGENTINA MARKET SHARE ANALYSIS BY TYPE (2024)
FIGURE 173 ARGENTINA MARKET SHARE ANALYSIS BY END USER (2024)
FIGURE 174 COLUMBIA MARKET SHARE ANALYSIS BY TYPE (2024)
FIGURE 175 COLUMBIA MARKET SHARE ANALYSIS BY END USER (2024)
FIGURE 176 GLOBAL RFID TAGS CURRENT AND FUTURE MARKET KEY COUNTRY LEVEL ANALYSIS, 2024–2034, (USD MILLION)
FIGURE 177 FINANCIAL OVERVIEW:
Key Player Analysis
Alien Technology, LLC: Alien Technology is a niche player focused on UHF RAIN RFID ICs, inlays, and readers for high-volume, item-level deployments across retail and logistics. Its Higgs 9 IC platform offers up to 1,024-bit memory and high read/write sensitivity for demanding applications, supporting EPC Gen2 and ISO 18000-63 standards at 860–960 MHz. The company’s Squiggle inlay and related Higgs-9 variants are widely used for apparel hang tags and general-purpose tagging, giving system integrators reliable performance at scale. Alien’s reader portfolio, including the ALR-9900+ EMA and ALR-F800, targets enterprise portals and industrial sites with strong receive sensitivity and software tooling aligned to major middleware stacks. The firm benefits from market-wide volume expansion as RAIN Alliance estimates 52.8 billion UHF tag chips shipped in 2024, up 17 percent year over year and 54 percent in two years, supporting continued inlay demand growth.
Avery Dennison Corporation: Avery Dennison is a leader in RFID inlays and intelligent labels, supported by global manufacturing scale and deep retail relationships. The company reported 2024 net sales of USD 8.8 billion and targets around 15 percent long-term growth for its Intelligent Labels business, underscoring sustained investment and category expansion. In 2025, the firm advanced sustainability credentials with an APR-recognized RFID label compatible with PET recycling streams, aligning with packaging and circularity mandates that matter to large consumer brands. Recent updates signal ongoing execution strength in intelligent labels through 2024, including management guidance for another year of significant growth as apparel normalizes and general retail adoption broadens. Partnerships in grocery and fresh food continue to emerge, with reports of large U.S. retailers piloting RFID for perishables to improve on-shelf availability and labor efficiency.
Zebra Technologies Corporation: Zebra is a challenger in RFID infrastructure with a full stack of fixed readers, handhelds, and sleds integrated into broader automation and machine vision solutions. The portfolio spans FX9600 and FX7500 fixed readers and RFD40 and RFD90 sleds, creating cross-coverage from dock doors to store floors for inventory and asset tracking. Zebra has expanded its industrial automation capabilities through acquisitions including Matrox Imaging, Adaptive Vision, and Fetch Robotics, and announced plans in December 2024 to acquire Photoneo for advanced 3D vision. These moves align asset visibility with machine vision and robotics, enabling combined use cases such as automated exception handling and quality inspection adjacent to RFID-enabled flows. Zebra’s press communications emphasize continued development of fixed scanning and machine vision, positioning its RFID offerings within a larger connected frontline worker and intelligent automation strategy.
HID Global Corporation: HID Global is an innovator with strong vertical presence in healthcare, industrial, and textile management through durable tag portfolios and specialized solutions. The company acquired Vizinex RFID to strengthen high-performance passive tags in North America and expand custom tag capability for environments with metal, liquids, and temperature extremes. HID’s LinTRAK textile tags function within harsh industrial laundry cycles and comply with RAIN UHF standards, enabling reliable linen and garment tracking across hospitals and hospitality. Recent LinTRAK variants focus on compact form factors, MR-conditional options, and heat-sealable tags to streamline source tagging and withstand sterilization, enhancing compliance and auditability in clinical settings. Marketing and solution pages indicate integration with HID’s ACUITY linen management platform, which supports real-time visibility and lifecycle analytics for high-volume textiles.
Market Key Players:
CoreRFID Ltd.
Impinj, Inc.
Zebra Technologies Corporation
HID Global Corporation
SATO Holdings Corporation
NXP Semiconductors N.V.
Applied Wireless, Inc.
RF Code, Inc.
Alien Technology, LLC
Avery Dennison Corporation
Other Key Players
Driver:
Retail Inventory Accuracy and Shrink Reduction Fuel RFID Adoption
Retail and healthcare sectors are driving sustained RFID demand in 2025, with retail accounting for over 25% of total market share. Major retailers report inventory accuracy improvements of 25.4% and shrink reduction of up to 60% after full deployment. Companies like Inditex face annual losses near EUR 100 million from untracked inventory, creating compelling ROI cases for item-level tagging across apparel and general merchandise.
Healthcare Safety and Traceability Accelerate RFID Rollouts
Healthcare providers are scaling RFID for medication tracking, surgical kit management, and real-time location systems. Hospital deployments reduce medication errors by up to 40% and cut equipment search time by 75%. You can expect continued growth as regulatory pressure mounts for patient safety and pharmaceutical serialization. Both sectors benefit from declining tag costs, with passive inlays now commonly priced below USD 0.10, making large-scale rollouts financially viable.
Restraint:
Data Privacy Regulations Complicate Multinational RFID Deployments
Data privacy regulations and compliance complexity remain significant barriers in 2025. GDPR penalties can reach 4% of global turnover for privacy violations, while varying frequency regulations across regions complicate multinational deployments. Companies must navigate different data protection standards in the EU, California's CCPA, and emerging frameworks in Asia Pacific.
Technical and Integration Challenges Extend ROI Timelines
RF performance issues persist near metal surfaces and in liquid-rich environments, limiting deployment options in manufacturing and cold chain applications. Integration costs with legacy systems often exceed USD 50,000 for mid-size operations, creating budget constraints for SMEs. You face extended ROI timelines when factoring in staff training, system integration, and ongoing maintenance requirements.
Opportunity:
IoT and AI Integration Unlock New Value from RFID Data
IoT integration creates a USD 21.3 billion incremental market opportunity through 2033 as RFID shifts from simple identification to real-time event management. Cloud-based analytics platforms now process billions of tag reads daily, enabling predictive maintenance, dynamic routing, and automated replenishment. Manufacturing and logistics operators report 20 to 30% efficiency gains when combining RFID with IoT sensors and AI algorithms.
Smart Cities and Industry 4.0 Drive High-Growth Applications
Smart city initiatives and Industry 4.0 deployments represent high-growth segments. You can target applications in autonomous vehicles, smart parking, and connected infrastructure where RFID provides the foundational identification layer. Asia Pacific leads this expansion with government-backed digitization programs in China and India, creating substantial procurement opportunities for system integrators and tag suppliers.
Trend:
Sustainability Mandates Reshape RFID Materials and Design
Sustainability requirements are reshaping RFID technology in 2025. Brands mandate recyclable substrates and reduced packaging waste, driving adoption of paper-based antennas and biodegradable encapsulation. Circular economy initiatives push returnable transport item tracking, with logistics providers tagging pallets, containers, and reusable packaging at scale.
Edge Intelligence Transforms RFID into Real-Time Decision Systems
Edge computing integration transforms RFID from reactive tracking to proactive decision-making. Advanced readers now embed machine learning algorithms for real-time anomaly detection and automated alerts. You see this trend accelerating in pharmaceutical cold chain, where temperature excursions trigger immediate responses. Battery-assisted passive tags with integrated sensors are growing at double-digit rates, combining identification with condition monitoring in a single device.
Recent Developments
Dec 2024 – Zebra Technologies: Announced an agreement to acquire Photoneo to expand 3D machine vision capabilities for robotics and advanced automation; terms were not disclosed. The deal adds AI-enabled bin picking and guidance to Zebra’s stack, adjacent to RFID-enabled material flow. Strategic impact: Strengthens Zebra’s end-to-end asset visibility by uniting RFID with machine vision in high-throughput environments.
Jan 2025 – Zebra Technologies: Integrated prior vision acquisitions into a unified machine vision product line, improving cross-compatibility across software and hardware. The update enables automated inspection alongside RFID-driven conveyor and portal reads in plants. Strategic impact: Deepens cross-sell into RFID accounts and raises switching costs in industrial automation.
Feb 2025 – RAIN Alliance: Reported 52.8 billion UHF RAIN tag chips shipped in 2024, reflecting strong year-over-year growth and sustained item-level scaling. The Alliance cited retail, logistics, and postal deployments as primary demand drivers. Strategic impact: Validates capacity expansion across tag ICs, inlays, and readers and sets a higher volume baseline for 2025.
Jun 2025 – Avery Dennison: Unveiled an RFID label recognized by the Association of Plastic Recyclers as compatible with PET recycling streams for packaging applications. The solution targets FMCG and beverage brands facing tightening recyclability requirements. Strategic impact: Differentiates the Intelligent Labels portfolio with validated sustainability credentials for large consumer programs.
Sep 2025 – 42Gears: Announced expanded SureMDM support for Zebra RFID readers to centralize provisioning and monitoring across large device fleets. The capability aims to reduce deployment time and improve.