Global Ride-Sharing Apps Market Size, Share, Analysis Report By Type (Car Rental, E-hailing, Station-based Mobility, Car Sharing), Vehicle Type (CNG/LPG Vehicle, Electric Vehicle, Micro-mobility Vehicle, ICE Vehicle), Business Model (B2C, P2P, B2B), Region and Key Players - Industry Segment Overview, Market Dynamics, Competitive Strategies, Trends and Forecast 2025-2034
The Ride-Sharing Apps Market size is projected to reach approximately USD 146.83 Billion by 2034, up from USD 43.52 Billion in 2024, growing at a CAGR of 12.9% during the forecast period from 2025 to 2034. The market’s growth is driven by the rising demand for cost-efficient, convenient, and eco-friendly urban transportation solutions, coupled with the integration of AI, IoT, and real-time data analytics in mobility services. Increasing smartphone penetration, the rise of electric and autonomous ride-sharing fleets, and government support for sustainable urban mobility are further fueling industry expansion. As consumer preferences shift toward shared mobility ecosystems, ride-sharing apps are set to revolutionize the future of transportation — merging digital connectivity, sustainability, and smart city innovation into one seamless experience.
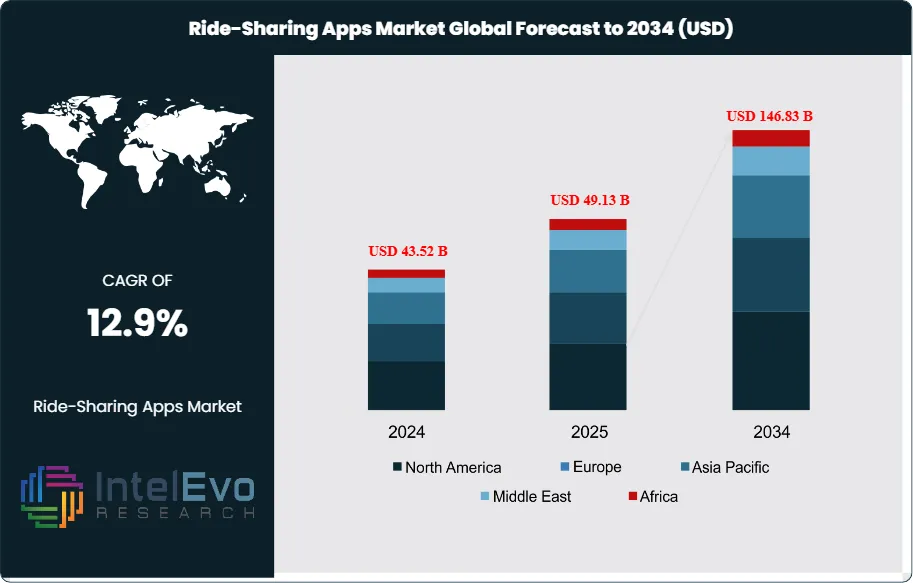
The ride-sharing apps market represents a transformative segment of the global transportation industry, leveraging digital platforms to connect passengers with drivers through mobile applications. This market encompasses various service models including e-hailing services, car rental platforms, station-based mobility solutions, and car-sharing networks. The market's growth is primarily driven by increasing urbanization, smartphone penetration, changing consumer preferences toward on-demand mobility solutions, and the growing emphasis on sustainable transportation alternatives. Key factors influencing market dynamics include regulatory frameworks, fuel price fluctuations, traffic congestion in urban areas, and the integration of advanced technologies such as artificial intelligence and GPS tracking systems.
The market landscape is characterized by intense competition among established players and emerging startups, each striving to capture market share through innovative service offerings, competitive pricing strategies, and expansion into new geographical territories. Technological advancements, including the development of autonomous vehicles, electric vehicle integration, and enhanced safety features, continue to reshape the industry. Additionally, the market faces challenges related to driver classification issues, regulatory compliance across different jurisdictions, and the need for sustainable business models that balance profitability with affordable pricing for consumers.
The Asia-Pacific region dominates the global ride-sharing apps market, accounting for the largest market share due to high population density, rapid urbanization, and significant smartphone adoption rates in countries like China, India, and Southeast Asian nations. North America and Europe follow as major markets, driven by established technological infrastructure and high disposable income levels, while emerging markets in Latin America, Africa, and the Middle East present substantial growth opportunities due to increasing internet penetration and urban mobility challenges.
The COVID-19 pandemic significantly impacted the ride-sharing industry, causing a dramatic decline in demand during lockdown periods as travel restrictions and safety concerns reduced mobility. However, the market demonstrated resilience by adapting to new consumer needs through enhanced safety protocols, contactless payment systems, and diversification into delivery services. The pandemic accelerated the adoption of hygiene measures, driver health screening, and vehicle sanitization practices, while also highlighting the importance of flexible mobility solutions as public transportation usage declined.
Key Takeaways:
Market Growth: The Ride-Sharing Apps Market is expected to reach USD 146.83 Billion by 2034, driven by increasing urbanization, technological advancement, and changing consumer mobility preferences toward shared and on-demand transportation solutions.
Type Dominance: E-hailing remains the largest and fastest-growing segment due to its unmatched convenience and scalability. The segment benefits from strong brand recognition and extensive driver networks.
Vehicle Type Dominance: Despite the sustainability push, internal combustion engine (ICE) vehicles continue to dominate fleets in many regions, offering a readily available and cost-effective mobility solution.
Business Model Dominance: Business-to-Consumer (B2C) models lead the market as established platforms directly engage end-users with intuitive apps, promotions, and loyalty programs.
Driver: The surge in smartphone adoption and internet penetration significantly boosts ride-sharing app usage. Consumers increasingly expect on-demand, cashless mobility services as part of modern urban lifestyles.
Restraint: Stringent regulations and compliance requirements impose operational burdens and increase costs for ride-sharing providers, especially when expanding into new regions.
Opportunity: Electrification of ride-sharing fleets represents a major growth opportunity, with governments incentivizing green vehicles and consumers demanding sustainable transport.
Trend: Integration of micro-mobility options, such as e-scooters and bikes, into ride-sharing apps is gaining traction, appealing to last-mile connectivity needs.
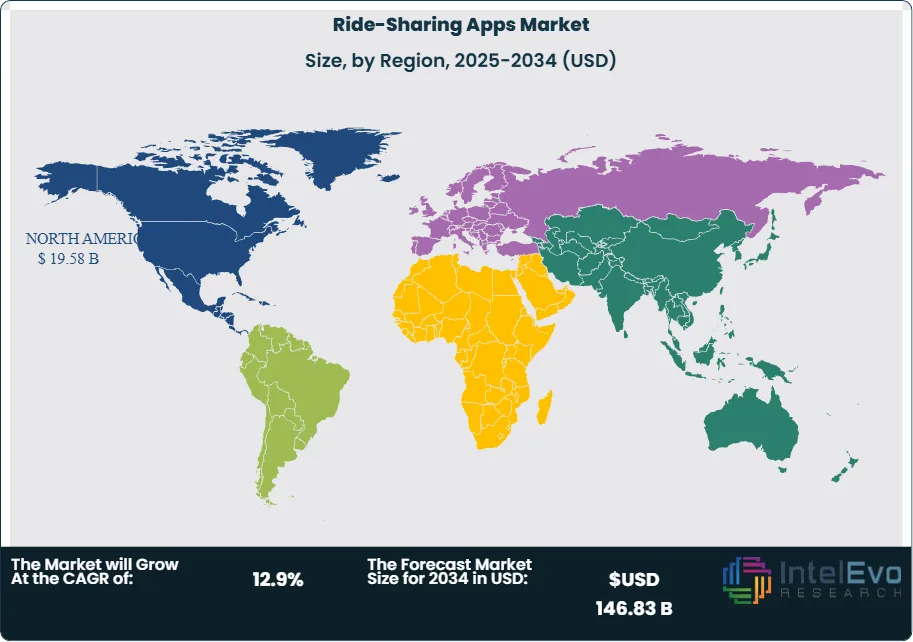
Regional Analysis: Asia-Pacific leads the global market, driven by large urban populations and rapid technology adoption. North America and Europe follow, with high disposable incomes and favorable infrastructure supporting adoption.
Type Analysis:
E-hailing has cemented itself as the preferred ride-sharing mode worldwide. This segment allows users to book rides in real time, track drivers, and make digital payments—all within a single app. Companies like Uber, Didi Chuxing, and Grab dominate this space due to their robust platforms, competitive pricing, and massive driver networks. E-hailing is highly scalable, adapting to fluctuating demand across peak and off-peak hours. Innovations such as dynamic pricing, ride-pooling, and AI-powered routing have improved efficiency and customer satisfaction. Consequently, E-hailing is forecast to maintain its lead as more consumers shift away from private vehicle ownership.
Vehicle Type Analysis:
ICE Vehicle Leads With nearly 55% Market Share In Ride-Sharing Apps Market, Although alternative powertrains are on the rise, ICE vehicles still represent the bulk of ride-sharing fleets globally. They offer cost advantages, widespread availability, and established refueling infrastructure. Many emerging economies lack sufficient charging stations to support mass electrification, making ICE vehicles the practical choice for drivers. However, regulatory pressures and fuel price volatility pose long-term risks to this segment. As a result, companies are gradually piloting hybrid and electric models while maintaining a core ICE fleet to meet immediate demand.
Business Model Analysis:
The Business-to-Consumer model dominates because it delivers a seamless, user-friendly experience through direct engagement. B2C ride-sharing apps attract customers with intuitive interfaces, transparent fare estimates, and personalized offers. This approach also fosters brand loyalty and repeat usage through subscription plans and referral programs. Major players invest heavily in marketing and partnerships to expand their user bases. The B2C segment’s continued growth hinges on platform innovation and consistent service quality, ensuring customer retention in an increasingly competitive market.
Region Analysis:
North America Leads With more than 45% Market Share In Ride-Sharing Apps Market, Asia-Pacific dominates the global ride-sharing market, accounting for approximately 45-50% of global market share, driven by massive population centers, rapid smartphone adoption, and supportive regulatory environments in key markets like China, India, and Southeast Asia. The region benefits from high population density in urban areas, making ride-sharing economically viable and attractive to both drivers and passengers. Government initiatives promoting shared mobility and smart city development further accelerate market growth.
North America represents the second-largest market, characterized by high per-capita income, advanced technological infrastructure, and early adoption of ride-sharing services. European markets emphasize regulatory compliance and environmental sustainability, driving adoption of electric and hybrid vehicles within ride-sharing fleets. Latin America, Africa, and the Middle East present emerging opportunities with growing smartphone penetration, urbanization trends, and increasing demand for affordable transportation alternatives.
By Service Type (Carpooling, E-Hailing, Car Rental, Station-Based Mobility, Peer-to-Peer (P2P) Sharing), By Vehicle Type (Cars, Two-Wheelers (Motorbikes & Scooters), Electric Vehicles (EVs), Autonomous Vehicles (AVs), Others (Shuttles, Vans)), By Business Model (B2C (Business-to-Consumer), P2P (Peer-to-Peer), B2B (Corporate Ride-Sharing), Subscription-Based Ride-Sharing Models), By Payment Mode (In-App Payments, Digital Wallets, Credit/Debit Cards, Cash Payments), By End User (Individual Commuters, Corporate Users, Tourists and Travelers, Government & Institutional Transport)
Research Methodology
Primary Research- 100 Interviews of Stakeholders
Secondary Research
Desk Research
Regional scope
North America (United States, Canada, Mexico)
Latin America (Brazil, Argentina, Columbia)
East Asia And Pacific (China, Japan, South Korea, Australia, Cambodia, Fiji, Indonesia)
Sea And South Asia (India, Singapore, Thailand, Taiwan, Malaysia)
Eastern Europe (Poland, Russia, Czech Republic, Romania)
Western Europe (Germany, U.K., France, Spain, Itlay)
Middle East & Africa (GCC Countries, Egypt, Nigeria, South Africa, Israel)
Customization for segments, region/country-level will be provided. Moreover, additional customization can be done based on the requirements.
Pricing and Purchase Options
Avail customized purchase options to meet your exact research needs. We have three licenses to opt for: Single User License, Multi-User License (Up to 5 Users), Corporate Use License (Unlimited User and Printable PDF).
TABLE OF CONTENTS
1. EXECUTIVE SUMMARY
1.1. MARKET SNAPSHOT
1.2. KEY FINDINGS & INSIGHTS
1.3. ANALYST RECOMMENDATIONS
1.4. FUTURE OUTLOOK
2. RESEARCH METHODOLOGY
2.1. MARKET DEFINITION & SCOPE
2.2. RESEARCH OBJECTIVES: PRIMARY & SECONDARY DATA SOURCES
2.3. DATA COLLECTION SOURCES
2.3.1. COVERAGE OF 100+ PRIMARY RESEARCH/CONSULTATION CALLS WITH INDUSTRY STAKEHOLDERS
FIGURE 17 NORTH AMERICA RIDE-SHARING APPS CURRENT AND FUTURE TYPE ANALYSIS, 2025–2034, (USD MILLION)
FIGURE 18 NORTH AMERICA RIDE-SHARING APPS CURRENT AND FUTURE END USER ANALYSIS, 2025–2034, (USD MILLION)
FIGURE 19 MARKET SHARE BY COUNTRY
FIGURE 20 LATIN AMERICA RIDE-SHARING APPS CURRENT AND FUTURE TYPE ANALYSIS, 2025–2034, (USD MILLION)
FIGURE 21 LATIN AMERICA RIDE-SHARING APPS CURRENT AND FUTURE END USER ANALYSIS, 2025–2034, (USD MILLION)
FIGURE 22 MARKET SHARE BY COUNTRY
FIGURE 23 EASTERN EUROPE RIDE-SHARING APPS CURRENT AND FUTURE TYPE ANALYSIS, 2025–2034, (USD MILLION)
FIGURE 24 EASTERN EUROPE RIDE-SHARING APPS CURRENT AND FUTURE END USER ANALYSIS, 2025–2034, (USD MILLION)
FIGURE 25 MARKET SHARE BY COUNTRY
FIGURE 26 WESTERN EUROPE RIDE-SHARING APPS CURRENT AND FUTURE TYPE ANALYSIS, 2025–2034, (USD MILLION)
FIGURE 27 WESTERN EUROPE RIDE-SHARING APPS CURRENT AND FUTURE END USER ANALYSIS, 2025–2034, (USD MILLION)
FIGURE 28 MARKET SHARE BY COUNTRY
FIGURE 29 EAST ASIA AND PACIFIC RIDE-SHARING APPS CURRENT AND FUTURE TYPE ANALYSIS, 2025–2034, (USD MILLION)
FIGURE 30 EAST ASIA AND PACIFIC RIDE-SHARING APPS CURRENT AND FUTURE END USER ANALYSIS, 2025–2034, (USD MILLION)
FIGURE 31 MARKET SHARE BY COUNTRY
FIGURE 32 SEA AND SOUTH ASIA RIDE-SHARING APPS CURRENT AND FUTURE TYPE ANALYSIS, 2025–2034, (USD MILLION)
FIGURE 33 SEA AND SOUTH ASIA RIDE-SHARING APPS CURRENT AND FUTURE END USER ANALYSIS, 2025–2034, (USD MILLION)
FIGURE 34 MARKET SHARE BY COUNTRY
FIGURE 35 MIDDLE EAST AND AFRICA RIDE-SHARING APPS CURRENT AND FUTURE TYPE ANALYSIS, 2025–2034, (USD MILLION)
FIGURE 36 MIDDLE EAST AND AFRICA RIDE-SHARING APPS CURRENT AND FUTURE END USER ANALYSIS, 2025–2034, (USD MILLION)
FIGURE 37 NORTH AMERICA RIDE-SHARING APPS CURRENT AND FUTURE MARKET VOLUME SHARE REGIONAL ANALYSIS, 2025–2034, (USD MILLION)
FIGURE 38 U.S. RIDE-SHARING APPS CURRENT AND FUTURE TYPE ANALYSIS, 2025–2034, (USD MILLION)
FIGURE 39 U.S. RIDE-SHARING APPS CURRENT AND FUTURE END USER ANALYSIS, 2025–2034, (USD MILLION)
FIGURE 40 CANADA RIDE-SHARING APPS CURRENT AND FUTURE TYPE ANALYSIS, 2025–2034, (USD MILLION)
FIGURE 41 CANADA RIDE-SHARING APPS CURRENT AND FUTURE END USER ANALYSIS, 2025–2034, (USD MILLION)
FIGURE 42 LATIN AMERICA RIDE-SHARING APPS CURRENT AND FUTURE MARKET VOLUME SHARE REGIONAL ANALYSIS, 2025–2034, (USD MILLION)
FIGURE 43 MEXICO RIDE-SHARING APPS CURRENT AND FUTURE TYPE ANALYSIS, 2025–2034, (USD MILLION)
FIGURE 44 MEXICO RIDE-SHARING APPS CURRENT AND FUTURE END USER ANALYSIS, 2025–2034, (USD MILLION)
FIGURE 45 BRAZIL RIDE-SHARING APPS CURRENT AND FUTURE TYPE ANALYSIS, 2025–2034, (USD MILLION)
FIGURE 46 BRAZIL RIDE-SHARING APPS CURRENT AND FUTURE END USER ANALYSIS, 2025–2034, (USD MILLION)
FIGURE 47 ARGENTINA RIDE-SHARING APPS CURRENT AND FUTURE TYPE ANALYSIS, 2025–2034, (USD MILLION)
FIGURE 48 ARGENTINA RIDE-SHARING APPS CURRENT AND FUTURE END USER ANALYSIS, 2025–2034, (USD MILLION)
FIGURE 49 COLUMBIA RIDE-SHARING APPS CURRENT AND FUTURE TYPE ANALYSIS, 2025–2034, (USD MILLION)
FIGURE 50 COLUMBIA RIDE-SHARING APPS CURRENT AND FUTURE END USER ANALYSIS, 2025–2034, (USD MILLION)
FIGURE 51 REST OF LATIN AMERICA RIDE-SHARING APPS CURRENT AND FUTURE TYPE ANALYSIS, 2025–2034, (USD MILLION)
FIGURE 52 REST OF LATIN AMERICA RIDE-SHARING APPS CURRENT AND FUTURE END USER ANALYSIS, 2025–2034, (USD MILLION)
FIGURE 53 EASTERN EUROPE RIDE-SHARING APPS CURRENT AND FUTURE MARKET VOLUME SHARE REGIONAL ANALYSIS, 2025–2034, (USD MILLION)
FIGURE 54 POLAND RIDE-SHARING APPS CURRENT AND FUTURE TYPE ANALYSIS, 2025–2034, (USD MILLION)
FIGURE 55 POLAND RIDE-SHARING APPS CURRENT AND FUTURE END USER ANALYSIS, 2025–2034, (USD MILLION)
FIGURE 56 RUSSIA RIDE-SHARING APPS CURRENT AND FUTURE TYPE ANALYSIS, 2025–2034, (USD MILLION)
FIGURE 57 RUSSIA RIDE-SHARING APPS CURRENT AND FUTURE END USER ANALYSIS, 2025–2034, (USD MILLION)
FIGURE 58 CZECH REPUBLIC RIDE-SHARING APPS CURRENT AND FUTURE TYPE ANALYSIS, 2025–2034, (USD MILLION)
FIGURE 59 CZECH REPUBLIC RIDE-SHARING APPS CURRENT AND FUTURE END USER ANALYSIS, 2025–2034, (USD MILLION)
FIGURE 60 ROMANIA RIDE-SHARING APPS CURRENT AND FUTURE TYPE ANALYSIS, 2025–2034, (USD MILLION)
FIGURE 61 ROMANIA RIDE-SHARING APPS CURRENT AND FUTURE END USER ANALYSIS, 2025–2034, (USD MILLION)
FIGURE 62 REST OF EASTERN EUROPE RIDE-SHARING APPS CURRENT AND FUTURE TYPE ANALYSIS, 2025–2034, (USD MILLION)
FIGURE 63 REST OF EASTERN EUROPE RIDE-SHARING APPS CURRENT AND FUTURE END USER ANALYSIS, 2025–2034, (USD MILLION)
FIGURE 64 WESTERN EUROPE RIDE-SHARING APPS CURRENT AND FUTURE MARKET VOLUME SHARE REGIONAL ANALYSIS, 2025–2034, (USD MILLION)
FIGURE 65 GERMANY RIDE-SHARING APPS CURRENT AND FUTURE TYPE ANALYSIS, 2025–2034, (USD MILLION)
FIGURE 66 GERMANY RIDE-SHARING APPS CURRENT AND FUTURE END USER ANALYSIS, 2025–2034, (USD MILLION)
FIGURE 67 FRANCE RIDE-SHARING APPS CURRENT AND FUTURE TYPE ANALYSIS, 2025–2034, (USD MILLION)
FIGURE 68 FRANCE RIDE-SHARING APPS CURRENT AND FUTURE END USER ANALYSIS, 2025–2034, (USD MILLION)
FIGURE 69 UK RIDE-SHARING APPS CURRENT AND FUTURE TYPE ANALYSIS, 2025–2034, (USD MILLION)
FIGURE 70 UK RIDE-SHARING APPS CURRENT AND FUTURE END USER ANALYSIS, 2025–2034, (USD MILLION)
FIGURE 71 SPAIN RIDE-SHARING APPS CURRENT AND FUTURE TYPE ANALYSIS, 2025–2034, (USD MILLION)
FIGURE 72 SPAIN RIDE-SHARING APPS CURRENT AND FUTURE END USER ANALYSIS, 2025–2034, (USD MILLION)
FIGURE 73 ITALY RIDE-SHARING APPS CURRENT AND FUTURE TYPE ANALYSIS, 2025–2034, (USD MILLION)
FIGURE 74 ITALY RIDE-SHARING APPS CURRENT AND FUTURE END USER ANALYSIS, 2025–2034, (USD MILLION)
FIGURE 75 REST OF WESTERN EUROPE RIDE-SHARING APPS CURRENT AND FUTURE TYPE ANALYSIS, 2025–2034, (USD MILLION)
FIGURE 76 REST OF WESTERN EUROPE RIDE-SHARING APPS CURRENT AND FUTURE END USER ANALYSIS, 2025–2034, (USD MILLION)
FIGURE 77 EAST ASIA AND PACIFIC RIDE-SHARING APPS CURRENT AND FUTURE MARKET VOLUME SHARE REGIONAL ANALYSIS, 2025–2034, (USD MILLION)
FIGURE 78 CHINA RIDE-SHARING APPS CURRENT AND FUTURE TYPE ANALYSIS, 2025–2034, (USD MILLION)
FIGURE 79 CHINA RIDE-SHARING APPS CURRENT AND FUTURE END USER ANALYSIS, 2025–2034, (USD MILLION)
FIGURE 80 JAPAN RIDE-SHARING APPS CURRENT AND FUTURE TYPE ANALYSIS, 2025–2034, (USD MILLION)
FIGURE 81 JAPAN RIDE-SHARING APPS CURRENT AND FUTURE END USER ANALYSIS, 2025–2034, (USD MILLION)
FIGURE 82 AUSTRALIA RIDE-SHARING APPS CURRENT AND FUTURE TYPE ANALYSIS, 2025–2034, (USD MILLION)
FIGURE 83 AUSTRALIA RIDE-SHARING APPS CURRENT AND FUTURE END USER ANALYSIS, 2025–2034, (USD MILLION)
FIGURE 84 CAMBODIA RIDE-SHARING APPS CURRENT AND FUTURE TYPE ANALYSIS, 2025–2034, (USD MILLION)
FIGURE 85 CAMBODIA RIDE-SHARING APPS CURRENT AND FUTURE END USER ANALYSIS, 2025–2034, (USD MILLION)
FIGURE 86 FIJI RIDE-SHARING APPS CURRENT AND FUTURE TYPE ANALYSIS, 2025–2034, (USD MILLION)
FIGURE 87 FIJI RIDE-SHARING APPS CURRENT AND FUTURE END USER ANALYSIS, 2025–2034, (USD MILLION)
FIGURE 88 INDONESIA RIDE-SHARING APPS CURRENT AND FUTURE TYPE ANALYSIS, 2025–2034, (USD MILLION)
FIGURE 89 INDONESIA RIDE-SHARING APPS CURRENT AND FUTURE END USER ANALYSIS, 2025–2034, (USD MILLION)
FIGURE 90 SOUTH KOREA RIDE-SHARING APPS CURRENT AND FUTURE TYPE ANALYSIS, 2025–2034, (USD MILLION)
FIGURE 91 SOUTH KOREA RIDE-SHARING APPS CURRENT AND FUTURE END USER ANALYSIS, 2025–2034, (USD MILLION)
FIGURE 92 REST OF EAST ASIA AND PACIFIC RIDE-SHARING APPS CURRENT AND FUTURE TYPE ANALYSIS, 2025–2034, (USD MILLION)
FIGURE 93 REST OF EAST ASIA AND PACIFIC RIDE-SHARING APPS CURRENT AND FUTURE END USER ANALYSIS, 2025–2034, (USD MILLION)
FIGURE 94 SEA AND SOUTH ASIA RIDE-SHARING APPS CURRENT AND FUTURE MARKET VOLUME SHARE REGIONAL ANALYSIS, 2025–2034, (USD MILLION)
FIGURE 95 BANGLADESH RIDE-SHARING APPS CURRENT AND FUTURE TYPE ANALYSIS, 2025–2034, (USD MILLION)
FIGURE 96 BANGLADESH RIDE-SHARING APPS CURRENT AND FUTURE END USER ANALYSIS, 2025–2034, (USD MILLION)
FIGURE 97 NEW ZEALAND RIDE-SHARING APPS CURRENT AND FUTURE TYPE ANALYSIS, 2025–2034, (USD MILLION)
FIGURE 98 NEW ZEALAND RIDE-SHARING APPS CURRENT AND FUTURE END USER ANALYSIS, 2025–2034, (USD MILLION)
FIGURE 99 INDIA RIDE-SHARING APPS CURRENT AND FUTURE TYPE ANALYSIS, 2025–2034, (USD MILLION)
FIGURE 100 INDIA RIDE-SHARING APPS CURRENT AND FUTURE END USER ANALYSIS, 2025–2034, (USD MILLION)
FIGURE 101 SINGAPORE RIDE-SHARING APPS CURRENT AND FUTURE TYPE ANALYSIS, 2025–2034, (USD MILLION)
FIGURE 102 SINGAPORE RIDE-SHARING APPS CURRENT AND FUTURE END USER ANALYSIS, 2025–2034, (USD MILLION)
FIGURE 103 THAILAND RIDE-SHARING APPS CURRENT AND FUTURE TYPE ANALYSIS, 2025–2034, (USD MILLION)
FIGURE 104 THAILAND RIDE-SHARING APPS CURRENT AND FUTURE END USER ANALYSIS, 2025–2034, (USD MILLION)
FIGURE 105 TAIWAN RIDE-SHARING APPS CURRENT AND FUTURE TYPE ANALYSIS, 2025–2034, (USD MILLION)
FIGURE 106 TAIWAN RIDE-SHARING APPS CURRENT AND FUTURE END USER ANALYSIS, 2025–2034, (USD MILLION)
FIGURE 107 MALAYSIA RIDE-SHARING APPS CURRENT AND FUTURE TYPE ANALYSIS, 2025–2034, (USD MILLION)
FIGURE 108 MALAYSIA RIDE-SHARING APPS CURRENT AND FUTURE END USER ANALYSIS, 2025–2034, (USD MILLION)
FIGURE 109 REST OF SEA AND SOUTH ASIA RIDE-SHARING APPS CURRENT AND FUTURE TYPE ANALYSIS, 2025–2034, (USD MILLION)
FIGURE 110 REST OF SEA AND SOUTH ASIA RIDE-SHARING APPS CURRENT AND FUTURE END USER ANALYSIS, 2025–2034, (USD MILLION)
FIGURE 111 MIDDLE EAST AND AFRICA RIDE-SHARING APPS CURRENT AND FUTURE MARKET VOLUME SHARE REGIONAL ANALYSIS, 2025–2034, (USD MILLION)
FIGURE 112 GCC COUNTRIES RIDE-SHARING APPS CURRENT AND FUTURE TYPE ANALYSIS, 2025–2034, (USD MILLION)
FIGURE 113 GCC COUNTRIES RIDE-SHARING APPS CURRENT AND FUTURE END USER ANALYSIS, 2025–2034, (USD MILLION)
FIGURE 114 SAUDI ARABIA RIDE-SHARING APPS CURRENT AND FUTURE TYPE ANALYSIS, 2025–2034, (USD MILLION)
FIGURE 115 SAUDI ARABIA RIDE-SHARING APPS CURRENT AND FUTURE END USER ANALYSIS, 2025–2034, (USD MILLION)
FIGURE 116 UAE RIDE-SHARING APPS CURRENT AND FUTURE TYPE ANALYSIS, 2025–2034, (USD MILLION)
FIGURE 117 UAE RIDE-SHARING APPS CURRENT AND FUTURE END USER ANALYSIS, 2025–2034, (USD MILLION)
FIGURE 118 BAHRAIN RIDE-SHARING APPS CURRENT AND FUTURE TYPE ANALYSIS, 2025–2034, (USD MILLION)
FIGURE 119 BAHRAIN RIDE-SHARING APPS CURRENT AND FUTURE END USER ANALYSIS, 2025–2034, (USD MILLION)
FIGURE 120 KUWAIT RIDE-SHARING APPS CURRENT AND FUTURE TYPE ANALYSIS, 2025–2034, (USD MILLION)
FIGURE 121 KUWAIT RIDE-SHARING APPS CURRENT AND FUTURE END USER ANALYSIS, 2025–2034, (USD MILLION)
FIGURE 122 OMAN RIDE-SHARING APPS CURRENT AND FUTURE TYPE ANALYSIS, 2025–2034, (USD MILLION)
FIGURE 123 OMAN RIDE-SHARING APPS CURRENT AND FUTURE END USER ANALYSIS, 2025–2034, (USD MILLION)
FIGURE 124 QATAR RIDE-SHARING APPS CURRENT AND FUTURE TYPE ANALYSIS, 2025–2034, (USD MILLION)
FIGURE 125 QATAR RIDE-SHARING APPS CURRENT AND FUTURE END USER ANALYSIS, 2025–2034, (USD MILLION)
FIGURE 126 EGYPT RIDE-SHARING APPS CURRENT AND FUTURE TYPE ANALYSIS, 2025–2034, (USD MILLION)
FIGURE 127 EGYPT RIDE-SHARING APPS CURRENT AND FUTURE END USER ANALYSIS, 2025–2034, (USD MILLION)
FIGURE 128 NIGERIA RIDE-SHARING APPS CURRENT AND FUTURE TYPE ANALYSIS, 2025–2034, (USD MILLION)
FIGURE 129 NIGERIA RIDE-SHARING APPS CURRENT AND FUTURE END USER ANALYSIS, 2025–2034, (USD MILLION)
FIGURE 130 SOUTH AFRICA RIDE-SHARING APPS CURRENT AND FUTURE TYPE ANALYSIS, 2025–2034, (USD MILLION)
FIGURE 131 SOUTH AFRICA RIDE-SHARING APPS CURRENT AND FUTURE END USER ANALYSIS, 2025–2034, (USD MILLION)
FIGURE 132 ISRAEL RIDE-SHARING APPS CURRENT AND FUTURE TYPE ANALYSIS, 2025–2034, (USD MILLION)
FIGURE 133 ISRAEL RIDE-SHARING APPS CURRENT AND FUTURE END USER ANALYSIS, 2025–2034, (USD MILLION)
FIGURE 134 REST OF MEA RIDE-SHARING APPS CURRENT AND FUTURE TYPE ANALYSIS, 2025–2034, (USD MILLION)
FIGURE 135 REST OF MEA RIDE-SHARING APPS CURRENT AND FUTURE END USER ANALYSIS, 2025–2034, (USD MILLION)
FIGURE 136 U. S. MARKET SHARE ANALYSIS BY TYPE (2024)
FIGURE 137 U. S. MARKET SHARE ANALYSIS BY END USER (2024)
FIGURE 138 CANADA MARKET SHARE ANALYSIS BY TYPE (2024)
FIGURE 139 CANADA MARKET SHARE ANALYSIS BY END USER (2024)
FIGURE 140 MEXICO MARKET SHARE ANALYSIS BY TYPE (2024)
FIGURE 141 MEXICO MARKET SHARE ANALYSIS BY END USER (2024)
FIGURE 142 CHINA MARKET SHARE ANALYSIS BY TYPE (2024)
FIGURE 143 CHINA MARKET SHARE ANALYSIS BY END USER (2024)
FIGURE 144 JAPAN MARKET SHARE ANALYSIS BY TYPE (2024)
FIGURE 145 JAPAN MARKET SHARE ANALYSIS BY END USER (2024)
FIGURE 146 INDIA MARKET SHARE ANALYSIS BY TYPE (2024)
FIGURE 147 INDIA MARKET SHARE ANALYSIS BY END USER (2024)
FIGURE 148 SOUTH KOREA MARKET SHARE ANALYSIS BY TYPE (2024)
FIGURE 149 SOUTH KOREA MARKET SHARE ANALYSIS BY END USER (2024)
FIGURE 150 SAUDI ARABIA MARKET SHARE ANALYSIS BY TYPE (2024)
FIGURE 151 SAUDI ARABIA MARKET SHARE ANALYSIS BY END USER (2024)
FIGURE 152 UAE MARKET SHARE ANALYSIS BY TYPE (2024)
FIGURE 153 UAE MARKET SHARE ANALYSIS BY END USER (2024)
FIGURE 154 EGYPT MARKET SHARE ANALYSIS BY TYPE (2024)
FIGURE 155 EGYPT MARKET SHARE ANALYSIS BY END USER (2024)
FIGURE 156 NIGERIA MARKET SHARE ANALYSIS BY TYPE (2024)
FIGURE 157 NIGERIA MARKET SHARE ANALYSIS BY END USER (2024)
FIGURE 158 SOUTH AFRICA MARKET SHARE ANALYSIS BY TYPE (2024)
FIGURE 159 SOUTH AFRICA MARKET SHARE ANALYSIS BY END USER (2024)
FIGURE 160 GERMANY MARKET SHARE ANALYSIS BY TYPE (2024)
FIGURE 161 GERMANY MARKET SHARE ANALYSIS BY END USER (2024)
FIGURE 162 FRANCE MARKET SHARE ANALYSIS BY TYPE (2024)
FIGURE 163 FRANCE MARKET SHARE ANALYSIS BY END USER (2024)
FIGURE 164 UK MARKET SHARE ANALYSIS BY TYPE (2024)
FIGURE 165 UK MARKET SHARE ANALYSIS BY END USER (2024)
FIGURE 166 SPAIN MARKET SHARE ANALYSIS BY TYPE (2024)
FIGURE 167 SPAIN MARKET SHARE ANALYSIS BY END USER (2024)
FIGURE 168 ITALY MARKET SHARE ANALYSIS BY TYPE (2024)
FIGURE 169 ITALY MARKET SHARE ANALYSIS BY END USER (2024)
FIGURE 170 BRAZIL MARKET SHARE ANALYSIS BY TYPE (2024)
FIGURE 171 BRAZIL MARKET SHARE ANALYSIS BY END USER (2024)
FIGURE 172 ARGENTINA MARKET SHARE ANALYSIS BY TYPE (2024)
FIGURE 173 ARGENTINA MARKET SHARE ANALYSIS BY END USER (2024)
FIGURE 174 COLUMBIA MARKET SHARE ANALYSIS BY TYPE (2024)
FIGURE 175 COLUMBIA MARKET SHARE ANALYSIS BY END USER (2024)
FIGURE 176 GLOBAL RIDE-SHARING APPS CURRENT AND FUTURE MARKET KEY COUNTRY LEVEL ANALYSIS, 2024–2034, (USD MILLION)
FIGURE 177 FINANCIAL OVERVIEW:
Key Players Analysis:
Uber Technologies, Inc.: Uber stands as the global leader in ride-sharing services, maintaining dominant market positions across multiple continents through aggressive expansion strategies, technological innovation, and platform diversification. The company's success stems from its first-mover advantage in many markets, substantial financial resources for market development, and continuous investment in technology infrastructure. Uber's platform ecosystem extends beyond ride-sharing to include food delivery (Uber Eats), freight services (Uber Freight), and micro-mobility solutions, creating multiple revenue streams and enhanced user engagement. The company's global presence provides operational leverage, enabling knowledge transfer between markets and economies of scale in technology development. Uber's commitment to autonomous vehicle development and electric vehicle adoption positions the company for future market transitions and sustainable growth opportunities.
Didi Chuxing Technology Co., Ltd.: Didi Chuxing dominates the Chinese ride-sharing market, serving over 550 million users annually through its comprehensive mobility platform. The company's success in the world's largest ride-sharing market demonstrates its ability to navigate complex regulatory environments and achieve massive scale. Didi's technological capabilities include advanced AI algorithms for demand prediction, route optimization, and safety monitoring, supported by one of the world's largest transportation datasets. The company's expansion into international markets, particularly in Latin America and other emerging economies, leverages its operational expertise and technology platform. Didi's diverse service offerings, including taxi-hailing, private car services, bike-sharing, and delivery services, create a comprehensive mobility ecosystem that enhances user retention and platform value.
Grab Holdings Limited: Grab has established itself as Southeast Asia's leading super-app, combining ride-sharing services with food delivery, digital payments, and financial services to create an integrated digital ecosystem. The company's success in the complex Southeast Asian market demonstrates its ability to adapt to diverse regulatory environments, local preferences, and varying infrastructure conditions across multiple countries. Grab's strategic focus on financial inclusion through GrabPay and lending services creates additional revenue streams while increasing platform stickiness among users. The company's partnerships with local governments, businesses, and technology providers enable deep market penetration and sustainable competitive advantages. Grab's expansion into grocery delivery, healthcare services, and digital banking represents its evolution toward becoming a comprehensive digital services platform serving diverse consumer needs across the region.
Market Key Players
Gett
Uber Technologies, Inc.
BlaBlaCar
Lyft, Inc.
Revel
Via Transportation, Inc.
Zoox, Inc.
Grab
Didi Chuxing Technology Co., Ltd.
ANI Technologies
Driver:
Rising Smartphone Penetration and Digital Payments:
Rapid smartphone adoption has unlocked unprecedented access to ride-sharing services. Consumers can effortlessly book, pay for, and track rides through mobile apps, creating a frictionless experience. In developing economies, low-cost smartphones and expanding 4G/5G networks have further accelerated usage. Digital wallets and contactless payments enhance convenience and security, encouraging more commuters to transition from traditional taxis to app-based platforms.
Shift Toward On-Demand Mobility:
Urbanization and lifestyle changes are driving a preference for flexible, on-demand transport over car ownership. Millennials and Gen Z consumers, in particular, prioritize experiences and convenience over asset accumulation. This shift aligns perfectly with the ride-sharing model, which offers affordable, instant mobility without the burdens of maintenance and parking. As cities become denser, shared transport provides an effective solution to congestion and pollution.
Restrain:
Regulatory Hurdles and Compliance Costs:
Governments worldwide have introduced stringent regulations to manage ride-sharing, from driver background checks to insurance requirements and caps on fleet size. Compliance costs can be prohibitive for new entrants and expansion efforts. Operators often face legal battles over driver classification (employee vs contractor), leading to operational uncertainty and financial strain.
Safety and Liability Concerns:
Incidents involving passenger safety, data breaches, or driver misconduct can damage brand trust and attract litigation. Platforms must invest heavily in safety protocols, background screening, and insurance coverage. These efforts, while essential, add to operational complexity and costs. Reputational risks remain high in an industry heavily reliant on consumer trust.
Opportunities:
Electrification of Ride-Sharing Fleets:
Electrifying fleets presents an enormous growth opportunity, as governments incentivize EV adoption through subsidies and charging infrastructure investments. Electric vehicles can reduce operational costs over time due to lower fuel and maintenance expenses. Sustainability-conscious consumers increasingly prefer eco-friendly ride options, positioning electrification as a key competitive differentiator.
Integration of Micro-Mobility Solutions:
Adding e-scooters, e-bikes, and shared bicycles to ride-sharing apps addresses last-mile connectivity challenges. This expansion appeals to urban commuters seeking affordable, quick options for short distances. Companies integrating micro-mobility can tap into new revenue streams, cross-sell services, and reinforce platform stickiness among users.
Trends:
AI-Driven Personalization and Dynamic Pricing:
Advanced data analytics and machine learning allow platforms to personalize ride recommendations, predict demand, and optimize pricing in real time. This approach maximizes fleet utilization, enhances customer satisfaction, and improves profitability. Dynamic pricing models, such as surge fares, balance supply-demand imbalances while incentivizing driver availability during peak hours.
Autonomous Vehicle Integration:
Several ride-sharing companies are piloting autonomous vehicles to reduce labor costs and improve scalability. While widespread deployment remains in the future, early trials demonstrate potential for safer, more efficient transport. Companies like Zoox are investing heavily in AV technology, positioning themselves at the forefront of this transformative trend.
Recent Development:
In June 2025: Uber Technologies, in partnership with Alphabet’s Waymo, has officially launched autonomous ride-hailing services in Atlanta as of June 24, 2025. This expansion follows the successful debut of their driverless service in Austin, Texas, earlier in March. Atlanta now becomes the second city to host the collaboration, with Waymo’s fully autonomous, all-electric Jaguar I-PACE vehicles available to Uber users across a 65-square-mile area that includes neighborhoods such as Downtown, Buckhead, and Capitol View.
In May 2025: Pony AI Inc. (NASDAQ: PONY) and Uber Technologies (NYSE: UBER) have entered into a strategic partnership to integrate Pony.ai’s Robotaxis into Uber’s ride-hailing platform, marking a significant step forward in autonomous mobility. The collaboration will debut later this year in a major Middle Eastern market, with plans to expand the service to additional international locations in the future.