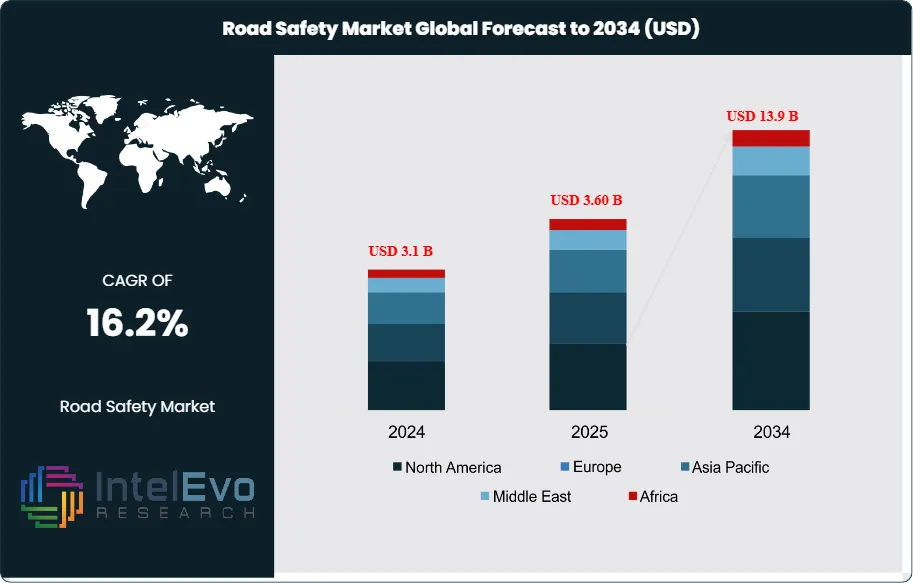
The Global Road Safety Market was valued at approximately USD 3.1 billion in 2024 and is projected to reach nearly USD 13.9 billion by 2034, driven by increasing government investments in smart transportation infrastructure, traffic monitoring systems, and advanced driver safety technologies. Based on the stated growth trajectory, the market size for 2025 is estimated at approximately USD 3.60 billion. From 2026 onward, the market is expected to expand at a compound annual growth rate (CAGR) of approximately 16.2% during 2026–2034, ultimately reaching around USD 13.9 billion by 2034. This growth reflects the mounting urgency to reduce road fatalities and manage rising traffic densities through a combination of regulation, advanced technology, and infrastructure modernization. Demand accelerates as governments, municipalities, and fleet operators prioritize safety outcomes, compliance, and operational efficiency over purely cost-based decision-making.
Rising vehicle ownership forms a structural demand driver. As of the second quarter of 2024, the United States had approximately 291.1 million vehicles in operation, while the global vehicle fleet is projected to approach 2 billion units by 2035. This expansion strains existing road networks and intensifies the need for intelligent enforcement, adaptive signaling, and real-time monitoring. At the same time, the social and economic cost of accidents remains high. In 2022, the U.S. recorded 42,795 traffic fatalities, corresponding to 1.35 deaths per 100 million vehicle miles traveled, which keeps safety firmly on the policy agenda.
On the supply side, vendors broaden portfolios from traditional signage and barriers to integrated solutions that combine sensors, cameras, connectivity, and analytics. Intelligent transportation systems capable of reducing crashes by up to 80% are gaining traction, supported by advances in artificial intelligence, automation, and digitalization. AI-driven video analytics, automated incident detection, and predictive maintenance reshape how agencies manage risk and allocate resources. Software and analytics are expected to account for roughly 35% of market revenues by 2034, while hardware remains the largest segment at close to 45%, with services such as consulting, training, and managed operations contributing the balance.
Regulation and public investment anchor the market. Stricter vehicle safety norms, mandatory speed and red-light enforcement, and national road safety strategies stimulate steady funding pipelines. Government and public-sector entities represent more than 70% of spending, complemented by growing participation from logistics firms, ride-hailing platforms, and insurance companies that seek data-driven risk reduction. North America currently contributes an estimated 32% of global revenues, followed by Europe at about 28%, while Asia Pacific is the fastest-growing region, supported by urbanization and large-scale infrastructure programs. Emerging hotspots in South and Southeast Asia, Latin America, and the Middle East offer increasing opportunities for public–private partnerships and scalable technology platforms focused on measurable safety outcomes.
Key Takeaways
Market Growth: The Road Safety Market records 3.1 billion USD, 2024 in revenues. It is projected to reach 13.9 billion USD, 2034, representing a CAGR of 16.2%, 2024-2034.
Segment Dominance: Red Light & Speed Enforcement Systems lead the solution type segment with a 58.3%, 2024 revenue share. This dominance underscores their central role in curbing traffic violations.
Segment Dominance: Professional Services command an 82.5%, 2024 share of the service type segment. This leadership position highlights the critical importance of expert implementation and integration support for road safety solutions.
Driver: Government and Municipalities act as the primary demand catalyst, holding a 47.6%, 2024 end-user share. This concentration signals sustained public-sector investment in comprehensive road safety programs.
Restraint: Budget pressures and slow procurement cycles continue to limit large-scale rollouts. As a result, estimated: 20.0% of planned road safety projects face delays, 2024.
Opportunity: Vendors can expand by addressing underpenetrated private fleets and smart-city initiatives. These segments represent estimated: 1.5 billion USD, 2034 in additional addressable spending, 2024-2034.
Trend: Digital enforcement, analytics, and automation increasingly shape road safety deployments. Estimated: 65.0% of new road safety investments, 2028 are expected to embed AI-enabled monitoring and decision support, 2024-2034.
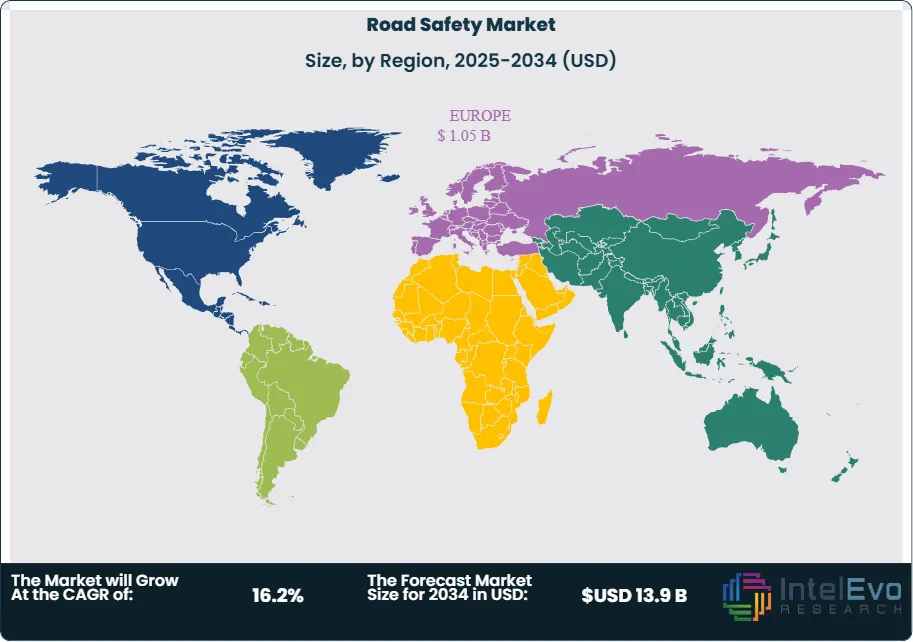
Regional Analysis: Europe leads the regional landscape with a 29.1%, 2024 market share and 0.9 billion USD, 2024 in revenues. Faster-growing regions outside Europe are projected to contribute estimated: 40.0% of incremental global market expansion, 2024-2034.
By Solution Type
Red light and speed enforcement systems hold a significant position in the 2025 market, accounting for 58.3 percent of global revenues. Their scale reflects continued investment from agencies seeking to reduce violations and improve compliance. Adoption rises as cities upgrade intersections with automated detection tools and as insurance programs tie compliance scores to risk evaluations. The segment is expected to expand steadily through 2030 as governments prioritize measurable outcomes in road safety programs.
Other system categories show meaningful traction. Incident detection and monitoring systems support faster response times and help reduce secondary accidents. Automatic license plate recognition systems record strong demand from tolling authorities and border agencies that require automated identification capabilities. Traffic management systems form the backbone of large urban programs that aim to improve flow and reduce queuing. Surveillance systems continue to scale as operators require wider visibility into traffic patterns and safety events. Together these categories contribute a growing share of investment as cities modernize core infrastructure and shift toward integrated digital monitoring.
Growth across solution types aligns with rising vehicle volumes and higher expectations for reliability. Vendors continue to enhance system accuracy and interoperability to support larger deployments. The combined shift toward automated enforcement and continuous monitoring strengthens the position of these solution types as core components of road safety strategies.
By Service Type
Professional services represent 82.5 percent of service-related revenue in 2025. Agencies depend on advisory, engineering, system design, and integration support to ensure that deployments comply with national safety standards and operate at full capacity. Implementation cycles remain complex, which drives continued demand for specialized expertise and structured project delivery.
Managed services form a smaller but expanding segment. Operators adopt subscription-based monitoring, maintenance, and analytics as a way to reduce operational burdens and maintain system readiness. This approach supports continuous updates to software, sensors, and analytics tools. It also helps agencies manage long-term performance without major capital outlays.
Both service types play a central role as deployments scale. Large programs require structured governance, cybersecurity oversight, and real-time operational support. As a result, service providers remain essential partners in the lifecycle of road safety systems.
By End-Use
Government and municipal agencies represent 47.6 percent of total demand in 2025. Their mandate to manage public safety and reduce crash rates drives recurring investment in enforcement, monitoring, and traffic management platforms. National strategies that target reduced fatalities by 2030 further support the segment.
Construction and infrastructure firms form the next major group of end users. They deploy temporary and permanent safety systems to protect workers, guide traffic around work zones, and comply with regulatory requirements. Demand rises as large transportation programs move forward in North America, Europe, and Asia.
Transportation and logistics companies adopt enforcement and monitoring tools to reduce fleet risk and improve delivery performance. Rising insurance scrutiny and higher claims costs strengthen the business case for in-cab monitoring, automated violation reporting, and route safety analytics. The segment is expected to expand as global freight volumes increase.
By Region
Europe holds 29.1 percent of the market in 2025 with a value of 0.90 billion USD. The region enforces strict compliance standards and invests consistently in roadway modernization. Programs that focus on lowering crash rates and expanding automated enforcement sustain Europe’s leadership. Countries in Western Europe deploy advanced systems at scale, while Eastern Europe shows rising adoption driven by cross-border freight flows.
North America records strong spending as agencies replace legacy systems and adopt automated detection technologies. Investments in federal infrastructure programs support wider deployment across highways and metropolitan corridors. Asia Pacific experiences the fastest growth due to rapid urban expansion, higher traffic density, and national programs aimed at reducing fatalities.
Latin America and the Middle East and Africa gain momentum as funding programs mature and authorities invest in structured enforcement models. Rising urbanization and increased commercial traffic create long-term opportunities for solution and service providers across these regions.
By Solution Type (Red Light Enforcement Systems, Speed Enforcement Systems, Incident Detection and Monitoring Systems, Automatic License Plate Recognition (ALPR) Systems, Traffic Management Systems, Surveillance Systems), By Service Type (Professional Services, Managed Services), By End-User (Government and Municipalities, Construction and Infrastructure Companies, Transportation and Logistics Companies)
Research Methodology
Primary Research- 100 Interviews of Stakeholders
Secondary Research
Desk Research
Regional scope
North America (United States, Canada, Mexico)
Latin America (Brazil, Argentina, Columbia)
East Asia And Pacific (China, Japan, South Korea, Australia, Cambodia, Fiji, Indonesia)
Sea And South Asia (India, Singapore, Thailand, Taiwan, Malaysia)
Eastern Europe (Poland, Russia, Czech Republic, Romania)
Western Europe (Germany, U.K., France, Spain, Itlay)
Middle East & Africa (GCC Countries, Egypt, Nigeria, South Africa, Israel)
Customization for segments, region/country-level will be provided. Moreover, additional customization can be done based on the requirements.
Pricing and Purchase Options
Avail customized purchase options to meet your exact research needs. We have three licenses to opt for: Single User License, Multi-User License (Up to 5 Users), Corporate Use License (Unlimited User and Printable PDF).
TABLE OF CONTENTS
1. EXECUTIVE SUMMARY
1.1. MARKET SNAPSHOT
1.2. KEY FINDINGS & INSIGHTS
1.3. ANALYST RECOMMENDATIONS
1.4. FUTURE OUTLOOK
2. RESEARCH METHODOLOGY
2.1. MARKET DEFINITION & SCOPE
2.2. RESEARCH OBJECTIVES: PRIMARY & SECONDARY DATA SOURCES
2.3. DATA COLLECTION SOURCES
2.3.1. COVERAGE OF 100+ PRIMARY RESEARCH/CONSULTATION CALLS WITH INDUSTRY STAKEHOLDERS
FIGURE 17 NORTH AMERICA ROAD SAFETYCURRENT AND FUTURE TYPE ANALYSIS, 2025–2034, (USD MILLION)
FIGURE 18 NORTH AMERICA ROAD SAFETYCURRENT AND FUTURE END USER ANALYSIS, 2025–2034, (USD MILLION)
FIGURE 19 MARKET SHARE BY COUNTRY
FIGURE 20 LATIN AMERICA ROAD SAFETYCURRENT AND FUTURE TYPE ANALYSIS, 2025–2034, (USD MILLION)
FIGURE 21 LATIN AMERICA ROAD SAFETYCURRENT AND FUTURE END USER ANALYSIS, 2025–2034, (USD MILLION)
FIGURE 22 MARKET SHARE BY COUNTRY
FIGURE 23 EASTERN EUROPE ROAD SAFETYCURRENT AND FUTURE TYPE ANALYSIS, 2025–2034, (USD MILLION)
FIGURE 24 EASTERN EUROPE ROAD SAFETYCURRENT AND FUTURE END USER ANALYSIS, 2025–2034, (USD MILLION)
FIGURE 25 MARKET SHARE BY COUNTRY
FIGURE 26 WESTERN EUROPE ROAD SAFETYCURRENT AND FUTURE TYPE ANALYSIS, 2025–2034, (USD MILLION)
FIGURE 27 WESTERN EUROPE ROAD SAFETYCURRENT AND FUTURE END USER ANALYSIS, 2025–2034, (USD MILLION)
FIGURE 28 MARKET SHARE BY COUNTRY
FIGURE 29 EAST ASIA AND PACIFIC ROAD SAFETYCURRENT AND FUTURE TYPE ANALYSIS, 2025–2034, (USD MILLION)
FIGURE 30 EAST ASIA AND PACIFIC ROAD SAFETYCURRENT AND FUTURE END USER ANALYSIS, 2025–2034, (USD MILLION)
FIGURE 31 MARKET SHARE BY COUNTRY
FIGURE 32 SEA AND SOUTH ASIA ROAD SAFETYCURRENT AND FUTURE TYPE ANALYSIS, 2025–2034, (USD MILLION)
FIGURE 33 SEA AND SOUTH ASIA ROAD SAFETYCURRENT AND FUTURE END USER ANALYSIS, 2025–2034, (USD MILLION)
FIGURE 34 MARKET SHARE BY COUNTRY
FIGURE 35 MIDDLE EAST AND AFRICA ROAD SAFETYCURRENT AND FUTURE TYPE ANALYSIS, 2025–2034, (USD MILLION)
FIGURE 36 MIDDLE EAST AND AFRICA ROAD SAFETYCURRENT AND FUTURE END USER ANALYSIS, 2025–2034, (USD MILLION)
FIGURE 37 NORTH AMERICA ROAD SAFETYCURRENT AND FUTURE MARKET VOLUME SHARE REGIONAL ANALYSIS, 2025–2034, (USD MILLION)
FIGURE 38 U.S. ROAD SAFETYCURRENT AND FUTURE TYPE ANALYSIS, 2025–2034, (USD MILLION)
FIGURE 39 U.S. ROAD SAFETYCURRENT AND FUTURE END USER ANALYSIS, 2025–2034, (USD MILLION)
FIGURE 40 CANADA ROAD SAFETYCURRENT AND FUTURE TYPE ANALYSIS, 2025–2034, (USD MILLION)
FIGURE 41 CANADA ROAD SAFETYCURRENT AND FUTURE END USER ANALYSIS, 2025–2034, (USD MILLION)
FIGURE 42 LATIN AMERICA ROAD SAFETYCURRENT AND FUTURE MARKET VOLUME SHARE REGIONAL ANALYSIS, 2025–2034, (USD MILLION)
FIGURE 43 MEXICO ROAD SAFETYCURRENT AND FUTURE TYPE ANALYSIS, 2025–2034, (USD MILLION)
FIGURE 44 MEXICO ROAD SAFETYCURRENT AND FUTURE END USER ANALYSIS, 2025–2034, (USD MILLION)
FIGURE 45 BRAZIL ROAD SAFETYCURRENT AND FUTURE TYPE ANALYSIS, 2025–2034, (USD MILLION)
FIGURE 46 BRAZIL ROAD SAFETYCURRENT AND FUTURE END USER ANALYSIS, 2025–2034, (USD MILLION)
FIGURE 47 ARGENTINA ROAD SAFETYCURRENT AND FUTURE TYPE ANALYSIS, 2025–2034, (USD MILLION)
FIGURE 48 ARGENTINA ROAD SAFETYCURRENT AND FUTURE END USER ANALYSIS, 2025–2034, (USD MILLION)
FIGURE 49 COLUMBIA ROAD SAFETYCURRENT AND FUTURE TYPE ANALYSIS, 2025–2034, (USD MILLION)
FIGURE 50 COLUMBIA ROAD SAFETYCURRENT AND FUTURE END USER ANALYSIS, 2025–2034, (USD MILLION)
FIGURE 51 REST OF LATIN AMERICA ROAD SAFETYCURRENT AND FUTURE TYPE ANALYSIS, 2025–2034, (USD MILLION)
FIGURE 52 REST OF LATIN AMERICA ROAD SAFETYCURRENT AND FUTURE END USER ANALYSIS, 2025–2034, (USD MILLION)
FIGURE 53 EASTERN EUROPE ROAD SAFETYCURRENT AND FUTURE MARKET VOLUME SHARE REGIONAL ANALYSIS, 2025–2034, (USD MILLION)
FIGURE 54 POLAND ROAD SAFETYCURRENT AND FUTURE TYPE ANALYSIS, 2025–2034, (USD MILLION)
FIGURE 55 POLAND ROAD SAFETYCURRENT AND FUTURE END USER ANALYSIS, 2025–2034, (USD MILLION)
FIGURE 56 RUSSIA ROAD SAFETYCURRENT AND FUTURE TYPE ANALYSIS, 2025–2034, (USD MILLION)
FIGURE 57 RUSSIA ROAD SAFETYCURRENT AND FUTURE END USER ANALYSIS, 2025–2034, (USD MILLION)
FIGURE 58 CZECH REPUBLIC ROAD SAFETYCURRENT AND FUTURE TYPE ANALYSIS, 2025–2034, (USD MILLION)
FIGURE 59 CZECH REPUBLIC ROAD SAFETYCURRENT AND FUTURE END USER ANALYSIS, 2025–2034, (USD MILLION)
FIGURE 60 ROMANIA ROAD SAFETYCURRENT AND FUTURE TYPE ANALYSIS, 2025–2034, (USD MILLION)
FIGURE 61 ROMANIA ROAD SAFETYCURRENT AND FUTURE END USER ANALYSIS, 2025–2034, (USD MILLION)
FIGURE 62 REST OF EASTERN EUROPE ROAD SAFETYCURRENT AND FUTURE TYPE ANALYSIS, 2025–2034, (USD MILLION)
FIGURE 63 REST OF EASTERN EUROPE ROAD SAFETYCURRENT AND FUTURE END USER ANALYSIS, 2025–2034, (USD MILLION)
FIGURE 64 WESTERN EUROPE ROAD SAFETYCURRENT AND FUTURE MARKET VOLUME SHARE REGIONAL ANALYSIS, 2025–2034, (USD MILLION)
FIGURE 65 GERMANY ROAD SAFETYCURRENT AND FUTURE TYPE ANALYSIS, 2025–2034, (USD MILLION)
FIGURE 66 GERMANY ROAD SAFETYCURRENT AND FUTURE END USER ANALYSIS, 2025–2034, (USD MILLION)
FIGURE 67 FRANCE ROAD SAFETYCURRENT AND FUTURE TYPE ANALYSIS, 2025–2034, (USD MILLION)
FIGURE 68 FRANCE ROAD SAFETYCURRENT AND FUTURE END USER ANALYSIS, 2025–2034, (USD MILLION)
FIGURE 69 UK ROAD SAFETYCURRENT AND FUTURE TYPE ANALYSIS, 2025–2034, (USD MILLION)
FIGURE 70 UK ROAD SAFETYCURRENT AND FUTURE END USER ANALYSIS, 2025–2034, (USD MILLION)
FIGURE 71 SPAIN ROAD SAFETYCURRENT AND FUTURE TYPE ANALYSIS, 2025–2034, (USD MILLION)
FIGURE 72 SPAIN ROAD SAFETYCURRENT AND FUTURE END USER ANALYSIS, 2025–2034, (USD MILLION)
FIGURE 73 ITALY ROAD SAFETYCURRENT AND FUTURE TYPE ANALYSIS, 2025–2034, (USD MILLION)
FIGURE 74 ITALY ROAD SAFETYCURRENT AND FUTURE END USER ANALYSIS, 2025–2034, (USD MILLION)
FIGURE 75 REST OF WESTERN EUROPE ROAD SAFETYCURRENT AND FUTURE TYPE ANALYSIS, 2025–2034, (USD MILLION)
FIGURE 76 REST OF WESTERN EUROPE ROAD SAFETYCURRENT AND FUTURE END USER ANALYSIS, 2025–2034, (USD MILLION)
FIGURE 77 EAST ASIA AND PACIFIC ROAD SAFETYCURRENT AND FUTURE MARKET VOLUME SHARE REGIONAL ANALYSIS, 2025–2034, (USD MILLION)
FIGURE 78 CHINA ROAD SAFETYCURRENT AND FUTURE TYPE ANALYSIS, 2025–2034, (USD MILLION)
FIGURE 79 CHINA ROAD SAFETYCURRENT AND FUTURE END USER ANALYSIS, 2025–2034, (USD MILLION)
FIGURE 80 JAPAN ROAD SAFETYCURRENT AND FUTURE TYPE ANALYSIS, 2025–2034, (USD MILLION)
FIGURE 81 JAPAN ROAD SAFETYCURRENT AND FUTURE END USER ANALYSIS, 2025–2034, (USD MILLION)
FIGURE 82 AUSTRALIA ROAD SAFETYCURRENT AND FUTURE TYPE ANALYSIS, 2025–2034, (USD MILLION)
FIGURE 83 AUSTRALIA ROAD SAFETYCURRENT AND FUTURE END USER ANALYSIS, 2025–2034, (USD MILLION)
FIGURE 84 CAMBODIA ROAD SAFETYCURRENT AND FUTURE TYPE ANALYSIS, 2025–2034, (USD MILLION)
FIGURE 85 CAMBODIA ROAD SAFETYCURRENT AND FUTURE END USER ANALYSIS, 2025–2034, (USD MILLION)
FIGURE 86 FIJI ROAD SAFETYCURRENT AND FUTURE TYPE ANALYSIS, 2025–2034, (USD MILLION)
FIGURE 87 FIJI ROAD SAFETYCURRENT AND FUTURE END USER ANALYSIS, 2025–2034, (USD MILLION)
FIGURE 88 INDONESIA ROAD SAFETYCURRENT AND FUTURE TYPE ANALYSIS, 2025–2034, (USD MILLION)
FIGURE 89 INDONESIA ROAD SAFETYCURRENT AND FUTURE END USER ANALYSIS, 2025–2034, (USD MILLION)
FIGURE 90 SOUTH KOREA ROAD SAFETYCURRENT AND FUTURE TYPE ANALYSIS, 2025–2034, (USD MILLION)
FIGURE 91 SOUTH KOREA ROAD SAFETYCURRENT AND FUTURE END USER ANALYSIS, 2025–2034, (USD MILLION)
FIGURE 92 REST OF EAST ASIA AND PACIFIC ROAD SAFETYCURRENT AND FUTURE TYPE ANALYSIS, 2025–2034, (USD MILLION)
FIGURE 93 REST OF EAST ASIA AND PACIFIC ROAD SAFETYCURRENT AND FUTURE END USER ANALYSIS, 2025–2034, (USD MILLION)
FIGURE 94 SEA AND SOUTH ASIA ROAD SAFETYCURRENT AND FUTURE MARKET VOLUME SHARE REGIONAL ANALYSIS, 2025–2034, (USD MILLION)
FIGURE 95 BANGLADESH ROAD SAFETYCURRENT AND FUTURE TYPE ANALYSIS, 2025–2034, (USD MILLION)
FIGURE 96 BANGLADESH ROAD SAFETYCURRENT AND FUTURE END USER ANALYSIS, 2025–2034, (USD MILLION)
FIGURE 97 NEW ZEALAND ROAD SAFETYCURRENT AND FUTURE TYPE ANALYSIS, 2025–2034, (USD MILLION)
FIGURE 98 NEW ZEALAND ROAD SAFETYCURRENT AND FUTURE END USER ANALYSIS, 2025–2034, (USD MILLION)
FIGURE 99 INDIA ROAD SAFETYCURRENT AND FUTURE TYPE ANALYSIS, 2025–2034, (USD MILLION)
FIGURE 100 INDIA ROAD SAFETYCURRENT AND FUTURE END USER ANALYSIS, 2025–2034, (USD MILLION)
FIGURE 101 SINGAPORE ROAD SAFETYCURRENT AND FUTURE TYPE ANALYSIS, 2025–2034, (USD MILLION)
FIGURE 102 SINGAPORE ROAD SAFETYCURRENT AND FUTURE END USER ANALYSIS, 2025–2034, (USD MILLION)
FIGURE 103 THAILAND ROAD SAFETYCURRENT AND FUTURE TYPE ANALYSIS, 2025–2034, (USD MILLION)
FIGURE 104 THAILAND ROAD SAFETYCURRENT AND FUTURE END USER ANALYSIS, 2025–2034, (USD MILLION)
FIGURE 105 TAIWAN ROAD SAFETYCURRENT AND FUTURE TYPE ANALYSIS, 2025–2034, (USD MILLION)
FIGURE 106 TAIWAN ROAD SAFETYCURRENT AND FUTURE END USER ANALYSIS, 2025–2034, (USD MILLION)
FIGURE 107 MALAYSIA ROAD SAFETYCURRENT AND FUTURE TYPE ANALYSIS, 2025–2034, (USD MILLION)
FIGURE 108 MALAYSIA ROAD SAFETYCURRENT AND FUTURE END USER ANALYSIS, 2025–2034, (USD MILLION)
FIGURE 109 REST OF SEA AND SOUTH ASIA ROAD SAFETYCURRENT AND FUTURE TYPE ANALYSIS, 2025–2034, (USD MILLION)
FIGURE 110 REST OF SEA AND SOUTH ASIA ROAD SAFETYCURRENT AND FUTURE END USER ANALYSIS, 2025–2034, (USD MILLION)
FIGURE 111 MIDDLE EAST AND AFRICA ROAD SAFETYCURRENT AND FUTURE MARKET VOLUME SHARE REGIONAL ANALYSIS, 2025–2034, (USD MILLION)
FIGURE 112 GCC COUNTRIES ROAD SAFETYCURRENT AND FUTURE TYPE ANALYSIS, 2025–2034, (USD MILLION)
FIGURE 113 GCC COUNTRIES ROAD SAFETYCURRENT AND FUTURE END USER ANALYSIS, 2025–2034, (USD MILLION)
FIGURE 114 SAUDI ARABIA ROAD SAFETYCURRENT AND FUTURE TYPE ANALYSIS, 2025–2034, (USD MILLION)
FIGURE 115 SAUDI ARABIA ROAD SAFETYCURRENT AND FUTURE END USER ANALYSIS, 2025–2034, (USD MILLION)
FIGURE 116 UAE ROAD SAFETYCURRENT AND FUTURE TYPE ANALYSIS, 2025–2034, (USD MILLION)
FIGURE 117 UAE ROAD SAFETYCURRENT AND FUTURE END USER ANALYSIS, 2025–2034, (USD MILLION)
FIGURE 118 BAHRAIN ROAD SAFETYCURRENT AND FUTURE TYPE ANALYSIS, 2025–2034, (USD MILLION)
FIGURE 119 BAHRAIN ROAD SAFETYCURRENT AND FUTURE END USER ANALYSIS, 2025–2034, (USD MILLION)
FIGURE 120 KUWAIT ROAD SAFETYCURRENT AND FUTURE TYPE ANALYSIS, 2025–2034, (USD MILLION)
FIGURE 121 KUWAIT ROAD SAFETYCURRENT AND FUTURE END USER ANALYSIS, 2025–2034, (USD MILLION)
FIGURE 122 OMAN ROAD SAFETYCURRENT AND FUTURE TYPE ANALYSIS, 2025–2034, (USD MILLION)
FIGURE 123 OMAN ROAD SAFETYCURRENT AND FUTURE END USER ANALYSIS, 2025–2034, (USD MILLION)
FIGURE 124 QATAR ROAD SAFETYCURRENT AND FUTURE TYPE ANALYSIS, 2025–2034, (USD MILLION)
FIGURE 125 QATAR ROAD SAFETYCURRENT AND FUTURE END USER ANALYSIS, 2025–2034, (USD MILLION)
FIGURE 126 EGYPT ROAD SAFETYCURRENT AND FUTURE TYPE ANALYSIS, 2025–2034, (USD MILLION)
FIGURE 127 EGYPT ROAD SAFETYCURRENT AND FUTURE END USER ANALYSIS, 2025–2034, (USD MILLION)
FIGURE 128 NIGERIA ROAD SAFETYCURRENT AND FUTURE TYPE ANALYSIS, 2025–2034, (USD MILLION)
FIGURE 129 NIGERIA ROAD SAFETYCURRENT AND FUTURE END USER ANALYSIS, 2025–2034, (USD MILLION)
FIGURE 130 SOUTH AFRICA ROAD SAFETYCURRENT AND FUTURE TYPE ANALYSIS, 2025–2034, (USD MILLION)
FIGURE 131 SOUTH AFRICA ROAD SAFETYCURRENT AND FUTURE END USER ANALYSIS, 2025–2034, (USD MILLION)
FIGURE 132 ISRAEL ROAD SAFETYCURRENT AND FUTURE TYPE ANALYSIS, 2025–2034, (USD MILLION)
FIGURE 133 ISRAEL ROAD SAFETYCURRENT AND FUTURE END USER ANALYSIS, 2025–2034, (USD MILLION)
FIGURE 134 REST OF MEA ROAD SAFETYCURRENT AND FUTURE TYPE ANALYSIS, 2025–2034, (USD MILLION)
FIGURE 135 REST OF MEA ROAD SAFETYCURRENT AND FUTURE END USER ANALYSIS, 2025–2034, (USD MILLION)
FIGURE 136 U. S. MARKET SHARE ANALYSIS BY TYPE (2024)
FIGURE 137 U. S. MARKET SHARE ANALYSIS BY END USER (2024)
FIGURE 138 CANADA MARKET SHARE ANALYSIS BY TYPE (2024)
FIGURE 139 CANADA MARKET SHARE ANALYSIS BY END USER (2024)
FIGURE 140 MEXICO MARKET SHARE ANALYSIS BY TYPE (2024)
FIGURE 141 MEXICO MARKET SHARE ANALYSIS BY END USER (2024)
FIGURE 142 CHINA MARKET SHARE ANALYSIS BY TYPE (2024)
FIGURE 143 CHINA MARKET SHARE ANALYSIS BY END USER (2024)
FIGURE 144 JAPAN MARKET SHARE ANALYSIS BY TYPE (2024)
FIGURE 145 JAPAN MARKET SHARE ANALYSIS BY END USER (2024)
FIGURE 146 INDIA MARKET SHARE ANALYSIS BY TYPE (2024)
FIGURE 147 INDIA MARKET SHARE ANALYSIS BY END USER (2024)
FIGURE 148 SOUTH KOREA MARKET SHARE ANALYSIS BY TYPE (2024)
FIGURE 149 SOUTH KOREA MARKET SHARE ANALYSIS BY END USER (2024)
FIGURE 150 SAUDI ARABIA MARKET SHARE ANALYSIS BY TYPE (2024)
FIGURE 151 SAUDI ARABIA MARKET SHARE ANALYSIS BY END USER (2024)
FIGURE 152 UAE MARKET SHARE ANALYSIS BY TYPE (2024)
FIGURE 153 UAE MARKET SHARE ANALYSIS BY END USER (2024)
FIGURE 154 EGYPT MARKET SHARE ANALYSIS BY TYPE (2024)
FIGURE 155 EGYPT MARKET SHARE ANALYSIS BY END USER (2024)
FIGURE 156 NIGERIA MARKET SHARE ANALYSIS BY TYPE (2024)
FIGURE 157 NIGERIA MARKET SHARE ANALYSIS BY END USER (2024)
FIGURE 158 SOUTH AFRICA MARKET SHARE ANALYSIS BY TYPE (2024)
FIGURE 159 SOUTH AFRICA MARKET SHARE ANALYSIS BY END USER (2024)
FIGURE 160 GERMANY MARKET SHARE ANALYSIS BY TYPE (2024)
FIGURE 161 GERMANY MARKET SHARE ANALYSIS BY END USER (2024)
FIGURE 162 FRANCE MARKET SHARE ANALYSIS BY TYPE (2024)
FIGURE 163 FRANCE MARKET SHARE ANALYSIS BY END USER (2024)
FIGURE 164 UK MARKET SHARE ANALYSIS BY TYPE (2024)
FIGURE 165 UK MARKET SHARE ANALYSIS BY END USER (2024)
FIGURE 166 SPAIN MARKET SHARE ANALYSIS BY TYPE (2024)
FIGURE 167 SPAIN MARKET SHARE ANALYSIS BY END USER (2024)
FIGURE 168 ITALY MARKET SHARE ANALYSIS BY TYPE (2024)
FIGURE 169 ITALY MARKET SHARE ANALYSIS BY END USER (2024)
FIGURE 170 BRAZIL MARKET SHARE ANALYSIS BY TYPE (2024)
FIGURE 171 BRAZIL MARKET SHARE ANALYSIS BY END USER (2024)
FIGURE 172 ARGENTINA MARKET SHARE ANALYSIS BY TYPE (2024)
FIGURE 173 ARGENTINA MARKET SHARE ANALYSIS BY END USER (2024)
FIGURE 174 COLUMBIA MARKET SHARE ANALYSIS BY TYPE (2024)
FIGURE 175 COLUMBIA MARKET SHARE ANALYSIS BY END USER (2024)
FIGURE 176 GLOBAL ROAD SAFETYCURRENT AND FUTURE MARKET KEY COUNTRY LEVEL ANALYSIS, 2024–2034, (USD MILLION)
FIGURE 177 FINANCIAL OVERVIEW:
Key Player Analysis
Kapsch TrafficCom AG: Kapsch TrafficCom AG positions itself as a market leader in advanced traffic enforcement and intelligent transport systems. The company builds a strong presence in Europe and North America with comprehensive platforms that integrate automated enforcement, traffic management software, and V2X communication tools. Its portfolio aligns with 2025 priorities as agencies increase adoption of connected infrastructure and multi-lane free flow systems. Kapsch reports steady revenue growth in tolling and enforcement, supported by multi-year contracts with national road authorities. The firm invests in AI-driven analytics to improve violation processing accuracy and reduce operational costs for customers. Partnerships with technology vendors and transport operators expand its ecosystem and reinforce its position in large-scale modernization programs.
The company differentiates itself through end-to-end delivery capabilities and strong integration expertise. Kapsch maintains a competitive edge through its regional service network and long-term maintenance contracts, which secure recurring revenue streams. Its ability to support governments through full lifecycle deployment, from system design to back-office operations, strengthens market share in high-value enforcement projects across Europe, the Middle East, and Latin America.
Sensys Gatso Group AB: Sensys Gatso Group AB operates as a strong challenger in the enforcement market with a focus on automated speed and red-light monitoring systems. The company gains traction through its modular product portfolio and competitive pricing models suited for both developed and emerging markets. Sensys Gatso continues to expand its global footprint with new contracts in the United States, the Middle East, and Southeast Asia. Recurring service revenues grow as more agencies adopt managed enforcement programs supported by the company’s ticket processing platform.
Strategic priorities include investments in radar-based detection, AI-supported violation validation, and cloud processing technology. These initiatives support faster deployment cycles and lower infrastructure requirements for agencies. Sensys Gatso differentiates itself through operational efficiency and flexible program structures, including pay-per-use enforcement models that appeal to budget-constrained municipalities. Its strong foothold in speed enforcement positions the company for continued growth as governments target reductions in fatality rates by 2030.
Redflex Holdings: Redflex Holdings operates as an established enforcement solution provider with a strong presence in North America and Australia. The firm is recognized for its automated red-light and speed enforcement systems and its cloud-based back-office processing platform. Redflex aligns with current market trends by expanding digital enforcement services and integrating enhanced image processing capabilities. The company secures multiyear contracts with state and municipal agencies, which supports a consistent revenue base as demand grows for automated compliance tools.
Redflex differentiates itself through its experience managing large public safety programs and its ability to support high case volumes through centralized processing centers. The firm continues to expand partnerships with city governments and transportation agencies to modernize legacy enforcement assets. Its investment in AI-based image review and system health monitoring strengthens accuracy and reliability, giving Redflex a competitive edge as agencies prioritize measurable safety outcomes in 2025 and beyond.
Market Key Players
IDEMIA
Redflex Holdings
Cubic Corporation
FLIR Systems, Inc.
Verra Mobility Corporation
SWARCO AG
Motorola Solutions, Inc.
Conduent, Inc.
Kapsch TrafficCom AG
Jenoptik AG
Siemens Mobility
Sensys Gatso Group AB
Thales Group
Driver: Managing Rising Road Density
Rising Vehicle Volumes and Collision Risks
Road networks face unprecedented pressure as global vehicle numbers keep rising. Registration rates in key markets grow between 3% and 6% each year. This surge in traffic density increases collision risks, pushing transportation agencies to adopt more aggressive safety measures. To address these dangers, there is a strong push to invest in automated enforcement systems and smart intersections that handle complex traffic flows better than traditional methods.
The Expansion of Connected Infrastructure
Cities are quickly rolling out Vehicle-to-Infrastructure (V2I) communication programs. These programs create a digital link between modern vehicles, traffic signals, and roadside units. Initial data is very promising, showing a reduction in severe incidents by up to 30% in connected corridors. These measurable safety improvements support the financial case for wider deployment, moving the market toward steady double-digit growth as connected infrastructure becomes a standard requirement for urban planning by 2030.
Restraint: Economic and Operational Hurdles
Regional Adoption Gaps and Procurement Delays
Despite technological advancements, significant adoption gaps remain a major obstacle, especially in lower-income areas that struggle with the high costs of advanced enforcement systems. This economic inequality is expected to slow global market growth by about 15%, as many regions prioritize basic infrastructure over high-tech safety tools. Additionally, even in well-funded areas, uneven regulatory alignment and slow procurement processes often delay the deployment of essential safety technologies.
Maintenance Constraints and Asset Aging
Ongoing maintenance continues to be a consistent challenge, with operators reporting system downtime nearing 10% each year. These outages often result from the difficulties of maintaining old assets alongside new technology, compounded by a shortage of specialized support. These operational challenges reduce the overall return on investment (ROI) for agencies, prompting vendors to focus on developing simpler hardware designs and more affordable long-term service models.
Opportunity: The AI and Predictive Analytics Frontier
High-Growth Cloud and AI Coordination
There is significant potential for growth in AI-based detection and cloud coordination platforms. Spending in this area is expected to reach USD 2.5 billion by 2030. Governments are increasingly looking for advanced solutions that go beyond simple monitoring to provide predictive analytics that can identify high-risk areas before accidents happen. This demand is driving a compound annual growth rate (CAGR) of nearly 14% as agencies aim to automate violation processing and enhance the accuracy of emergency response dispatching.
Smart Signage and Digital Compliance
In addition to enforcement, there is a rising demand for smart signage and connected traffic lighting systems that can adapt in real-time to changing road conditions. These digital compliance tools enable dynamic speed limits and lane management, which reduce crash probabilities in high-density areas. Markets that act early to implement these smart systems will not only improve public safety but also see notable enhancements in overall traffic flow and operational efficiency.
Trend: The Vision-Guided and Zero-Fatality Shift
High-Resolution Monitoring and Edge Processing
The market is decisively shifting toward vision-guided monitoring and sensor fusion tools that support global "zero-fatality" safety goals. Agencies increasingly deploy high-resolution cameras with edge processors that analyze traffic data and provide actionable insights in seconds. This fast processing ability improves coordination between road operators and emergency teams, allowing for almost instant intervention when safety issues or collisions occur.
Data Ecosystems and Sustainable Materials
Modern cities are moving away from isolated data systems, instead integrating real-time feeds from vehicles, intersections, and commercial fleets into shared data ecosystems. This collaborative approach is also seen in a move toward sustainability. Agencies are beginning to test eco-friendly road markings and long-lasting materials designed to lessen the environmental impact of road maintenance. Together, these trends are fundamentally changing long-term technology plans and affecting how vendor partnerships are formed across the sector.
Recent Developments
Dec 2024 – Sensys Gatso Group: Sensys Gatso Australia secured a maintenance and support extension for automated traffic enforcement systems in Victoria, valued at about SEK 79 million (around AUD 11 million), with options for additional upgrades worth up to SEK 58 million through 2027. This strengthens the company’s TRaaS revenue base and reinforces its road safety position in the Australian market.
Feb 2025 – Kapsch TrafficCom: Kapsch TrafficCom won a four-year framework contract with Vegfinans in Norway, valued at approximately EUR 7.5 million with potential to reach a low double-digit million amount, to deploy its Autopass multi-lane free-flow tolling system across six counties. This contract expands Kapsch’s European tolling footprint and supports its role as a key partner in digital road user charging and safety-focused traffic management.
Apr 2025 – Verra Mobility: Verra Mobility was identified by New York City DOT as the selected vendor to manage the city’s automated enforcement camera safety programs for an expected five-year term after the current contract ends in December 2025, including red-light, speed, bus lane, and truck weight enforcement cameras. This decision secures one of the largest automated enforcement portfolios in the United States and reinforces Verra Mobility’s leadership in urban road safety programs.
Jun 2025 – Kapsch TrafficCom: Kapsch TrafficCom announced multiple wins to operate two Traffic Management Centers in New York State, a contract package valued at more than USD 10 million over three years and requiring 23 additional operations staff. This move deepens Kapsch’s presence in North American traffic operations and increases recurring service revenues linked to safety-focused network management.
Aug 2025 – Verra Mobility: Verra Mobility reported 2024–2025 school-year results showing its school bus stop-arm programs issued more than 100,000 citations across eight states, driving a 67 percent drop in violations and a 98 percent non-reoffence rate, while school zone speed programs recorded over 6 million violations with a 24 percent decline over the year. These outcomes provide data-backed proof of safety gains that support broader investment in automated enforcement around vulnerable road users.
Sep 2025 – Verra Mobility: Verra Mobility began a four-week non-enforcement technical trial of mobile “smart cameras” on Canterbury Road in Melbourne to detect multiple offences such as speed, red-light, bus lane misuse, seatbelt and mobile phone violations, using trailer-mounted units equipped with CCTV, GPS and on-board power, backed by a global base of roughly 9,000 deployed systems. This trial positions the company to shape future mobile enforcement contracts in Australia and demonstrates the potential of multi-offence detection to improve compliance on busy corridors.