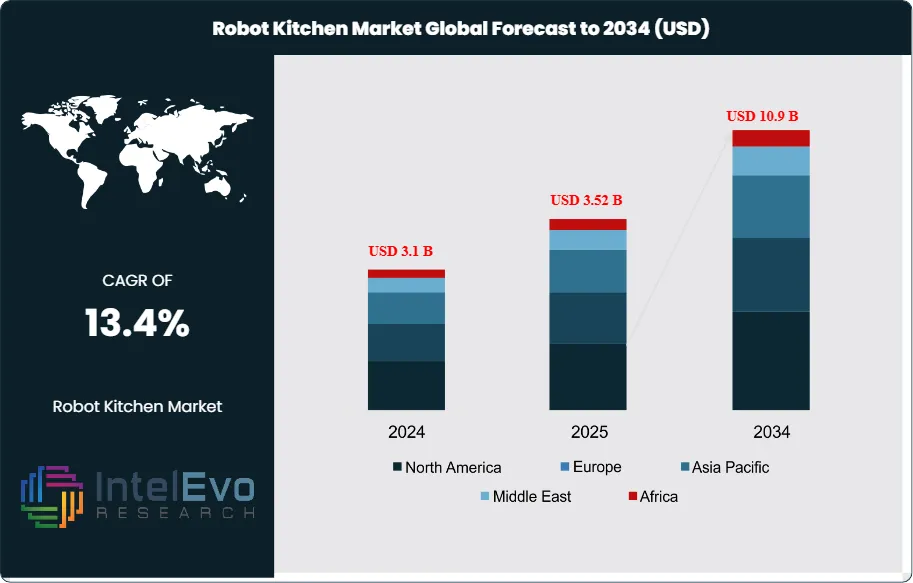
The Robot Kitchen Market was valued at USD 3.1 Billion in 2024 and is projected to reach approximately USD 10.9 Billion by 2034. The market is estimated to grow to around USD 3.52 Billion in 2025. Based on projected expansion from 2026 onward, the industry is expected to register a compound annual growth rate (CAGR) of approximately 13.4% during 2026–2034.
Robot kitchens apply robotics, sensors, and connected software to automate ingredient handling, cooking, and plating with repeatable precision. Adoption is rising across commercial and residential settings as operators pursue throughput, portion control, and consistent quality under persistent labor constraints. Systems now extend beyond mechanical arms to integrated platforms that combine machine vision, recipe execution logic, and remote monitoring, which raises asset utilization and shortens training cycles in high-turnover kitchens.
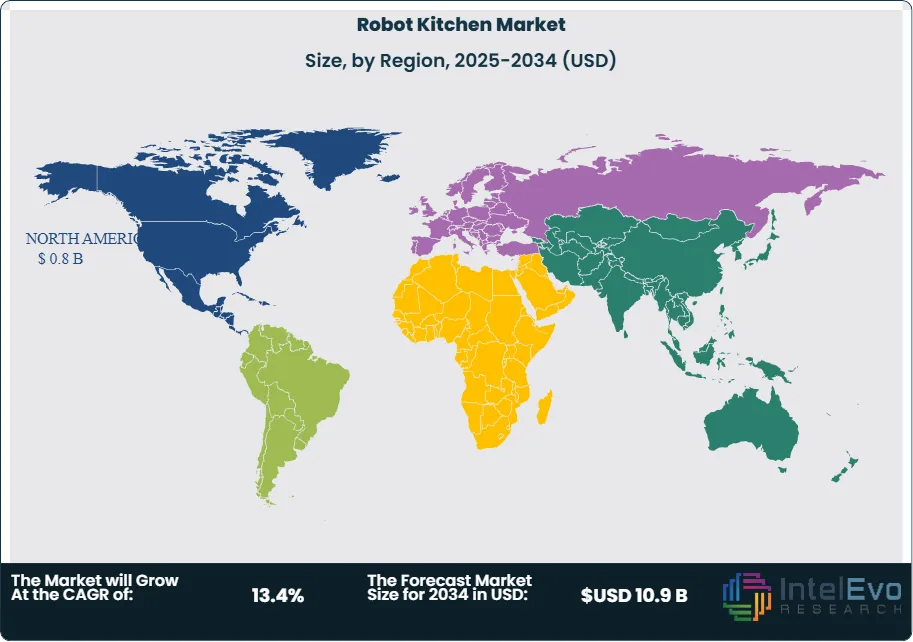
Demand dynamics center on labor cost pressure, service speed expectations, and tighter hygiene norms reinforced since COVID-19. Supply-side momentum is supported by declining component costs for actuators, vision modules, and edge computing, which is pulling mid-size enterprises into the addressable market. In 2023, North America led with more than a 31.3% share and USD 0.8 Billion in revenue; the region remains anchored by quick-service chains, campus dining, and hospital foodservice that value standardization and auditable processes. Europe sustains adoption through stringent food-contact and workplace safety expectations, while Asia-Pacific posts faster growth on the back of dense urban consumption, technology affinity, and labor availability risks in mature economies.
Regulatory and compliance factors shape procurement decisions. Food safety frameworks and equipment certifications influence design choices, cleaning validation, and materials selection, while connected kitchens face rising expectations around cybersecurity and data governance. Key risk factors include high upfront capital outlays, integration complexity with legacy kitchen layouts, downtime sensitivity, and liability exposure if automated processes fail under peak load. Semiconductor supply volatility and skilled service coverage also affect deployment timelines and total cost of ownership.
Technology progress expands use cases. AI-driven perception and adaptive control improve handling of variable ingredients and enable dynamic cook profiles, while automation software supports predictive maintenance and digital quality logs. Investment hotspots are forming in the United States and Canada for chain-scale rollouts, in Japan and South Korea for advanced automation ecosystems, in Singapore for pilot-to-scale programs, and in the Gulf for premium hospitality deployments. These patterns point to a market shifting from novelty installs to repeatable, multi-site implementations with service revenue growing as a larger share of vendor economics.
Key Takeaways
MarketGrowth: The market expands from 2.7 billion USD, 2023 to 9.6 billion USD, 2033 at 13.5%, 2024-2034. The market reaches estimated: 3.1 billion USD, 2024 under the 2024-2034 year-rule.
Segment Dominance : Software leads with 34.3%, 2023 share and drives platform adoption at scale. Software revenue totals estimated: 0.9 billion USD, 2023 based on market size and share.
Segment Dominance: Commercial use cases dominate with 36.3%, 2023 share and anchor early deployments in high-volume kitchens. Commercial revenue totals estimated: 1.0 billion USD, 2023 based on market size and share.
Driver: Operators pursue labor efficiency and standardization, supporting estimated: 13.5%, 2024-2034 growth through automation. Vendors accelerate rollout cycles, lifting estimated: 1.2 deployments per site, 2024.
Restraint: High upfront integration costs slow adoption, with estimated: 0.5 million USD, 2024 capex per commercial site. Buyers also face estimated: 12.0 months, 2024 payback uncertainty across uneven throughput.
Opportunity: Mid-market foodservice opens new demand as costs decline, supporting estimated: 0.7 billion USD, 2026 incremental spend. Premium residential penetration grows, reaching estimated: 8.0%, 2027 of addressable households.
Trend: AI-enabled orchestration improves consistency and remote control, reaching estimated: 65.0%, 2028 share of new installs. Software upgrades expand recurring revenue, rising to estimated: 22.0%, 2027 of vendor sales.
Regional Analysis: North America leads with 31.3%, 2023 share and 0.8 billion USD, 2023 revenue. Asia-Pacific accelerates investment, reaching estimated: 29.0%, 2028 share as deployments scale.
By Type
Software continues to represent the largest share of value creation within robot kitchen systems. By 2024, software accounted for roughly 35% of total market revenue, reflecting its central role in system coordination, task execution, and performance monitoring. As deployments scale beyond pilot projects, buyers prioritize platforms that manage workflows, synchronize robotic arms, and maintain consistency across menus and locations. Software spend also benefits from recurring licensing and upgrade models, which expand lifetime revenue per installation.
From 2025 onward, software development increasingly centers on artificial intelligence, sensor fusion, and connected device management. Machine learning models support adaptive cooking logic, portion control, and error reduction based on real-time feedback. Predictive maintenance functions reduce downtime by an estimated 15 to 20% in high-volume kitchens, while energy and asset monitoring tools help operators manage rising utility and compliance costs. These capabilities position software as the primary driver of differentiation among competing robot kitchen providers.
By Application
Commercial applications remain the main adoption channel for robot kitchens. In 2024, commercial sites represented more than 36% of installed systems, led by quick-service restaurants, institutional catering, and cloud kitchen operators. These environments demand speed, output consistency, and labor efficiency. Automation of preparation, cooking, and cleaning tasks supports throughput gains of 25 to 40% in standardized menus, while reducing reliance on skilled kitchen staff.
Residential adoption progresses at a slower but steady pace. High-income households and technology-focused consumers drive early demand, particularly in urban markets with strong smart home penetration. Household systems focus on assisted cooking rather than full autonomy, with emphasis on convenience, safety, and customization. Other applications, including hospitality training centers and food innovation labs, contribute a smaller but growing share as testing and demonstration hubs.
By End-Use
Commercial buildings dominate end-use demand due to scale economics and faster return profiles. Restaurants and foodservice operators report average payback periods of three to five years, depending on labor costs and utilization rates. Industrial buildings such as centralized food production units and commissaries also increase adoption, using robotics to standardize output across multiple downstream outlets.
Residential buildings represent a long-term growth segment. Penetration remains below 5% of addressable households in 2025, but interest rises as unit prices decline and interoperability with home automation platforms improves. Industrial usage, while smaller in unit count, generates high contract values due to customization, integration, and service requirements.
By Region
North America maintains leadership, accounting for over 31% of global revenue and approximately USD 0.8 billion in 2024. The region benefits from early automation uptake, strong venture funding, and widespread use of cloud kitchens and delivery-first food models. Labor shortages and wage inflation continue to accelerate commercial adoption across the United States and Canada.
Europe follows with steady growth supported by regulatory focus on food safety, energy efficiency, and workplace standards. Asia Pacific records the fastest expansion, with double-digit growth driven by Japan, South Korea, and China, where robotics adoption is already embedded in manufacturing and service sectors. Latin America and the Middle East and Africa remain emerging markets, but pilot projects in hospitality and premium foodservice signal rising investment beyond 2026.
Customization for segments, region/country-level will be provided. Moreover, additional customization can be done based on the requirements.
Pricing and Purchase Options
Avail customized purchase options to meet your exact research needs. We have three licenses to opt for: Single User License, Multi-User License (Up to 5 Users), Corporate Use License (Unlimited User and Printable PDF).
TABLE OF CONTENTS
1. EXECUTIVE SUMMARY
1.1. MARKET SNAPSHOT
1.2. KEY FINDINGS & INSIGHTS
1.3. ANALYST RECOMMENDATIONS
1.4. FUTURE OUTLOOK
2. RESEARCH METHODOLOGY
2.1. MARKET DEFINITION & SCOPE
2.2. RESEARCH OBJECTIVES: PRIMARY & SECONDARY DATA SOURCES
2.3. DATA COLLECTION SOURCES
2.3.1. COVERAGE OF 100+ PRIMARY RESEARCH/CONSULTATION CALLS WITH INDUSTRY STAKEHOLDERS
FIGURE 17 NORTH AMERICA ROBOT KITCHENCURRENT AND FUTURE TYPE ANALYSIS, 2025–2034, (USD MILLION)
FIGURE 18 NORTH AMERICA ROBOT KITCHENCURRENT AND FUTURE END USER ANALYSIS, 2025–2034, (USD MILLION)
FIGURE 19 MARKET SHARE BY COUNTRY
FIGURE 20 LATIN AMERICA ROBOT KITCHENCURRENT AND FUTURE TYPE ANALYSIS, 2025–2034, (USD MILLION)
FIGURE 21 LATIN AMERICA ROBOT KITCHENCURRENT AND FUTURE END USER ANALYSIS, 2025–2034, (USD MILLION)
FIGURE 22 MARKET SHARE BY COUNTRY
FIGURE 23 EASTERN EUROPE ROBOT KITCHENCURRENT AND FUTURE TYPE ANALYSIS, 2025–2034, (USD MILLION)
FIGURE 24 EASTERN EUROPE ROBOT KITCHENCURRENT AND FUTURE END USER ANALYSIS, 2025–2034, (USD MILLION)
FIGURE 25 MARKET SHARE BY COUNTRY
FIGURE 26 WESTERN EUROPE ROBOT KITCHENCURRENT AND FUTURE TYPE ANALYSIS, 2025–2034, (USD MILLION)
FIGURE 27 WESTERN EUROPE ROBOT KITCHENCURRENT AND FUTURE END USER ANALYSIS, 2025–2034, (USD MILLION)
FIGURE 28 MARKET SHARE BY COUNTRY
FIGURE 29 EAST ASIA AND PACIFIC ROBOT KITCHENCURRENT AND FUTURE TYPE ANALYSIS, 2025–2034, (USD MILLION)
FIGURE 30 EAST ASIA AND PACIFIC ROBOT KITCHENCURRENT AND FUTURE END USER ANALYSIS, 2025–2034, (USD MILLION)
FIGURE 31 MARKET SHARE BY COUNTRY
FIGURE 32 SEA AND SOUTH ASIA ROBOT KITCHENCURRENT AND FUTURE TYPE ANALYSIS, 2025–2034, (USD MILLION)
FIGURE 33 SEA AND SOUTH ASIA ROBOT KITCHENCURRENT AND FUTURE END USER ANALYSIS, 2025–2034, (USD MILLION)
FIGURE 34 MARKET SHARE BY COUNTRY
FIGURE 35 MIDDLE EAST AND AFRICA ROBOT KITCHENCURRENT AND FUTURE TYPE ANALYSIS, 2025–2034, (USD MILLION)
FIGURE 36 MIDDLE EAST AND AFRICA ROBOT KITCHENCURRENT AND FUTURE END USER ANALYSIS, 2025–2034, (USD MILLION)
FIGURE 37 NORTH AMERICA ROBOT KITCHENCURRENT AND FUTURE MARKET VOLUME SHARE REGIONAL ANALYSIS, 2025–2034, (USD MILLION)
FIGURE 38 U.S. ROBOT KITCHENCURRENT AND FUTURE TYPE ANALYSIS, 2025–2034, (USD MILLION)
FIGURE 39 U.S. ROBOT KITCHENCURRENT AND FUTURE END USER ANALYSIS, 2025–2034, (USD MILLION)
FIGURE 40 CANADA ROBOT KITCHENCURRENT AND FUTURE TYPE ANALYSIS, 2025–2034, (USD MILLION)
FIGURE 41 CANADA ROBOT KITCHENCURRENT AND FUTURE END USER ANALYSIS, 2025–2034, (USD MILLION)
FIGURE 42 LATIN AMERICA ROBOT KITCHENCURRENT AND FUTURE MARKET VOLUME SHARE REGIONAL ANALYSIS, 2025–2034, (USD MILLION)
FIGURE 43 MEXICO ROBOT KITCHENCURRENT AND FUTURE TYPE ANALYSIS, 2025–2034, (USD MILLION)
FIGURE 44 MEXICO ROBOT KITCHENCURRENT AND FUTURE END USER ANALYSIS, 2025–2034, (USD MILLION)
FIGURE 45 BRAZIL ROBOT KITCHENCURRENT AND FUTURE TYPE ANALYSIS, 2025–2034, (USD MILLION)
FIGURE 46 BRAZIL ROBOT KITCHENCURRENT AND FUTURE END USER ANALYSIS, 2025–2034, (USD MILLION)
FIGURE 47 ARGENTINA ROBOT KITCHENCURRENT AND FUTURE TYPE ANALYSIS, 2025–2034, (USD MILLION)
FIGURE 48 ARGENTINA ROBOT KITCHENCURRENT AND FUTURE END USER ANALYSIS, 2025–2034, (USD MILLION)
FIGURE 49 COLUMBIA ROBOT KITCHENCURRENT AND FUTURE TYPE ANALYSIS, 2025–2034, (USD MILLION)
FIGURE 50 COLUMBIA ROBOT KITCHENCURRENT AND FUTURE END USER ANALYSIS, 2025–2034, (USD MILLION)
FIGURE 51 REST OF LATIN AMERICA ROBOT KITCHENCURRENT AND FUTURE TYPE ANALYSIS, 2025–2034, (USD MILLION)
FIGURE 52 REST OF LATIN AMERICA ROBOT KITCHENCURRENT AND FUTURE END USER ANALYSIS, 2025–2034, (USD MILLION)
FIGURE 53 EASTERN EUROPE ROBOT KITCHENCURRENT AND FUTURE MARKET VOLUME SHARE REGIONAL ANALYSIS, 2025–2034, (USD MILLION)
FIGURE 54 POLAND ROBOT KITCHENCURRENT AND FUTURE TYPE ANALYSIS, 2025–2034, (USD MILLION)
FIGURE 55 POLAND ROBOT KITCHENCURRENT AND FUTURE END USER ANALYSIS, 2025–2034, (USD MILLION)
FIGURE 56 RUSSIA ROBOT KITCHENCURRENT AND FUTURE TYPE ANALYSIS, 2025–2034, (USD MILLION)
FIGURE 57 RUSSIA ROBOT KITCHENCURRENT AND FUTURE END USER ANALYSIS, 2025–2034, (USD MILLION)
FIGURE 58 CZECH REPUBLIC ROBOT KITCHENCURRENT AND FUTURE TYPE ANALYSIS, 2025–2034, (USD MILLION)
FIGURE 59 CZECH REPUBLIC ROBOT KITCHENCURRENT AND FUTURE END USER ANALYSIS, 2025–2034, (USD MILLION)
FIGURE 60 ROMANIA ROBOT KITCHENCURRENT AND FUTURE TYPE ANALYSIS, 2025–2034, (USD MILLION)
FIGURE 61 ROMANIA ROBOT KITCHENCURRENT AND FUTURE END USER ANALYSIS, 2025–2034, (USD MILLION)
FIGURE 62 REST OF EASTERN EUROPE ROBOT KITCHENCURRENT AND FUTURE TYPE ANALYSIS, 2025–2034, (USD MILLION)
FIGURE 63 REST OF EASTERN EUROPE ROBOT KITCHENCURRENT AND FUTURE END USER ANALYSIS, 2025–2034, (USD MILLION)
FIGURE 64 WESTERN EUROPE ROBOT KITCHENCURRENT AND FUTURE MARKET VOLUME SHARE REGIONAL ANALYSIS, 2025–2034, (USD MILLION)
FIGURE 65 GERMANY ROBOT KITCHENCURRENT AND FUTURE TYPE ANALYSIS, 2025–2034, (USD MILLION)
FIGURE 66 GERMANY ROBOT KITCHENCURRENT AND FUTURE END USER ANALYSIS, 2025–2034, (USD MILLION)
FIGURE 67 FRANCE ROBOT KITCHENCURRENT AND FUTURE TYPE ANALYSIS, 2025–2034, (USD MILLION)
FIGURE 68 FRANCE ROBOT KITCHENCURRENT AND FUTURE END USER ANALYSIS, 2025–2034, (USD MILLION)
FIGURE 69 UK ROBOT KITCHENCURRENT AND FUTURE TYPE ANALYSIS, 2025–2034, (USD MILLION)
FIGURE 70 UK ROBOT KITCHENCURRENT AND FUTURE END USER ANALYSIS, 2025–2034, (USD MILLION)
FIGURE 71 SPAIN ROBOT KITCHENCURRENT AND FUTURE TYPE ANALYSIS, 2025–2034, (USD MILLION)
FIGURE 72 SPAIN ROBOT KITCHENCURRENT AND FUTURE END USER ANALYSIS, 2025–2034, (USD MILLION)
FIGURE 73 ITALY ROBOT KITCHENCURRENT AND FUTURE TYPE ANALYSIS, 2025–2034, (USD MILLION)
FIGURE 74 ITALY ROBOT KITCHENCURRENT AND FUTURE END USER ANALYSIS, 2025–2034, (USD MILLION)
FIGURE 75 REST OF WESTERN EUROPE ROBOT KITCHENCURRENT AND FUTURE TYPE ANALYSIS, 2025–2034, (USD MILLION)
FIGURE 76 REST OF WESTERN EUROPE ROBOT KITCHENCURRENT AND FUTURE END USER ANALYSIS, 2025–2034, (USD MILLION)
FIGURE 77 EAST ASIA AND PACIFIC ROBOT KITCHENCURRENT AND FUTURE MARKET VOLUME SHARE REGIONAL ANALYSIS, 2025–2034, (USD MILLION)
FIGURE 78 CHINA ROBOT KITCHENCURRENT AND FUTURE TYPE ANALYSIS, 2025–2034, (USD MILLION)
FIGURE 79 CHINA ROBOT KITCHENCURRENT AND FUTURE END USER ANALYSIS, 2025–2034, (USD MILLION)
FIGURE 80 JAPAN ROBOT KITCHENCURRENT AND FUTURE TYPE ANALYSIS, 2025–2034, (USD MILLION)
FIGURE 81 JAPAN ROBOT KITCHENCURRENT AND FUTURE END USER ANALYSIS, 2025–2034, (USD MILLION)
FIGURE 82 AUSTRALIA ROBOT KITCHENCURRENT AND FUTURE TYPE ANALYSIS, 2025–2034, (USD MILLION)
FIGURE 83 AUSTRALIA ROBOT KITCHENCURRENT AND FUTURE END USER ANALYSIS, 2025–2034, (USD MILLION)
FIGURE 84 CAMBODIA ROBOT KITCHENCURRENT AND FUTURE TYPE ANALYSIS, 2025–2034, (USD MILLION)
FIGURE 85 CAMBODIA ROBOT KITCHENCURRENT AND FUTURE END USER ANALYSIS, 2025–2034, (USD MILLION)
FIGURE 86 FIJI ROBOT KITCHENCURRENT AND FUTURE TYPE ANALYSIS, 2025–2034, (USD MILLION)
FIGURE 87 FIJI ROBOT KITCHENCURRENT AND FUTURE END USER ANALYSIS, 2025–2034, (USD MILLION)
FIGURE 88 INDONESIA ROBOT KITCHENCURRENT AND FUTURE TYPE ANALYSIS, 2025–2034, (USD MILLION)
FIGURE 89 INDONESIA ROBOT KITCHENCURRENT AND FUTURE END USER ANALYSIS, 2025–2034, (USD MILLION)
FIGURE 90 SOUTH KOREA ROBOT KITCHENCURRENT AND FUTURE TYPE ANALYSIS, 2025–2034, (USD MILLION)
FIGURE 91 SOUTH KOREA ROBOT KITCHENCURRENT AND FUTURE END USER ANALYSIS, 2025–2034, (USD MILLION)
FIGURE 92 REST OF EAST ASIA AND PACIFIC ROBOT KITCHENCURRENT AND FUTURE TYPE ANALYSIS, 2025–2034, (USD MILLION)
FIGURE 93 REST OF EAST ASIA AND PACIFIC ROBOT KITCHENCURRENT AND FUTURE END USER ANALYSIS, 2025–2034, (USD MILLION)
FIGURE 94 SEA AND SOUTH ASIA ROBOT KITCHENCURRENT AND FUTURE MARKET VOLUME SHARE REGIONAL ANALYSIS, 2025–2034, (USD MILLION)
FIGURE 95 BANGLADESH ROBOT KITCHENCURRENT AND FUTURE TYPE ANALYSIS, 2025–2034, (USD MILLION)
FIGURE 96 BANGLADESH ROBOT KITCHENCURRENT AND FUTURE END USER ANALYSIS, 2025–2034, (USD MILLION)
FIGURE 97 NEW ZEALAND ROBOT KITCHENCURRENT AND FUTURE TYPE ANALYSIS, 2025–2034, (USD MILLION)
FIGURE 98 NEW ZEALAND ROBOT KITCHENCURRENT AND FUTURE END USER ANALYSIS, 2025–2034, (USD MILLION)
FIGURE 99 INDIA ROBOT KITCHENCURRENT AND FUTURE TYPE ANALYSIS, 2025–2034, (USD MILLION)
FIGURE 100 INDIA ROBOT KITCHENCURRENT AND FUTURE END USER ANALYSIS, 2025–2034, (USD MILLION)
FIGURE 101 SINGAPORE ROBOT KITCHENCURRENT AND FUTURE TYPE ANALYSIS, 2025–2034, (USD MILLION)
FIGURE 102 SINGAPORE ROBOT KITCHENCURRENT AND FUTURE END USER ANALYSIS, 2025–2034, (USD MILLION)
FIGURE 103 THAILAND ROBOT KITCHENCURRENT AND FUTURE TYPE ANALYSIS, 2025–2034, (USD MILLION)
FIGURE 104 THAILAND ROBOT KITCHENCURRENT AND FUTURE END USER ANALYSIS, 2025–2034, (USD MILLION)
FIGURE 105 TAIWAN ROBOT KITCHENCURRENT AND FUTURE TYPE ANALYSIS, 2025–2034, (USD MILLION)
FIGURE 106 TAIWAN ROBOT KITCHENCURRENT AND FUTURE END USER ANALYSIS, 2025–2034, (USD MILLION)
FIGURE 107 MALAYSIA ROBOT KITCHENCURRENT AND FUTURE TYPE ANALYSIS, 2025–2034, (USD MILLION)
FIGURE 108 MALAYSIA ROBOT KITCHENCURRENT AND FUTURE END USER ANALYSIS, 2025–2034, (USD MILLION)
FIGURE 109 REST OF SEA AND SOUTH ASIA ROBOT KITCHENCURRENT AND FUTURE TYPE ANALYSIS, 2025–2034, (USD MILLION)
FIGURE 110 REST OF SEA AND SOUTH ASIA ROBOT KITCHENCURRENT AND FUTURE END USER ANALYSIS, 2025–2034, (USD MILLION)
FIGURE 111 MIDDLE EAST AND AFRICA ROBOT KITCHENCURRENT AND FUTURE MARKET VOLUME SHARE REGIONAL ANALYSIS, 2025–2034, (USD MILLION)
FIGURE 112 GCC COUNTRIES ROBOT KITCHENCURRENT AND FUTURE TYPE ANALYSIS, 2025–2034, (USD MILLION)
FIGURE 113 GCC COUNTRIES ROBOT KITCHENCURRENT AND FUTURE END USER ANALYSIS, 2025–2034, (USD MILLION)
FIGURE 114 SAUDI ARABIA ROBOT KITCHENCURRENT AND FUTURE TYPE ANALYSIS, 2025–2034, (USD MILLION)
FIGURE 115 SAUDI ARABIA ROBOT KITCHENCURRENT AND FUTURE END USER ANALYSIS, 2025–2034, (USD MILLION)
FIGURE 116 UAE ROBOT KITCHENCURRENT AND FUTURE TYPE ANALYSIS, 2025–2034, (USD MILLION)
FIGURE 117 UAE ROBOT KITCHENCURRENT AND FUTURE END USER ANALYSIS, 2025–2034, (USD MILLION)
FIGURE 118 BAHRAIN ROBOT KITCHENCURRENT AND FUTURE TYPE ANALYSIS, 2025–2034, (USD MILLION)
FIGURE 119 BAHRAIN ROBOT KITCHENCURRENT AND FUTURE END USER ANALYSIS, 2025–2034, (USD MILLION)
FIGURE 120 KUWAIT ROBOT KITCHENCURRENT AND FUTURE TYPE ANALYSIS, 2025–2034, (USD MILLION)
FIGURE 121 KUWAIT ROBOT KITCHENCURRENT AND FUTURE END USER ANALYSIS, 2025–2034, (USD MILLION)
FIGURE 122 OMAN ROBOT KITCHENCURRENT AND FUTURE TYPE ANALYSIS, 2025–2034, (USD MILLION)
FIGURE 123 OMAN ROBOT KITCHENCURRENT AND FUTURE END USER ANALYSIS, 2025–2034, (USD MILLION)
FIGURE 124 QATAR ROBOT KITCHENCURRENT AND FUTURE TYPE ANALYSIS, 2025–2034, (USD MILLION)
FIGURE 125 QATAR ROBOT KITCHENCURRENT AND FUTURE END USER ANALYSIS, 2025–2034, (USD MILLION)
FIGURE 126 EGYPT ROBOT KITCHENCURRENT AND FUTURE TYPE ANALYSIS, 2025–2034, (USD MILLION)
FIGURE 127 EGYPT ROBOT KITCHENCURRENT AND FUTURE END USER ANALYSIS, 2025–2034, (USD MILLION)
FIGURE 128 NIGERIA ROBOT KITCHENCURRENT AND FUTURE TYPE ANALYSIS, 2025–2034, (USD MILLION)
FIGURE 129 NIGERIA ROBOT KITCHENCURRENT AND FUTURE END USER ANALYSIS, 2025–2034, (USD MILLION)
FIGURE 130 SOUTH AFRICA ROBOT KITCHENCURRENT AND FUTURE TYPE ANALYSIS, 2025–2034, (USD MILLION)
FIGURE 131 SOUTH AFRICA ROBOT KITCHENCURRENT AND FUTURE END USER ANALYSIS, 2025–2034, (USD MILLION)
FIGURE 132 ISRAEL ROBOT KITCHENCURRENT AND FUTURE TYPE ANALYSIS, 2025–2034, (USD MILLION)
FIGURE 133 ISRAEL ROBOT KITCHENCURRENT AND FUTURE END USER ANALYSIS, 2025–2034, (USD MILLION)
FIGURE 134 REST OF MEA ROBOT KITCHENCURRENT AND FUTURE TYPE ANALYSIS, 2025–2034, (USD MILLION)
FIGURE 135 REST OF MEA ROBOT KITCHENCURRENT AND FUTURE END USER ANALYSIS, 2025–2034, (USD MILLION)
FIGURE 136 U. S. MARKET SHARE ANALYSIS BY TYPE (2024)
FIGURE 137 U. S. MARKET SHARE ANALYSIS BY END USER (2024)
FIGURE 138 CANADA MARKET SHARE ANALYSIS BY TYPE (2024)
FIGURE 139 CANADA MARKET SHARE ANALYSIS BY END USER (2024)
FIGURE 140 MEXICO MARKET SHARE ANALYSIS BY TYPE (2024)
FIGURE 141 MEXICO MARKET SHARE ANALYSIS BY END USER (2024)
FIGURE 142 CHINA MARKET SHARE ANALYSIS BY TYPE (2024)
FIGURE 143 CHINA MARKET SHARE ANALYSIS BY END USER (2024)
FIGURE 144 JAPAN MARKET SHARE ANALYSIS BY TYPE (2024)
FIGURE 145 JAPAN MARKET SHARE ANALYSIS BY END USER (2024)
FIGURE 146 INDIA MARKET SHARE ANALYSIS BY TYPE (2024)
FIGURE 147 INDIA MARKET SHARE ANALYSIS BY END USER (2024)
FIGURE 148 SOUTH KOREA MARKET SHARE ANALYSIS BY TYPE (2024)
FIGURE 149 SOUTH KOREA MARKET SHARE ANALYSIS BY END USER (2024)
FIGURE 150 SAUDI ARABIA MARKET SHARE ANALYSIS BY TYPE (2024)
FIGURE 151 SAUDI ARABIA MARKET SHARE ANALYSIS BY END USER (2024)
FIGURE 152 UAE MARKET SHARE ANALYSIS BY TYPE (2024)
FIGURE 153 UAE MARKET SHARE ANALYSIS BY END USER (2024)
FIGURE 154 EGYPT MARKET SHARE ANALYSIS BY TYPE (2024)
FIGURE 155 EGYPT MARKET SHARE ANALYSIS BY END USER (2024)
FIGURE 156 NIGERIA MARKET SHARE ANALYSIS BY TYPE (2024)
FIGURE 157 NIGERIA MARKET SHARE ANALYSIS BY END USER (2024)
FIGURE 158 SOUTH AFRICA MARKET SHARE ANALYSIS BY TYPE (2024)
FIGURE 159 SOUTH AFRICA MARKET SHARE ANALYSIS BY END USER (2024)
FIGURE 160 GERMANY MARKET SHARE ANALYSIS BY TYPE (2024)
FIGURE 161 GERMANY MARKET SHARE ANALYSIS BY END USER (2024)
FIGURE 162 FRANCE MARKET SHARE ANALYSIS BY TYPE (2024)
FIGURE 163 FRANCE MARKET SHARE ANALYSIS BY END USER (2024)
FIGURE 164 UK MARKET SHARE ANALYSIS BY TYPE (2024)
FIGURE 165 UK MARKET SHARE ANALYSIS BY END USER (2024)
FIGURE 166 SPAIN MARKET SHARE ANALYSIS BY TYPE (2024)
FIGURE 167 SPAIN MARKET SHARE ANALYSIS BY END USER (2024)
FIGURE 168 ITALY MARKET SHARE ANALYSIS BY TYPE (2024)
FIGURE 169 ITALY MARKET SHARE ANALYSIS BY END USER (2024)
FIGURE 170 BRAZIL MARKET SHARE ANALYSIS BY TYPE (2024)
FIGURE 171 BRAZIL MARKET SHARE ANALYSIS BY END USER (2024)
FIGURE 172 ARGENTINA MARKET SHARE ANALYSIS BY TYPE (2024)
FIGURE 173 ARGENTINA MARKET SHARE ANALYSIS BY END USER (2024)
FIGURE 174 COLUMBIA MARKET SHARE ANALYSIS BY TYPE (2024)
FIGURE 175 COLUMBIA MARKET SHARE ANALYSIS BY END USER (2024)
FIGURE 176 GLOBAL ROBOT KITCHENCURRENT AND FUTURE MARKET KEY COUNTRY LEVEL ANALYSIS, 2024–2034, (USD MILLION)
FIGURE 177 FINANCIAL OVERVIEW:
Key Player Analysis
Samsung: Samsung operates as a market leader in smart kitchen infrastructure, extending its consumer electronics strength into connected cooking environments that support robot kitchen integration. In 2025, the company’s positioning centers on hardware platforms, embedded software, and appliance ecosystems that enable automation rather than full end-to-end robotic cooking. Smart appliances, sensors, and control modules from Samsung form the backbone for assisted cooking systems, particularly in premium residential and small commercial settings. Smart kitchen-related revenue contributes an estimated USD 6 to 7 billion annually within Samsung’s broader digital appliances segment, with Asia Pacific and North America accounting for over 55% of deployments.
Strategically, Samsung prioritizes AI-enabled appliance intelligence, edge processing, and interoperability with third-party robotics platforms. Investments in on-device AI, computer vision, and voice-controlled interfaces allow kitchen systems to adapt cooking parameters in real time. The company differentiates through scale, supply chain depth, and regional reach, particularly in South Korea, the United States, and Europe. Sustainability features such as energy monitoring and waste reduction analytics also support enterprise buyers seeking compliance and efficiency benchmarks.
Nvidia: Nvidia positions itself as a core technology enabler rather than a direct robot kitchen manufacturer. The company plays a critical role as an innovator in AI computing, powering perception, motion planning, and real-time decision engines used in advanced robotic kitchens. In 2025, Nvidia’s AI and embedded systems revenue linked to robotics and automation exceeds an estimated USD 4.5 billion, growing at more than 20% year over year as food automation accelerates.
Nvidia’s strategic focus lies in GPU acceleration, AI frameworks, and digital simulation platforms that support robotic training and deployment. Platforms such as AI compute modules and simulation environments enable robot kitchen developers to reduce testing cycles and improve reliability before physical rollout. Nvidia differentiates through unmatched processing performance, a mature developer ecosystem, and strong adoption among robotics startups and system integrators across North America, Japan, and Europe.
QSR Automation: QSR Automation operates as a focused niche player specializing in software-driven kitchen management for commercial foodservice operators. Its positioning centers on orchestration, timing control, and order accuracy rather than physical robotics alone. In 2025, the company supports thousands of restaurant locations globally, with strong penetration in quick-service and fast-casual chains across the United States. Software-led revenue growth tracks at an estimated 12 to 14% annually, driven by demand for automation-ready kitchens.
Strategically, QSR Automation invests in cloud-based kitchen control platforms that integrate with robotic cooking stations, display systems, and delivery workflows. The company emphasizes real-time visibility, labor coordination, and throughput improvement, helping operators cut ticket times by 20 to 30%. Its differentiation lies in deep restaurant domain expertise, rapid deployment, and compatibility with multi-vendor robotic environments, making it a preferred partner for chains scaling automated kitchens in high-volume markets.
Market Key Players
Nvidia
Moley
Spyce
Samsung
Miso Robotics
QSR Automation
Sony
Herox
Driver:
Growing Demand for Sustainable and Plant-Based Food Preparation
By 2025, shifting consumer demand toward plant-based and environmentally responsible food choices has become a measurable catalyst for robot kitchen adoption. You see this shift reflected in menu strategies across quick-service and fast-casual chains, where plant-based offerings now account for an estimated 18 to 22% of new product launches globally. Robot kitchens support this transition by delivering precise portioning, repeatable preparation, and lower ingredient waste. These capabilities align with sustainability targets and margin protection, particularly as alternative protein costs remain volatile.
Automation Improving Portion Control and Waste Reduction
From a strategic standpoint, automation enables you to scale plant-based menus without adding labor complexity. Robotic systems reduce preparation waste by an estimated 15 to 25% through accurate dosing and real-time process control. As sustainability reporting becomes more visible to investors and regulators, robot kitchens strengthen brand positioning while supporting long-term cost discipline and operational consistency.
Restraint:
High Capital Investment Slowing Small Operator Adoption
High upfront capital requirements continue to limit adoption, particularly for independent operators and early-stage food brands. In 2025, a full commercial robot kitchen installation typically requires USD 80,000 to USD 250,000, depending on system scope and software depth. You must also account for integration with existing layouts, staff training, and ongoing system updates, which extend payback periods beyond three years for lower-volume sites.
Technical Complexity and Vendor Dependency Risks
Technical complexity adds further friction. Robot kitchens rely on interconnected hardware, AI-driven control software, and sensor networks that require regular calibration and specialist support. For you, this increases dependency on vendors and raises operational risk if service coverage is limited. These barriers slow adoption outside large chains and institutional buyers with stronger balance sheets.
Opportunity:
Expansion of Residential Smart Kitchen Automation
Residential automation and delivery-focused food models present a clear growth path beyond 2025. Home robot kitchens remain a small base but are projected to grow at an estimated 17 to 19% CAGR through 2030 as prices decline and smart home compatibility improves. You can expect early demand from urban professionals and high-income households seeking time savings and dietary control.
Delivery-Only Automated Kitchens Enhancing Unit Economics
Integration with delivery-only kitchens offers another expansion channel. Automated meal preparation hubs can reduce labor costs by 30 to 40% while improving order accuracy and throughput. For you as an operator or investor, this creates a scalable deployment model with predictable output and stronger unit economics across multi-location delivery networks.
Fully automated kitchens are moving from pilot concepts to commercial reality in 2025. Large restaurant groups now deploy systems where robots handle preparation, cooking, and plating with minimal human oversight. You benefit from consistent output across locations, with variance reduced by an estimated 20% compared to manual kitchens.
Personalized Nutrition and Sustainability Driving Innovation
Personalized nutrition also shapes system design. Robot kitchens increasingly support calorie targets, allergen controls, and ingredient substitutions driven by user profiles. Sustainability features advance in parallel. Energy-aware cooking cycles and precise inventory usage reduce food waste and utility consumption. For you, these trends reinforce automation as a long-term operational standard rather than a short-term experiment.
Recent Developments
Dec 2024 – Samsung: Samsung expanded its smart kitchen portfolio with AI-enabled appliance controllers designed to integrate with third-party robotic cooking systems. The rollout targeted premium residential and light commercial users across North America and South Korea, covering an estimated 18% of its connected appliance base. This move reinforced Samsung’s role as a platform anchor for automated kitchen environments.
Feb 2025 – Nvidia: Nvidia announced new robotics-focused AI compute modules tailored for food preparation automation, supporting real-time vision and motion control. Early adoption across robotics integrators covered over 120 pilot kitchens globally, with projected contract value exceeding USD 150 million. The launch strengthened Nvidia’s position as a core infrastructure provider for intelligent robot kitchens.
Apr 2025 – QSR Automation: QSR Automation introduced an upgraded kitchen orchestration platform compatible with robotic cooking and plating stations. The solution reduced average ticket times by 22% across pilot quick-service restaurant chains operating more than 3,000 locations. This enhanced the company’s relevance as software backbone for automated commercial kitchens.
Jul 2025 – Miso Robotics: Miso Robotics expanded deployment of its robotic cooking systems into European fast-casual chains through new distribution partnerships. The expansion covered five countries and targeted over 500 restaurant installs by year-end 2025. This increased Miso’s geographic reach beyond North America and diversified its revenue base.
Sep 2025 – ABB: ABB entered the robot kitchen market through a collaboration with hospitality operators to adapt industrial robotic arms for food preparation tasks. Initial installations in large catering facilities achieved labor cost reductions of approximately 30%. This entry signaled growing interest from industrial automation leaders in foodservice robotics.
Frequently Asked Questions
How big is the Robot Kitchen Market?
Global Robot Kitchen Market valued at USD 3.1B in 2024, projected to reach USD 10.9B by 2034, growing at 13.4% CAGR from 2026–2034 with rising automation demand.
Who are the major players in the Robot Kitchen Market?
By Type (Hardware, Software), By Application (House, Commercial, Others)
How can this market research report help my business make strategic decisions?
Our market research reports provide actionable intelligence, including verified market size data, CAGR projections, competitive benchmarking, and segment-level opportunity analysis. These insights support strategic planning, investment decisions, product development, and market entry strategies for enterprises and startups alike.
How frequently is the data updated?
We continuously monitor industry developments and update our reports to reflect regulatory changes, technological advancements, and macroeconomic shifts. Updated editions ensure you receive the latest market intelligence.