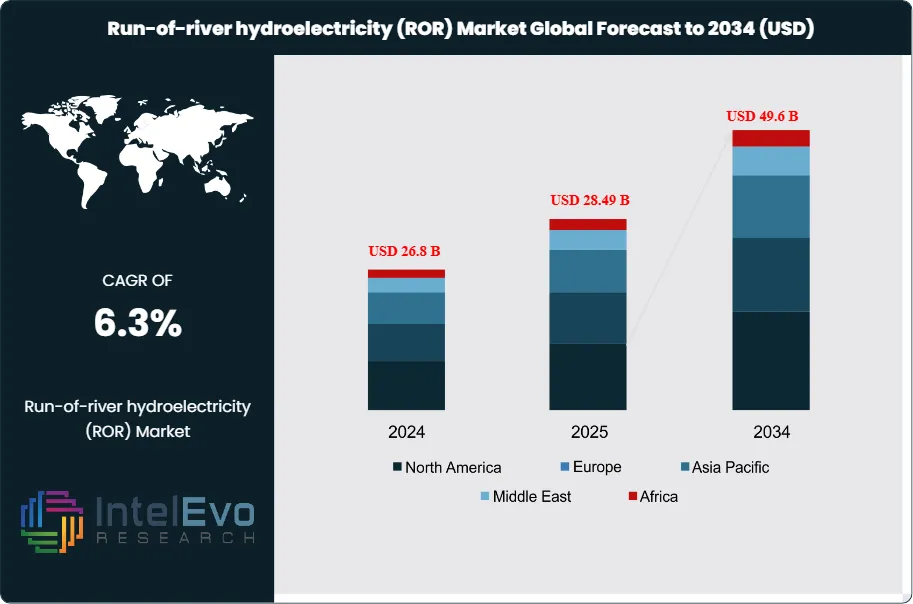
The Run-of-River (ROR) Hydroelectricity Market is estimated at USD 26.8 billion in 2024 and is projected to reach approximately USD 49.6 billion by 2034, registering a CAGR of about 6.3% during 2025–2034. Growth is supported by national decarbonization targets, rising grid-stability requirements, and continued investment in low-impact renewable generation. Run-of-river projects benefit from predictable output profiles, long-tenor power purchase agreements, and improving economics driven by turbine efficiency gains and digital operations. In parallel, repowering of aging hydro assets, expansion in emerging markets, and increased availability of green financing instruments are reinforcing the role of ROR hydro as a reliable baseload complement to variable solar and wind capacity.
ROR plants use the natural flow of rivers; they avoid large reservoirs. You get predictable output in basins with steady hydrology. In 2021–2022, ROR generation rose by almost 70 TWh, up nearly 2%, reaching about 4,300 TWh. Developers added 32 GW of new hydro capacity in that period; this was 40% above the five‑year average. China drove roughly three quarters of the net increase. The pipeline remains healthy through 2030 as countries push clean power targets and seek grid inertia from synchronous machines.
Demand-side drivers are clear. Utilities need firm, low-carbon supply to meet peak evening demand. Carbon prices and volatile gas markets improve ROR project economics. Typical capacity factors land near 30% to 55% depending on river seasonality. LCOE ranges around USD 45 to 110 per MWh in mature sites. On the supply side, modular turbines and standardized civil works shorten build times by 3 to 6 months. However, permitting and biodiversity rules extend lead times in OECD markets. Hydrological risk is rising with climate variability; multiyear droughts can cut output by 5% to 10%. Grid interconnection queues and inflation in steel and concrete add cost pressure; EPC prices rose 8% to 12% from 2021 levels.
Technology is improving reliability and yields. AI-based inflow forecasting can raise annual energy by 1% to 3%. Digital twins and condition-based maintenance cut unplanned downtime by 10% to 15%. Variable-speed generators improve part‑flow efficiency. Fish-friendly runners and nature-based fish passages reduce ecological impacts and speed approvals. Run-of-river storage hybrids with small ponds smooth daily fluctuations and support mini‑grids.
Asia Pacific leads new capacity and manufacturing depth. China, India, Nepal, and Southeast Asia host the largest project stacks. Latin America offers bankable sites in Colombia, Peru, and Chile under stable PPA frameworks. Europe focuses on repowering and small schemes in the Alps and Nordics. North America advances relicensing and upgrades rather than greenfield builds. Africa presents emerging hotspots along the Nile, Congo tributaries, and Ethiopian basins. If you target near-term investments, watch river basins with proven hydrology, existing grid corridors, and clear fish passage standards. If you prefer de-risked returns, pursue repowering and uprates that add 5% to 12% output with limited civil works.
Key Takeaways
Market Growth: The Generative AI in Waste Management market is estimated at USD 0.9 billion in 2025 and is projected to reach USD 5.6 billion by 2030. This implies a 39% CAGR driven by EPR policies, labor constraints, and multimodal AI that cuts contamination and service costs.
Application: Smart sorting and quality control leads with 34% revenue in 2025. AI vision paired with GenAI reporting lifts bale purity by 5–10 percentage points and reduces manual QA effort by 30–50%, with deployments from AMP Robotics, TOMRA, Greyparrot, and Machinex.
End Use: Municipal solid waste operators account for 58% of spend in 2025. Scale of curbside programs and citizen interactions favors GenAI copilots for service requests, contamination notices, and dynamic routing used by WM, Republic Services, Veolia, and SUEZ.
Driver: Regulatory pressure anchors demand. The EU targets 55% municipal recycling by 2025 and 65% by 2035; California SB 54 mandates 25% source reduction by 2032. You gain measurable ROI as GenAI automates EPR reporting and claim management.
Restraint: Data security and integration slow rollouts. In 2024 enterprise surveys, about 30% cite data governance as the top barrier; 25–35% of pilots stall at system integration. Inference and orchestration can add 8–12% to operating costs without edge deployment and caching.
Opportunity: On-truck multimodal analytics is set to exceed USD 1.2 billion by 2030 at a 44–48% CAGR. You can cut route miles 10–15% and reduce contamination claims 20–30% using camera streams plus GenAI copilots for real-time flags and customer messaging.
Trend: Synthetic data and large multimodal models improve long-tail detection. Operators report 3–7 point accuracy gains from synthetic imagery and 40–60% faster incident summarization with GenAI; early moves involve NVIDIA Metropolis partners and cloud stacks from Microsoft, Google Cloud, and AWS.
Regional Analysis: North America leads with 38% of 2025 revenue on high MRF automation and EPR momentum. Europe holds 32% with strong compliance use cases; Asia Pacific posts the fastest growth at 44% CAGR through 2030, led by China, Japan, South Korea, Singapore, and India smart-city programs.
Turbine Type Analysis
Kinetic turbines remain the anchor of run-of-river deployments in 2025. They account for about 56% of global revenue, supported by low-head, low-flow suitability and shorter civil works. On a 2025 market base of roughly USD 26.8 billion, kinetic solutions represent near USD 15.0 billion. You see the strongest use in Asia Pacific and Europe where repowering and small hydro additions dominate permitting pipelines.
Reaction turbines, including Francis and Kaplan, hold close to 30% of 2025 spend. They fit medium to higher head sites and deliver high efficiencies in the 88–93% range with variable pitch options. Propeller turbines capture about 9–10% where flow variability is limited and costs must be contained. The remainder sits in Crossflow, Pelton, and niche designs used in mountainous micro-sites and retrofit channels. Suppliers scaling these categories include Voith, Andritz, GE Vernova, Dongfang Electric, and Harbin, with digital monitoring and fish-friendly runners now standard specifications.
Capacity Analysis
Small projects up to 10 MW continue to lead in 2025 with about 46% share of new commissioned capacity. Governments favor these assets for community power and faster permitting. Typical CAPEX runs USD 2.0–3.5 million per MW depending on head, access, and environmental measures. You benefit from shorter timelines. Many projects achieve 18–30 months from notice-to-proceed to first power.
Medium systems from 10 to 100 MW contribute around 38–40% in 2025. They serve regional grids and industrial corridors with better economies of scale and firming value. Large projects above 100 MW represent 14–16% and move more slowly due to ecological studies and resettlement risk. Looking ahead to 2030, small assets are set to expand at about 6–7% CAGR, adding 12–14 GW globally, while medium projects track near 5–6% CAGR on grid reinforcement programs and basin-level planning.
End use Analysis
Industrial offtakers remain the dominant end-use segment with about 66–68% share in 2025. Mines, metals, pulp and paper, and agro-processing rely on steady output and long-tenor PPAs that match asset life. Behind-the-meter setups and wheeling contracts reduce exposure to fuel volatility and carbon costs. You secure cost visibility and Scope 2 progress when pairing ROR with demand management.
Residential and commercial users account for the balance. Residential adoption centers on village mini-grids and community hydro with capacity factors in the 30–45% range. Commercial consumption covers campuses, resorts, and municipal facilities that seek stable tariffs and green certificates. Growth in these segments tracks concessional finance, feed-in tariffs, and grid interconnection reforms that trim soft costs by 5–10%.
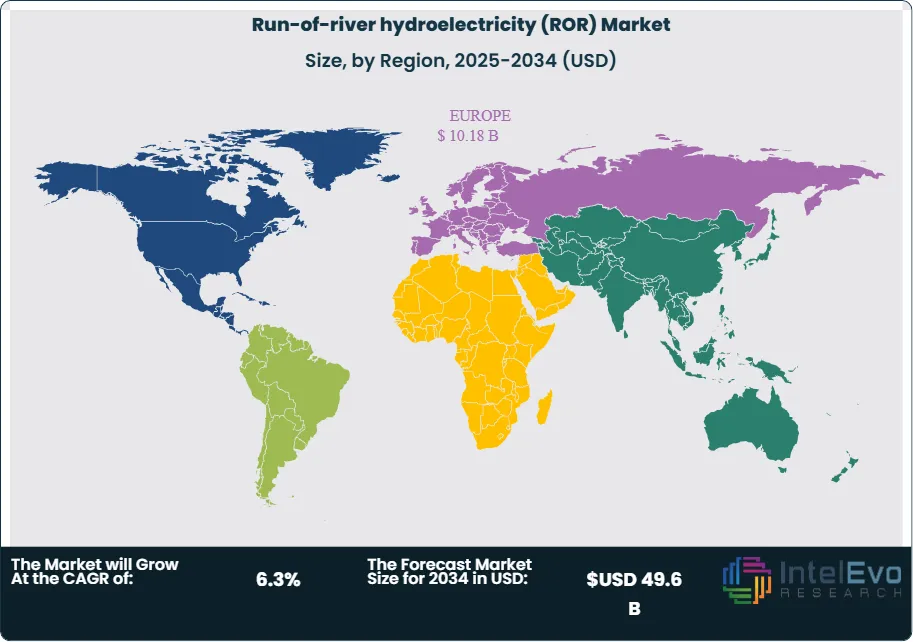
Regional Analysis
Europe continues to command a large share, estimated at 37–38% in 2025, equal to roughly USD 10.0–10.3 billion. Activity concentrates on repowering in the Alps and Nordics and on small schemes across Central and Eastern Europe. Repowering lifts annual energy 3–8% through runner upgrades, variable-speed drives, and digital O&M. Strict biodiversity rules slow greenfield timelines but enhance asset bankability once permitted.
North America holds about 20–22% in 2025, driven by Canadian refurbishments and U.S. relicensing that adds capacity without major new impoundments. Asia Pacific posts the fastest expansion at 7–8% CAGR through 2030. China, India, Nepal, and Southeast Asia are set to add 18–22 GW by 2030 on rural electrification and grid-balancing needs. Latin America grows 5–6% CAGR with opportunities in Colombia, Peru, and Chile under stable PPA frameworks.
The Middle East and Africa remain smaller today but form visible pipelines along the Nile basin, Ethiopian highlands, and East African Rift Rivers. Early projects benefit from blended finance and regional interconnectors. You should watch corridors with proven hydrology, existing transmission, and clear fish passage standards, as these factors shorten development cycles and improve financing terms.
By Turbine Type (Kinetic Turbine, Reaction Turbine, Propeller Turbine, Others), By Capacity (Small, Medium, Large), By End use (Industrial, Residential, Commercial)
Research Methodology
Primary Research- 100 Interviews of Stakeholders
Secondary Research
Desk Research
Regional scope
North America (United States, Canada, Mexico)
Latin America (Brazil, Argentina, Columbia)
East Asia And Pacific (China, Japan, South Korea, Australia, Cambodia, Fiji, Indonesia)
Sea And South Asia (India, Singapore, Thailand, Taiwan, Malaysia)
Eastern Europe (Poland, Russia, Czech Republic, Romania)
Western Europe (Germany, U.K., France, Spain, Itlay)
Middle East & Africa (GCC Countries, Egypt, Nigeria, South Africa, Israel)
Competitive Landscape
Market Key Players, GE Energy, China Three Gorges Corporation, IHI Corporation, Andritz Hydro, Sinohydro Corporation, ABB Ltd, Gerdau S.A., Alstom Hydro, China Hydroelectric Corporation, CPFL Energia S.A.
Customization Scope
Customization for segments, region/country-level will be provided. Moreover, additional customization can be done based on the requirements.
Pricing and Purchase Options
Avail customized purchase options to meet your exact research needs. We have three licenses to opt for: Single User License, Multi-User License (Up to 5 Users), Corporate Use License (Unlimited User and Printable PDF).
TABLE OF CONTENTS
1. EXECUTIVE SUMMARY
1.1. MARKET SNAPSHOT
1.2. KEY FINDINGS & INSIGHTS
1.3. ANALYST RECOMMENDATIONS
1.4. FUTURE OUTLOOK
2. RESEARCH METHODOLOGY
2.1. MARKET DEFINITION & SCOPE
2.2. RESEARCH OBJECTIVES: PRIMARY & SECONDARY DATA SOURCES
2.3. DATA COLLECTION SOURCES
2.3.1. COVERAGE OF 100+ PRIMARY RESEARCH/CONSULTATION CALLS WITH INDUSTRY STAKEHOLDERS
FIGURE 17 NORTH AMERICA RUN-OF-RIVER HYDROELECTRICITY (ROR) CURRENT AND FUTURE TYPE ANALYSIS, 2025–2034, (USD MILLION)
FIGURE 18 NORTH AMERICA RUN-OF-RIVER HYDROELECTRICITY (ROR) CURRENT AND FUTURE END USER ANALYSIS, 2025–2034, (USD MILLION)
FIGURE 19 MARKET SHARE BY COUNTRY
FIGURE 20 LATIN AMERICA RUN-OF-RIVER HYDROELECTRICITY (ROR) CURRENT AND FUTURE TYPE ANALYSIS, 2025–2034, (USD MILLION)
FIGURE 21 LATIN AMERICA RUN-OF-RIVER HYDROELECTRICITY (ROR) CURRENT AND FUTURE END USER ANALYSIS, 2025–2034, (USD MILLION)
FIGURE 22 MARKET SHARE BY COUNTRY
FIGURE 23 EASTERN EUROPE RUN-OF-RIVER HYDROELECTRICITY (ROR) CURRENT AND FUTURE TYPE ANALYSIS, 2025–2034, (USD MILLION)
FIGURE 24 EASTERN EUROPE RUN-OF-RIVER HYDROELECTRICITY (ROR) CURRENT AND FUTURE END USER ANALYSIS, 2025–2034, (USD MILLION)
FIGURE 25 MARKET SHARE BY COUNTRY
FIGURE 26 WESTERN EUROPE RUN-OF-RIVER HYDROELECTRICITY (ROR) CURRENT AND FUTURE TYPE ANALYSIS, 2025–2034, (USD MILLION)
FIGURE 27 WESTERN EUROPE RUN-OF-RIVER HYDROELECTRICITY (ROR) CURRENT AND FUTURE END USER ANALYSIS, 2025–2034, (USD MILLION)
FIGURE 28 MARKET SHARE BY COUNTRY
FIGURE 29 EAST ASIA AND PACIFIC RUN-OF-RIVER HYDROELECTRICITY (ROR) CURRENT AND FUTURE TYPE ANALYSIS, 2025–2034, (USD MILLION)
FIGURE 30 EAST ASIA AND PACIFIC RUN-OF-RIVER HYDROELECTRICITY (ROR) CURRENT AND FUTURE END USER ANALYSIS, 2025–2034, (USD MILLION)
FIGURE 31 MARKET SHARE BY COUNTRY
FIGURE 32 SEA AND SOUTH ASIA RUN-OF-RIVER HYDROELECTRICITY (ROR) CURRENT AND FUTURE TYPE ANALYSIS, 2025–2034, (USD MILLION)
FIGURE 33 SEA AND SOUTH ASIA RUN-OF-RIVER HYDROELECTRICITY (ROR) CURRENT AND FUTURE END USER ANALYSIS, 2025–2034, (USD MILLION)
FIGURE 34 MARKET SHARE BY COUNTRY
FIGURE 35 MIDDLE EAST AND AFRICA RUN-OF-RIVER HYDROELECTRICITY (ROR) CURRENT AND FUTURE TYPE ANALYSIS, 2025–2034, (USD MILLION)
FIGURE 36 MIDDLE EAST AND AFRICA RUN-OF-RIVER HYDROELECTRICITY (ROR) CURRENT AND FUTURE END USER ANALYSIS, 2025–2034, (USD MILLION)
FIGURE 37 NORTH AMERICA RUN-OF-RIVER HYDROELECTRICITY (ROR) CURRENT AND FUTURE MARKET VOLUME SHARE REGIONAL ANALYSIS, 2025–2034, (USD MILLION)
FIGURE 38 U.S. RUN-OF-RIVER HYDROELECTRICITY (ROR) CURRENT AND FUTURE TYPE ANALYSIS, 2025–2034, (USD MILLION)
FIGURE 39 U.S. RUN-OF-RIVER HYDROELECTRICITY (ROR) CURRENT AND FUTURE END USER ANALYSIS, 2025–2034, (USD MILLION)
FIGURE 40 CANADA RUN-OF-RIVER HYDROELECTRICITY (ROR) CURRENT AND FUTURE TYPE ANALYSIS, 2025–2034, (USD MILLION)
FIGURE 41 CANADA RUN-OF-RIVER HYDROELECTRICITY (ROR) CURRENT AND FUTURE END USER ANALYSIS, 2025–2034, (USD MILLION)
FIGURE 42 LATIN AMERICA RUN-OF-RIVER HYDROELECTRICITY (ROR) CURRENT AND FUTURE MARKET VOLUME SHARE REGIONAL ANALYSIS, 2025–2034, (USD MILLION)
FIGURE 43 MEXICO RUN-OF-RIVER HYDROELECTRICITY (ROR) CURRENT AND FUTURE TYPE ANALYSIS, 2025–2034, (USD MILLION)
FIGURE 44 MEXICO RUN-OF-RIVER HYDROELECTRICITY (ROR) CURRENT AND FUTURE END USER ANALYSIS, 2025–2034, (USD MILLION)
FIGURE 45 BRAZIL RUN-OF-RIVER HYDROELECTRICITY (ROR) CURRENT AND FUTURE TYPE ANALYSIS, 2025–2034, (USD MILLION)
FIGURE 46 BRAZIL RUN-OF-RIVER HYDROELECTRICITY (ROR) CURRENT AND FUTURE END USER ANALYSIS, 2025–2034, (USD MILLION)
FIGURE 47 ARGENTINA RUN-OF-RIVER HYDROELECTRICITY (ROR) CURRENT AND FUTURE TYPE ANALYSIS, 2025–2034, (USD MILLION)
FIGURE 48 ARGENTINA RUN-OF-RIVER HYDROELECTRICITY (ROR) CURRENT AND FUTURE END USER ANALYSIS, 2025–2034, (USD MILLION)
FIGURE 49 COLUMBIA RUN-OF-RIVER HYDROELECTRICITY (ROR) CURRENT AND FUTURE TYPE ANALYSIS, 2025–2034, (USD MILLION)
FIGURE 50 COLUMBIA RUN-OF-RIVER HYDROELECTRICITY (ROR) CURRENT AND FUTURE END USER ANALYSIS, 2025–2034, (USD MILLION)
FIGURE 51 REST OF LATIN AMERICA RUN-OF-RIVER HYDROELECTRICITY (ROR) CURRENT AND FUTURE TYPE ANALYSIS, 2025–2034, (USD MILLION)
FIGURE 52 REST OF LATIN AMERICA RUN-OF-RIVER HYDROELECTRICITY (ROR) CURRENT AND FUTURE END USER ANALYSIS, 2025–2034, (USD MILLION)
FIGURE 53 EASTERN EUROPE RUN-OF-RIVER HYDROELECTRICITY (ROR) CURRENT AND FUTURE MARKET VOLUME SHARE REGIONAL ANALYSIS, 2025–2034, (USD MILLION)
FIGURE 54 POLAND RUN-OF-RIVER HYDROELECTRICITY (ROR) CURRENT AND FUTURE TYPE ANALYSIS, 2025–2034, (USD MILLION)
FIGURE 55 POLAND RUN-OF-RIVER HYDROELECTRICITY (ROR) CURRENT AND FUTURE END USER ANALYSIS, 2025–2034, (USD MILLION)
FIGURE 56 RUSSIA RUN-OF-RIVER HYDROELECTRICITY (ROR) CURRENT AND FUTURE TYPE ANALYSIS, 2025–2034, (USD MILLION)
FIGURE 57 RUSSIA RUN-OF-RIVER HYDROELECTRICITY (ROR) CURRENT AND FUTURE END USER ANALYSIS, 2025–2034, (USD MILLION)
FIGURE 58 CZECH REPUBLIC RUN-OF-RIVER HYDROELECTRICITY (ROR) CURRENT AND FUTURE TYPE ANALYSIS, 2025–2034, (USD MILLION)
FIGURE 59 CZECH REPUBLIC RUN-OF-RIVER HYDROELECTRICITY (ROR) CURRENT AND FUTURE END USER ANALYSIS, 2025–2034, (USD MILLION)
FIGURE 60 ROMANIA RUN-OF-RIVER HYDROELECTRICITY (ROR) CURRENT AND FUTURE TYPE ANALYSIS, 2025–2034, (USD MILLION)
FIGURE 61 ROMANIA RUN-OF-RIVER HYDROELECTRICITY (ROR) CURRENT AND FUTURE END USER ANALYSIS, 2025–2034, (USD MILLION)
FIGURE 62 REST OF EASTERN EUROPE RUN-OF-RIVER HYDROELECTRICITY (ROR) CURRENT AND FUTURE TYPE ANALYSIS, 2025–2034, (USD MILLION)
FIGURE 63 REST OF EASTERN EUROPE RUN-OF-RIVER HYDROELECTRICITY (ROR) CURRENT AND FUTURE END USER ANALYSIS, 2025–2034, (USD MILLION)
FIGURE 64 WESTERN EUROPE RUN-OF-RIVER HYDROELECTRICITY (ROR) CURRENT AND FUTURE MARKET VOLUME SHARE REGIONAL ANALYSIS, 2025–2034, (USD MILLION)
FIGURE 65 GERMANY RUN-OF-RIVER HYDROELECTRICITY (ROR) CURRENT AND FUTURE TYPE ANALYSIS, 2025–2034, (USD MILLION)
FIGURE 66 GERMANY RUN-OF-RIVER HYDROELECTRICITY (ROR) CURRENT AND FUTURE END USER ANALYSIS, 2025–2034, (USD MILLION)
FIGURE 67 FRANCE RUN-OF-RIVER HYDROELECTRICITY (ROR) CURRENT AND FUTURE TYPE ANALYSIS, 2025–2034, (USD MILLION)
FIGURE 68 FRANCE RUN-OF-RIVER HYDROELECTRICITY (ROR) CURRENT AND FUTURE END USER ANALYSIS, 2025–2034, (USD MILLION)
FIGURE 69 UK RUN-OF-RIVER HYDROELECTRICITY (ROR) CURRENT AND FUTURE TYPE ANALYSIS, 2025–2034, (USD MILLION)
FIGURE 70 UK RUN-OF-RIVER HYDROELECTRICITY (ROR) CURRENT AND FUTURE END USER ANALYSIS, 2025–2034, (USD MILLION)
FIGURE 71 SPAIN RUN-OF-RIVER HYDROELECTRICITY (ROR) CURRENT AND FUTURE TYPE ANALYSIS, 2025–2034, (USD MILLION)
FIGURE 72 SPAIN RUN-OF-RIVER HYDROELECTRICITY (ROR) CURRENT AND FUTURE END USER ANALYSIS, 2025–2034, (USD MILLION)
FIGURE 73 ITALY RUN-OF-RIVER HYDROELECTRICITY (ROR) CURRENT AND FUTURE TYPE ANALYSIS, 2025–2034, (USD MILLION)
FIGURE 74 ITALY RUN-OF-RIVER HYDROELECTRICITY (ROR) CURRENT AND FUTURE END USER ANALYSIS, 2025–2034, (USD MILLION)
FIGURE 75 REST OF WESTERN EUROPE RUN-OF-RIVER HYDROELECTRICITY (ROR) CURRENT AND FUTURE TYPE ANALYSIS, 2025–2034, (USD MILLION)
FIGURE 76 REST OF WESTERN EUROPE RUN-OF-RIVER HYDROELECTRICITY (ROR) CURRENT AND FUTURE END USER ANALYSIS, 2025–2034, (USD MILLION)
FIGURE 77 EAST ASIA AND PACIFIC RUN-OF-RIVER HYDROELECTRICITY (ROR) CURRENT AND FUTURE MARKET VOLUME SHARE REGIONAL ANALYSIS, 2025–2034, (USD MILLION)
FIGURE 78 CHINA RUN-OF-RIVER HYDROELECTRICITY (ROR) CURRENT AND FUTURE TYPE ANALYSIS, 2025–2034, (USD MILLION)
FIGURE 79 CHINA RUN-OF-RIVER HYDROELECTRICITY (ROR) CURRENT AND FUTURE END USER ANALYSIS, 2025–2034, (USD MILLION)
FIGURE 80 JAPAN RUN-OF-RIVER HYDROELECTRICITY (ROR) CURRENT AND FUTURE TYPE ANALYSIS, 2025–2034, (USD MILLION)
FIGURE 81 JAPAN RUN-OF-RIVER HYDROELECTRICITY (ROR) CURRENT AND FUTURE END USER ANALYSIS, 2025–2034, (USD MILLION)
FIGURE 82 AUSTRALIA RUN-OF-RIVER HYDROELECTRICITY (ROR) CURRENT AND FUTURE TYPE ANALYSIS, 2025–2034, (USD MILLION)
FIGURE 83 AUSTRALIA RUN-OF-RIVER HYDROELECTRICITY (ROR) CURRENT AND FUTURE END USER ANALYSIS, 2025–2034, (USD MILLION)
FIGURE 84 CAMBODIA RUN-OF-RIVER HYDROELECTRICITY (ROR) CURRENT AND FUTURE TYPE ANALYSIS, 2025–2034, (USD MILLION)
FIGURE 85 CAMBODIA RUN-OF-RIVER HYDROELECTRICITY (ROR) CURRENT AND FUTURE END USER ANALYSIS, 2025–2034, (USD MILLION)
FIGURE 86 FIJI RUN-OF-RIVER HYDROELECTRICITY (ROR) CURRENT AND FUTURE TYPE ANALYSIS, 2025–2034, (USD MILLION)
FIGURE 87 FIJI RUN-OF-RIVER HYDROELECTRICITY (ROR) CURRENT AND FUTURE END USER ANALYSIS, 2025–2034, (USD MILLION)
FIGURE 88 INDONESIA RUN-OF-RIVER HYDROELECTRICITY (ROR) CURRENT AND FUTURE TYPE ANALYSIS, 2025–2034, (USD MILLION)
FIGURE 89 INDONESIA RUN-OF-RIVER HYDROELECTRICITY (ROR) CURRENT AND FUTURE END USER ANALYSIS, 2025–2034, (USD MILLION)
FIGURE 90 SOUTH KOREA RUN-OF-RIVER HYDROELECTRICITY (ROR) CURRENT AND FUTURE TYPE ANALYSIS, 2025–2034, (USD MILLION)
FIGURE 91 SOUTH KOREA RUN-OF-RIVER HYDROELECTRICITY (ROR) CURRENT AND FUTURE END USER ANALYSIS, 2025–2034, (USD MILLION)
FIGURE 92 REST OF EAST ASIA AND PACIFIC RUN-OF-RIVER HYDROELECTRICITY (ROR) CURRENT AND FUTURE TYPE ANALYSIS, 2025–2034, (USD MILLION)
FIGURE 93 REST OF EAST ASIA AND PACIFIC RUN-OF-RIVER HYDROELECTRICITY (ROR) CURRENT AND FUTURE END USER ANALYSIS, 2025–2034, (USD MILLION)
FIGURE 94 SEA AND SOUTH ASIA RUN-OF-RIVER HYDROELECTRICITY (ROR) CURRENT AND FUTURE MARKET VOLUME SHARE REGIONAL ANALYSIS, 2025–2034, (USD MILLION)
FIGURE 95 BANGLADESH RUN-OF-RIVER HYDROELECTRICITY (ROR) CURRENT AND FUTURE TYPE ANALYSIS, 2025–2034, (USD MILLION)
FIGURE 96 BANGLADESH RUN-OF-RIVER HYDROELECTRICITY (ROR) CURRENT AND FUTURE END USER ANALYSIS, 2025–2034, (USD MILLION)
FIGURE 97 NEW ZEALAND RUN-OF-RIVER HYDROELECTRICITY (ROR) CURRENT AND FUTURE TYPE ANALYSIS, 2025–2034, (USD MILLION)
FIGURE 98 NEW ZEALAND RUN-OF-RIVER HYDROELECTRICITY (ROR) CURRENT AND FUTURE END USER ANALYSIS, 2025–2034, (USD MILLION)
FIGURE 99 INDIA RUN-OF-RIVER HYDROELECTRICITY (ROR) CURRENT AND FUTURE TYPE ANALYSIS, 2025–2034, (USD MILLION)
FIGURE 100 INDIA RUN-OF-RIVER HYDROELECTRICITY (ROR) CURRENT AND FUTURE END USER ANALYSIS, 2025–2034, (USD MILLION)
FIGURE 101 SINGAPORE RUN-OF-RIVER HYDROELECTRICITY (ROR) CURRENT AND FUTURE TYPE ANALYSIS, 2025–2034, (USD MILLION)
FIGURE 102 SINGAPORE RUN-OF-RIVER HYDROELECTRICITY (ROR) CURRENT AND FUTURE END USER ANALYSIS, 2025–2034, (USD MILLION)
FIGURE 103 THAILAND RUN-OF-RIVER HYDROELECTRICITY (ROR) CURRENT AND FUTURE TYPE ANALYSIS, 2025–2034, (USD MILLION)
FIGURE 104 THAILAND RUN-OF-RIVER HYDROELECTRICITY (ROR) CURRENT AND FUTURE END USER ANALYSIS, 2025–2034, (USD MILLION)
FIGURE 105 TAIWAN RUN-OF-RIVER HYDROELECTRICITY (ROR) CURRENT AND FUTURE TYPE ANALYSIS, 2025–2034, (USD MILLION)
FIGURE 106 TAIWAN RUN-OF-RIVER HYDROELECTRICITY (ROR) CURRENT AND FUTURE END USER ANALYSIS, 2025–2034, (USD MILLION)
FIGURE 107 MALAYSIA RUN-OF-RIVER HYDROELECTRICITY (ROR) CURRENT AND FUTURE TYPE ANALYSIS, 2025–2034, (USD MILLION)
FIGURE 108 MALAYSIA RUN-OF-RIVER HYDROELECTRICITY (ROR) CURRENT AND FUTURE END USER ANALYSIS, 2025–2034, (USD MILLION)
FIGURE 109 REST OF SEA AND SOUTH ASIA RUN-OF-RIVER HYDROELECTRICITY (ROR) CURRENT AND FUTURE TYPE ANALYSIS, 2025–2034, (USD MILLION)
FIGURE 110 REST OF SEA AND SOUTH ASIA RUN-OF-RIVER HYDROELECTRICITY (ROR) CURRENT AND FUTURE END USER ANALYSIS, 2025–2034, (USD MILLION)
FIGURE 111 MIDDLE EAST AND AFRICA RUN-OF-RIVER HYDROELECTRICITY (ROR) CURRENT AND FUTURE MARKET VOLUME SHARE REGIONAL ANALYSIS, 2025–2034, (USD MILLION)
FIGURE 112 GCC COUNTRIES RUN-OF-RIVER HYDROELECTRICITY (ROR) CURRENT AND FUTURE TYPE ANALYSIS, 2025–2034, (USD MILLION)
FIGURE 113 GCC COUNTRIES RUN-OF-RIVER HYDROELECTRICITY (ROR) CURRENT AND FUTURE END USER ANALYSIS, 2025–2034, (USD MILLION)
FIGURE 114 SAUDI ARABIA RUN-OF-RIVER HYDROELECTRICITY (ROR) CURRENT AND FUTURE TYPE ANALYSIS, 2025–2034, (USD MILLION)
FIGURE 115 SAUDI ARABIA RUN-OF-RIVER HYDROELECTRICITY (ROR) CURRENT AND FUTURE END USER ANALYSIS, 2025–2034, (USD MILLION)
FIGURE 116 UAE RUN-OF-RIVER HYDROELECTRICITY (ROR) CURRENT AND FUTURE TYPE ANALYSIS, 2025–2034, (USD MILLION)
FIGURE 117 UAE RUN-OF-RIVER HYDROELECTRICITY (ROR) CURRENT AND FUTURE END USER ANALYSIS, 2025–2034, (USD MILLION)
FIGURE 118 BAHRAIN RUN-OF-RIVER HYDROELECTRICITY (ROR) CURRENT AND FUTURE TYPE ANALYSIS, 2025–2034, (USD MILLION)
FIGURE 119 BAHRAIN RUN-OF-RIVER HYDROELECTRICITY (ROR) CURRENT AND FUTURE END USER ANALYSIS, 2025–2034, (USD MILLION)
FIGURE 120 KUWAIT RUN-OF-RIVER HYDROELECTRICITY (ROR) CURRENT AND FUTURE TYPE ANALYSIS, 2025–2034, (USD MILLION)
FIGURE 121 KUWAIT RUN-OF-RIVER HYDROELECTRICITY (ROR) CURRENT AND FUTURE END USER ANALYSIS, 2025–2034, (USD MILLION)
FIGURE 122 OMAN RUN-OF-RIVER HYDROELECTRICITY (ROR) CURRENT AND FUTURE TYPE ANALYSIS, 2025–2034, (USD MILLION)
FIGURE 123 OMAN RUN-OF-RIVER HYDROELECTRICITY (ROR) CURRENT AND FUTURE END USER ANALYSIS, 2025–2034, (USD MILLION)
FIGURE 124 QATAR RUN-OF-RIVER HYDROELECTRICITY (ROR) CURRENT AND FUTURE TYPE ANALYSIS, 2025–2034, (USD MILLION)
FIGURE 125 QATAR RUN-OF-RIVER HYDROELECTRICITY (ROR) CURRENT AND FUTURE END USER ANALYSIS, 2025–2034, (USD MILLION)
FIGURE 126 EGYPT RUN-OF-RIVER HYDROELECTRICITY (ROR) CURRENT AND FUTURE TYPE ANALYSIS, 2025–2034, (USD MILLION)
FIGURE 127 EGYPT RUN-OF-RIVER HYDROELECTRICITY (ROR) CURRENT AND FUTURE END USER ANALYSIS, 2025–2034, (USD MILLION)
FIGURE 128 NIGERIA RUN-OF-RIVER HYDROELECTRICITY (ROR) CURRENT AND FUTURE TYPE ANALYSIS, 2025–2034, (USD MILLION)
FIGURE 129 NIGERIA RUN-OF-RIVER HYDROELECTRICITY (ROR) CURRENT AND FUTURE END USER ANALYSIS, 2025–2034, (USD MILLION)
FIGURE 130 SOUTH AFRICA RUN-OF-RIVER HYDROELECTRICITY (ROR) CURRENT AND FUTURE TYPE ANALYSIS, 2025–2034, (USD MILLION)
FIGURE 131 SOUTH AFRICA RUN-OF-RIVER HYDROELECTRICITY (ROR) CURRENT AND FUTURE END USER ANALYSIS, 2025–2034, (USD MILLION)
FIGURE 132 ISRAEL RUN-OF-RIVER HYDROELECTRICITY (ROR) CURRENT AND FUTURE TYPE ANALYSIS, 2025–2034, (USD MILLION)
FIGURE 133 ISRAEL RUN-OF-RIVER HYDROELECTRICITY (ROR) CURRENT AND FUTURE END USER ANALYSIS, 2025–2034, (USD MILLION)
FIGURE 134 REST OF MEA RUN-OF-RIVER HYDROELECTRICITY (ROR) CURRENT AND FUTURE TYPE ANALYSIS, 2025–2034, (USD MILLION)
FIGURE 135 REST OF MEA RUN-OF-RIVER HYDROELECTRICITY (ROR) CURRENT AND FUTURE END USER ANALYSIS, 2025–2034, (USD MILLION)
FIGURE 136 U. S. MARKET SHARE ANALYSIS BY TYPE (2024)
FIGURE 137 U. S. MARKET SHARE ANALYSIS BY END USER (2024)
FIGURE 138 CANADA MARKET SHARE ANALYSIS BY TYPE (2024)
FIGURE 139 CANADA MARKET SHARE ANALYSIS BY END USER (2024)
FIGURE 140 MEXICO MARKET SHARE ANALYSIS BY TYPE (2024)
FIGURE 141 MEXICO MARKET SHARE ANALYSIS BY END USER (2024)
FIGURE 142 CHINA MARKET SHARE ANALYSIS BY TYPE (2024)
FIGURE 143 CHINA MARKET SHARE ANALYSIS BY END USER (2024)
FIGURE 144 JAPAN MARKET SHARE ANALYSIS BY TYPE (2024)
FIGURE 145 JAPAN MARKET SHARE ANALYSIS BY END USER (2024)
FIGURE 146 INDIA MARKET SHARE ANALYSIS BY TYPE (2024)
FIGURE 147 INDIA MARKET SHARE ANALYSIS BY END USER (2024)
FIGURE 148 SOUTH KOREA MARKET SHARE ANALYSIS BY TYPE (2024)
FIGURE 149 SOUTH KOREA MARKET SHARE ANALYSIS BY END USER (2024)
FIGURE 150 SAUDI ARABIA MARKET SHARE ANALYSIS BY TYPE (2024)
FIGURE 151 SAUDI ARABIA MARKET SHARE ANALYSIS BY END USER (2024)
FIGURE 152 UAE MARKET SHARE ANALYSIS BY TYPE (2024)
FIGURE 153 UAE MARKET SHARE ANALYSIS BY END USER (2024)
FIGURE 154 EGYPT MARKET SHARE ANALYSIS BY TYPE (2024)
FIGURE 155 EGYPT MARKET SHARE ANALYSIS BY END USER (2024)
FIGURE 156 NIGERIA MARKET SHARE ANALYSIS BY TYPE (2024)
FIGURE 157 NIGERIA MARKET SHARE ANALYSIS BY END USER (2024)
FIGURE 158 SOUTH AFRICA MARKET SHARE ANALYSIS BY TYPE (2024)
FIGURE 159 SOUTH AFRICA MARKET SHARE ANALYSIS BY END USER (2024)
FIGURE 160 GERMANY MARKET SHARE ANALYSIS BY TYPE (2024)
FIGURE 161 GERMANY MARKET SHARE ANALYSIS BY END USER (2024)
FIGURE 162 FRANCE MARKET SHARE ANALYSIS BY TYPE (2024)
FIGURE 163 FRANCE MARKET SHARE ANALYSIS BY END USER (2024)
FIGURE 164 UK MARKET SHARE ANALYSIS BY TYPE (2024)
FIGURE 165 UK MARKET SHARE ANALYSIS BY END USER (2024)
FIGURE 166 SPAIN MARKET SHARE ANALYSIS BY TYPE (2024)
FIGURE 167 SPAIN MARKET SHARE ANALYSIS BY END USER (2024)
FIGURE 168 ITALY MARKET SHARE ANALYSIS BY TYPE (2024)
FIGURE 169 ITALY MARKET SHARE ANALYSIS BY END USER (2024)
FIGURE 170 BRAZIL MARKET SHARE ANALYSIS BY TYPE (2024)
FIGURE 171 BRAZIL MARKET SHARE ANALYSIS BY END USER (2024)
FIGURE 172 ARGENTINA MARKET SHARE ANALYSIS BY TYPE (2024)
FIGURE 173 ARGENTINA MARKET SHARE ANALYSIS BY END USER (2024)
FIGURE 174 COLUMBIA MARKET SHARE ANALYSIS BY TYPE (2024)
FIGURE 175 COLUMBIA MARKET SHARE ANALYSIS BY END USER (2024)
FIGURE 176 GLOBAL RUN-OF-RIVER HYDROELECTRICITY (ROR) CURRENT AND FUTURE MARKET KEY COUNTRY LEVEL ANALYSIS, 2024–2034, (USD MILLION)
FIGURE 177 FINANCIAL OVERVIEW:
Key Player Analysis
ABB Ltd: ABB is positioned as a leader in hydropower modernization through electrification, automation, and lifecycle services, strengthened by a new hydroelectric generator refurbishment line in Bilbao that targets Europe’s aging installed base of about 260 GW and supports customers in Spain and Norway already under order. The Bilbao line addresses 30‑year lifecycle replacement needs and aims to reduce power losses via new stators and advanced insulation systems, improving operational efficiency for run-of-river and small hydro plants that require rapid upgrade cycles. Strategically, ABB is extending into hydro-adjacent energy vectors; a 2025 agreement with Charbone Hydrogen connects hydroelectric grid supply to green hydrogen production in North America, aligning with grid‑to‑H2 use cases relevant for basin-level balancing and industrial customers. ABB also broadened its power electronics portfolio with the acquisition of BrightLoop in 2025 to deliver compact, rugged power conversion, a differentiator for plant retrofits and grid interface upgrades in hydro sites.
Alstom Hydro: Alstom Hydro is a legacy portfolio now embedded within GE following GE’s 2015 acquisition of Alstom’s power and grid businesses; Alstom subsequently refocused on rail transport, leaving hydro technology and installed base support within GE’s energy platform. In 2025, the hydro-relevant successor organization operates inside GE Vernova, which reported strong third‑quarter orders and backlog growth, indicating continued demand for equipment and services across power and grid that includes refurbishment and controls relevant to hydro fleets originating from Alstom technology. This structure positions the Alstom Hydro legacy as part of a larger OEM platform with scale advantages in execution, digital asset performance, and grid integration that matter for run‑of‑river uprates and repowering.
Andritz Hydro: Andritz Hydro is a leader with clear momentum; Hydropower order intake reached 2,170.5 MEUR in 2024, up 7.4% year over year, with Q4 Hydropower orders surging to 941.6 MEUR, up 54% on large equipment awards that underpin a robust multi‑year backlog. Hydropower revenue was 1,537.9 MEUR in 2024, up 1.1%, while the Group’s service mix rose to 41% of revenue, improving resilience and margins across turbine upgrades, controls, and O&M that directly support run‑of‑river availability and output. In the first half of 2025, Hydropower order intake more than doubled in Q2 to 776.5 MEUR on large capital orders in Asia, and guidance indicates stable revenue with comparable EBITA margin targeted at 8.6% to 9.0%, reinforcing execution capacity for uprates and small hydro rollouts through 2025–2026.
China Hydroelectric Corporation: China Hydroelectric Corporation is a niche owner‑operator focused on small hydro portfolios in China; as of its last broad public disclosure era, it controlled more than 500 MW across provinces including Zhejiang, Fujian, Yunnan, and Sichuan, indicating strong exposure to basins suited for run‑of‑river schemes. The company went private in 2014 via a merger with affiliates of NewQuest Capital Partners, and has limited public reporting since, positioning it as a private consolidator in regional small hydro with an operating rather than OEM profile. The operating backdrop in China remains sizable; hydro industry revenue is estimated near USD 58.8 billion in 2025 with a five‑year CAGR around 3.9%, offering a stable context for private portfolios to pursue incremental uprates, digital O&M, and grid support services within provincial frameworks.
Market Key Players
GE Energy
China Three Gorges Corporation
IHI Corporation
Andritz Hydro
Sinohydro Corporation
ABB Ltd
Gerdau S.A.
Alstom Hydro
China Hydroelectric Corporation
CPFL Energia S.A.
Driver
Decarbonization Targets and Grid Reliability Fuel Run-of-River Expansion
As of 2025, run-of-river (ROR) hydropower is expanding on the back of firm decarbonization mandates and rising grid-reliability needs. The market is valued near USD 27 billion and is tracking a 5.5–6.0% CAGR through 2033, supported by stable capacity factors of 30–55% and competitive levelized costs ranging from USD 45–110 per MWh depending on site characteristics. Carbon pricing in key markets and volatile natural gas costs further strengthen project economics, sustaining investment momentum.
Bankable Revenues and System Value Strengthen the Investment Case
ROR projects benefit from long-tenor power purchase agreements and regulated tariff frameworks that deliver predictable cash flows. Beyond energy generation, these assets contribute inertia and voltage support, increasing their system value as solar and wind penetration rises. Equipment suppliers report growing demand for low-head turbines and fish-friendly designs that align with permitting requirements, reinforcing confidence in the near-term development pipeline across Asia and North America.
Restraint
Permitting Delays and Hydrology Risk Slow Project Timelines
Permitting complexity and hydrological variability remain key constraints. In many OECD markets, environmental approvals and licensing can extend 4–7 years, while interconnection queues may add another 2–4 years. Multi-year droughts can reduce annual output by 5–10%, tightening debt service coverage and limiting leverage for new projects.
Rising Costs and Biodiversity Requirements Pressure Returns
Inflation has lifted EPC costs by 8–12% compared with 2021 levels, and higher interest rates have increased project weighted average cost of capital by 150–250 basis points since 2022. At the same time, stricter biodiversity rules require fish passage, sediment management, and environmental flow releases, which can reduce dispatchable output by 2–5%. These factors increasingly steer developers away from greenfield builds toward lower-risk alternatives.
Opportunity
Repowering and Uprates Deliver Fast, Capital-Efficient Growth
Repowering existing assets represents the most attractive near-term opportunity. Runner upgrades, variable-speed generators, and digital control retrofits can increase annual energy production by 5–12% at just 20–40% of the capital cost of greenfield projects. The repowering pipeline through 2030 is estimated at USD 10–12 billion in Europe and North America alone, with project timelines compressed to 12–24 months.
Emerging Markets and Corporate PPAs Expand the Addressable Base
Emerging regions—including East Africa, the Himalayas, and the Andes—offer significant potential for small ROR plants integrated with mini-grids and corridor developments. Prospect-stage capacity of 6–8 GW is expected through 2030, often supported by blended finance structures. At the same time, corporate PPAs from energy-intensive industries and data centers are growing at 15–20% annually, creating demand for ROR and hybrid configurations that improve evening supply reliability.
Trend
Digitalization Improves Output, Availability, and Asset Life
Digital operations are transitioning from pilot projects to standard practice. AI-based inflow forecasting is adding 1–3% to annual energy output while reducing spill events, and condition-based maintenance programs are cutting unplanned downtime by 10–15%. Turbine suppliers increasingly bundle sensors, edge controls, and remote monitoring platforms into core contracts, embedding digital performance optimization from commissioning onward.
Eco-Design and Green Finance Shape Future Development
Environmental design innovation is accelerating adoption. Fish-friendly runners and nature-like fishways improve passage rates and shorten permitting cycles, while variable-speed units raise part-load efficiency by 1–2 percentage points. Financing trends mirror these shifts, with green bonds and sustainability-linked loans for small hydro and repowering projects rising an estimated 20–25% year over year in 2024–2025, lowering funding costs for projects that demonstrate measurable ecological and reliability benefits.
Recent Developments
Dec 2024 - ABB: ABB agreed to acquire the power electronics business of Gamesa Electric from Siemens Gamesa, adding €170 million in annual revenue and expanding its serviceable installed base by 40 GW in power conversion for renewables. Strategic impact: broadens ABB’s converter and grid-interface portfolio for hydro retrofits and accelerates modernization programs across Europe and the Americas.
Dec 2024 - ANDRITZ Hydro: ANDRITZ was selected by COPEL to refurbish and modernize the Governador Parigot de Souza hydropower plant in Brazil, covering turbine-generator rehabilitation and key balance-of-plant systems. Strategic impact: deepens ANDRITZ’s Latin America refurbishment backlog and extends asset life for run-of-river fleets under tightening reliability requirements.
Jan 2025 - ANDRITZ Hydro: ANDRITZ won a contract to supply two 55 MW Pelton units, automation, and auxiliaries for the new Øksenelvane plant in Norway, raising expected annual output to 171 GWh, up 21 GWh versus the legacy facility. Strategic impact: strengthens Nordic positioning in high-head replacements and adds bankable performance gains for future uprates.
Jun 2025 - Voith Hydro: Voith and HeiTech secured a multi‑million‑euro order to modernize three TNB Genco stations in Malaysia, including turbine‑generator overhauls and automation, with Temengor projected to lift output by about 15% post‑upgrade. Strategic impact: expands Voith’s Southeast Asia footprint and demonstrates measurable yield improvements that support utility investment cases.
Jun 2025 - GE Vernova Hydro: GE Vernova won a modernization program for eight turbine‑alternator units at Rio Tinto’s Isle‑Maligne facility in Quebec, with implementation scheduled from 2026 to 2032 following a pilot upgrade. Strategic impact: locks in multi‑year services revenue and reinforces GE Vernova’s leadership in industrial offtaker hydropower upgrades across North America.
Sep 2025 - ABB: ABB opened a hydroelectric generator production and refurbishment line at its Ring Motor Factory in Spain to deploy new stator technologies and reduce losses across Europe’s aging hydro fleet. Strategic impact: adds regional manufacturing capacity and shortens overhaul lead times for run‑of‑river repowering and reliability improvements.