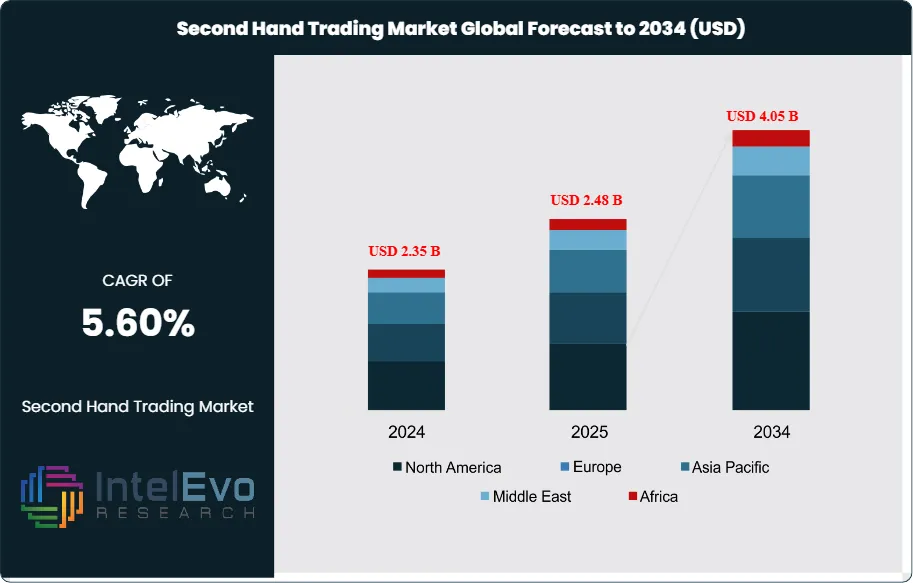
The Second-Hand Trading Platform Market is estimated at USD 2.35 billion in 2024 and is projected to reach approximately USD 4.05 billion by 2034, registering a CAGR of about 5.6% during 2025–2034. Market expansion is being driven by a sustained shift toward value-conscious consumption, inflation-sensitive household spending, and rising preference for circular economy models. Growth is increasingly platform-led, with digital marketplaces capturing the majority of incremental transactions due to mobile-first access, secure payments, and scalable logistics integration.
Consumer participation is broad and deepening. In the United States, around 44% of consumers report buying or selling a pre-owned item online in the past year. The environmental impact further reinforces adoption: reuse activity has enabled avoidance of more than 20 million tonnes of CO₂ emissions, alongside substantial reductions in plastic and steel consumption. These economic and sustainability benefits are strengthening consumer and policy support for second-hand trade across apparel, books, and consumer electronics—the highest-frequency categories by transaction volume.
High-value segments are also scaling. Automobiles, furniture, and luxury goods contribute meaningful gross merchandise value through verified sellers, consignment models, and authentication-led listings. Platforms increasingly deploy AI-driven search, image recognition, and condition grading tools to improve discovery and pricing accuracy. Dynamic pricing engines and personalized recommendations are lifting conversion rates, while escrow services, buyer protection, KYC checks, and device IMEI validation are improving trust and reducing fraud.
From a monetization perspective, marketplace take rates typically range between 8% and 15%, with additional revenue generated from authentication, refurbishment, logistics, and promoted listings. However, growth remains sensitive to execution. Key friction points include counterfeit risk, reverse logistics costs, dispute resolution, and fragmented sales tax or VAT regimes across regions. Liquidity depth, product quality assurance, and efficient returns management will remain decisive factors for sustained platform scalability.
Regionally, North America and Western Europe account for an estimated 60–65% of global turnover, supported by mature resale ecosystems and strong consumer trust. Asia Pacific is the fastest-growing region, with several markets expected to post 7–9% CAGR through the early 2030s, driven by smartphone penetration and digital payment adoption in India and Southeast Asia. Latin America and parts of the Middle East are also seeing rising volumes, particularly in general merchandise and refurbished electronics. For investors, priority themes include authentication-led luxury resale in Europe, certified electronics refurbishment in APAC, and C2C-to-B2C migration on large horizontal marketplaces. Near-term performance should be tracked through supply quality metrics, dispute rates, and customer acquisition costs as indicators of platform resilience.
Key Takeaways
Market Growth: The market was valued at USD 2.35 billion in 2024 and is set to reach USD 4.05 billion by 2034, reflecting a 5.6% CAGR driven by value-seeking consumers and sustainability-led demand. Growth concentrates in fashion, electronics, furniture, and autos as online platforms scale secure payments and category breadth.
Type: B2C leads with 57.5% share due to authentication, quality assurance, and higher consumer trust versus peer-to-peer models. Retailer participation for overstock, returns, and refurbishment further concentrates volume on managed B2C formats.
Application: Personal use dominates with 61.4% as individuals increasingly buy and resell items directly across everyday categories. Mobile-first UX, advanced search, and community features strengthen engagement and repeat activity.
Driver: Sustainability and affordability are pulling new users into resale; 44% of U.S. consumers traded a pre-owned item online in the past year. AI recommendations, authentication tools, and secure payments are improving discovery and trust at scale.
Restraint: Regulatory complexity spanning product safety, taxation, and cross-border rules raises compliance costs and slows scaling for smaller platforms. Lower-trust C2C remains the minority at an implied 42.5% share versus 57.5% for B2C, reflecting liability and quality-assurance frictions
Opportunity: Asia Pacific’s 36.5% share and rapid e-commerce and digital payment adoption create headroom for certified electronics and fashion resale plays. You can target authentication and refurbishment services to lift conversion and reduce disputes in high-velocity categories.
Trend: Alibaba’s Idle Fish surpassed 1 billion yuan in daily GMV in 2023, signaling the scale achievable in managed community resale. Platforms are piloting AI authentication, blockchain tracking, and automated pricing to boost credibility and transaction speed
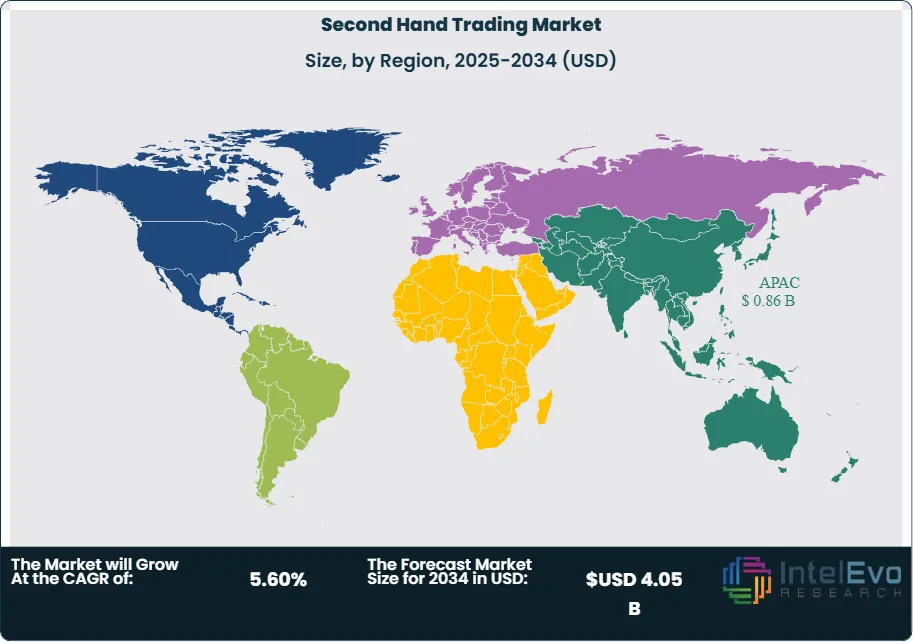
Regional Analysis: Asia Pacific leads at 36.5% or roughly USD 0.438 billion, supported by large user bases, mobile connectivity, and circular-economy momentum. North America and Europe remain significant on strong e-commerce infrastructure, while MEA and Latin America are emerging as access and acceptance improve.
Type Analysis
The market divides into Consumer-to-Consumer and Business-to-Consumer models, with B2C accounting for 57.5% of revenue as of 2023 due to stronger trust, buyer protections, and consistent product quality versus informal peer trade. Established marketplaces and large e-commerce operators drive this lead by curating listings across apparel, electronics, furniture, and vehicles while standardizing payments and pricing for scale. Authentication features, secure payments, and transparent policies keep conversion rates higher in B2C settings as the sector targets steady growth through 2033 at a 5.3% CAGR.
C2C remains essential for liquidity and assortment breadth, especially in long-tail categories where individual sellers offer unique or discontinued items at attractive prices. AI-driven recommendations and improved search streamline discovery for C2C buyers, while identity checks and dispute processes gradually close the trust gap with B2C channels. You should expect C2C to sustain volume in everyday goods as platforms blend peer listings with managed services to maintain user engagement.
Application Analysis
The application split centers on Personal and Merchant use, with Personal accounting for 61.4% of activity as individuals buy and resell items for value and sustainability gains. Mobile-first experiences, recommendation engines, and reliable checkout increase repeat behavior among Personal users across apparel, books, and consumer electronics. This cohort underpins liquidity and drives frequent listings that support marketplace flywheels in 2025 and beyond.
Merchant participation broadens supply in core categories and raises average order values through refurbished and graded inventory. Business sellers benefit from structured pricing and integrated payments that reduce friction and expand reach to value-seeking and environmentally conscious buyers. You can use Merchant listings to stabilize availability in high-velocity SKUs and improve customer satisfaction through consistent service levels.
End-Use Analysis
Consumer households remain the primary end users, fueling demand for affordable fashion, consumer electronics, and home goods as platforms standardize payments and improve price transparency. Engagement rises when discovery is simple and trust signals are clear, which is reinforced by AI recommendations and buyer protection features. This end-use will keep expanding as sustainability and cost control sharpen household purchase criteria through 2033.
Small and midsize sellers use these platforms to monetize returns, discontinued lines, and excess inventory while tapping ready demand pools across regions. Consistent policies and secure checkouts reduce operational overhead for professional sellers and improve sell-through rates over time. Larger retailers and brands add verified channels that lift confidence for higher-value goods such as premium electronics, furniture, and vehicles.
Regional Analysis
Asia Pacific leads with 36.5% share, or about USD 0.438 billion in 2023, supported by rapid urbanization, high mobile internet usage, and strong value-seeking behavior among large consumer bases. Local platforms and regional e-commerce leaders scale second-hand trade as payments and logistics mature across markets such as China and India. You should expect APAC to remain the growth anchor as user adoption and category depth widen.
North America and Europe contribute significant revenue on robust e-commerce infrastructure and policy momentum that favors reuse and circular consumption. Established platforms expand category coverage and refine AI-driven discovery to improve buyer experience and trust. These regions will post steady growth as sustainability preferences align with budget-conscious purchasing.
Latin America and the Middle East and Africa are emerging opportunity zones as connectivity improves and acceptance of second-hand purchasing rises. General merchandise and electronics gain first as marketplaces build localized supply and payments. Watch these regions for faster penetration in mobile-led segments where affordability is a core buying trigger.
Customization for segments, region/country-level will be provided. Moreover, additional customization can be done based on the requirements.
Pricing and Purchase Options
Avail customized purchase options to meet your exact research needs. We have three licenses to opt for: Single User License, Multi-User License (Up to 5 Users), Corporate Use License (Unlimited User and Printable PDF).
TABLE OF CONTENTS
1. EXECUTIVE SUMMARY
1.1. MARKET SNAPSHOT
1.2. KEY FINDINGS & INSIGHTS
1.3. ANALYST RECOMMENDATIONS
1.4. FUTURE OUTLOOK
2. RESEARCH METHODOLOGY
2.1. MARKET DEFINITION & SCOPE
2.2. RESEARCH OBJECTIVES: PRIMARY & SECONDARY DATA SOURCES
2.3. DATA COLLECTION SOURCES
2.3.1. COVERAGE OF 100+ PRIMARY RESEARCH/CONSULTATION CALLS WITH INDUSTRY STAKEHOLDERS
FIGURE 17 NORTH AMERICA SECOND HAND TRADING CURRENT AND FUTURE TYPE ANALYSIS, 2025–2034, (USD MILLION)
FIGURE 18 NORTH AMERICA SECOND HAND TRADING CURRENT AND FUTURE END USER ANALYSIS, 2025–2034, (USD MILLION)
FIGURE 19 MARKET SHARE BY COUNTRY
FIGURE 20 LATIN AMERICA SECOND HAND TRADING CURRENT AND FUTURE TYPE ANALYSIS, 2025–2034, (USD MILLION)
FIGURE 21 LATIN AMERICA SECOND HAND TRADING CURRENT AND FUTURE END USER ANALYSIS, 2025–2034, (USD MILLION)
FIGURE 22 MARKET SHARE BY COUNTRY
FIGURE 23 EASTERN EUROPE SECOND HAND TRADING CURRENT AND FUTURE TYPE ANALYSIS, 2025–2034, (USD MILLION)
FIGURE 24 EASTERN EUROPE SECOND HAND TRADING CURRENT AND FUTURE END USER ANALYSIS, 2025–2034, (USD MILLION)
FIGURE 25 MARKET SHARE BY COUNTRY
FIGURE 26 WESTERN EUROPE SECOND HAND TRADING CURRENT AND FUTURE TYPE ANALYSIS, 2025–2034, (USD MILLION)
FIGURE 27 WESTERN EUROPE SECOND HAND TRADING CURRENT AND FUTURE END USER ANALYSIS, 2025–2034, (USD MILLION)
FIGURE 28 MARKET SHARE BY COUNTRY
FIGURE 29 EAST ASIA AND PACIFIC SECOND HAND TRADING CURRENT AND FUTURE TYPE ANALYSIS, 2025–2034, (USD MILLION)
FIGURE 30 EAST ASIA AND PACIFIC SECOND HAND TRADING CURRENT AND FUTURE END USER ANALYSIS, 2025–2034, (USD MILLION)
FIGURE 31 MARKET SHARE BY COUNTRY
FIGURE 32 SEA AND SOUTH ASIA SECOND HAND TRADING CURRENT AND FUTURE TYPE ANALYSIS, 2025–2034, (USD MILLION)
FIGURE 33 SEA AND SOUTH ASIA SECOND HAND TRADING CURRENT AND FUTURE END USER ANALYSIS, 2025–2034, (USD MILLION)
FIGURE 34 MARKET SHARE BY COUNTRY
FIGURE 35 MIDDLE EAST AND AFRICA SECOND HAND TRADING CURRENT AND FUTURE TYPE ANALYSIS, 2025–2034, (USD MILLION)
FIGURE 36 MIDDLE EAST AND AFRICA SECOND HAND TRADING CURRENT AND FUTURE END USER ANALYSIS, 2025–2034, (USD MILLION)
FIGURE 37 NORTH AMERICA SECOND HAND TRADING CURRENT AND FUTURE MARKET VOLUME SHARE REGIONAL ANALYSIS, 2025–2034, (USD MILLION)
FIGURE 38 U.S. SECOND HAND TRADING CURRENT AND FUTURE TYPE ANALYSIS, 2025–2034, (USD MILLION)
FIGURE 39 U.S. SECOND HAND TRADING CURRENT AND FUTURE END USER ANALYSIS, 2025–2034, (USD MILLION)
FIGURE 40 CANADA SECOND HAND TRADING CURRENT AND FUTURE TYPE ANALYSIS, 2025–2034, (USD MILLION)
FIGURE 41 CANADA SECOND HAND TRADING CURRENT AND FUTURE END USER ANALYSIS, 2025–2034, (USD MILLION)
FIGURE 42 LATIN AMERICA SECOND HAND TRADING CURRENT AND FUTURE MARKET VOLUME SHARE REGIONAL ANALYSIS, 2025–2034, (USD MILLION)
FIGURE 43 MEXICO SECOND HAND TRADING CURRENT AND FUTURE TYPE ANALYSIS, 2025–2034, (USD MILLION)
FIGURE 44 MEXICO SECOND HAND TRADING CURRENT AND FUTURE END USER ANALYSIS, 2025–2034, (USD MILLION)
FIGURE 45 BRAZIL SECOND HAND TRADING CURRENT AND FUTURE TYPE ANALYSIS, 2025–2034, (USD MILLION)
FIGURE 46 BRAZIL SECOND HAND TRADING CURRENT AND FUTURE END USER ANALYSIS, 2025–2034, (USD MILLION)
FIGURE 47 ARGENTINA SECOND HAND TRADING CURRENT AND FUTURE TYPE ANALYSIS, 2025–2034, (USD MILLION)
FIGURE 48 ARGENTINA SECOND HAND TRADING CURRENT AND FUTURE END USER ANALYSIS, 2025–2034, (USD MILLION)
FIGURE 49 COLUMBIA SECOND HAND TRADING CURRENT AND FUTURE TYPE ANALYSIS, 2025–2034, (USD MILLION)
FIGURE 50 COLUMBIA SECOND HAND TRADING CURRENT AND FUTURE END USER ANALYSIS, 2025–2034, (USD MILLION)
FIGURE 51 REST OF LATIN AMERICA SECOND HAND TRADING CURRENT AND FUTURE TYPE ANALYSIS, 2025–2034, (USD MILLION)
FIGURE 52 REST OF LATIN AMERICA SECOND HAND TRADING CURRENT AND FUTURE END USER ANALYSIS, 2025–2034, (USD MILLION)
FIGURE 53 EASTERN EUROPE SECOND HAND TRADING CURRENT AND FUTURE MARKET VOLUME SHARE REGIONAL ANALYSIS, 2025–2034, (USD MILLION)
FIGURE 54 POLAND SECOND HAND TRADING CURRENT AND FUTURE TYPE ANALYSIS, 2025–2034, (USD MILLION)
FIGURE 55 POLAND SECOND HAND TRADING CURRENT AND FUTURE END USER ANALYSIS, 2025–2034, (USD MILLION)
FIGURE 56 RUSSIA SECOND HAND TRADING CURRENT AND FUTURE TYPE ANALYSIS, 2025–2034, (USD MILLION)
FIGURE 57 RUSSIA SECOND HAND TRADING CURRENT AND FUTURE END USER ANALYSIS, 2025–2034, (USD MILLION)
FIGURE 58 CZECH REPUBLIC SECOND HAND TRADING CURRENT AND FUTURE TYPE ANALYSIS, 2025–2034, (USD MILLION)
FIGURE 59 CZECH REPUBLIC SECOND HAND TRADING CURRENT AND FUTURE END USER ANALYSIS, 2025–2034, (USD MILLION)
FIGURE 60 ROMANIA SECOND HAND TRADING CURRENT AND FUTURE TYPE ANALYSIS, 2025–2034, (USD MILLION)
FIGURE 61 ROMANIA SECOND HAND TRADING CURRENT AND FUTURE END USER ANALYSIS, 2025–2034, (USD MILLION)
FIGURE 62 REST OF EASTERN EUROPE SECOND HAND TRADING CURRENT AND FUTURE TYPE ANALYSIS, 2025–2034, (USD MILLION)
FIGURE 63 REST OF EASTERN EUROPE SECOND HAND TRADING CURRENT AND FUTURE END USER ANALYSIS, 2025–2034, (USD MILLION)
FIGURE 64 WESTERN EUROPE SECOND HAND TRADING CURRENT AND FUTURE MARKET VOLUME SHARE REGIONAL ANALYSIS, 2025–2034, (USD MILLION)
FIGURE 65 GERMANY SECOND HAND TRADING CURRENT AND FUTURE TYPE ANALYSIS, 2025–2034, (USD MILLION)
FIGURE 66 GERMANY SECOND HAND TRADING CURRENT AND FUTURE END USER ANALYSIS, 2025–2034, (USD MILLION)
FIGURE 67 FRANCE SECOND HAND TRADING CURRENT AND FUTURE TYPE ANALYSIS, 2025–2034, (USD MILLION)
FIGURE 68 FRANCE SECOND HAND TRADING CURRENT AND FUTURE END USER ANALYSIS, 2025–2034, (USD MILLION)
FIGURE 69 UK SECOND HAND TRADING CURRENT AND FUTURE TYPE ANALYSIS, 2025–2034, (USD MILLION)
FIGURE 70 UK SECOND HAND TRADING CURRENT AND FUTURE END USER ANALYSIS, 2025–2034, (USD MILLION)
FIGURE 71 SPAIN SECOND HAND TRADING CURRENT AND FUTURE TYPE ANALYSIS, 2025–2034, (USD MILLION)
FIGURE 72 SPAIN SECOND HAND TRADING CURRENT AND FUTURE END USER ANALYSIS, 2025–2034, (USD MILLION)
FIGURE 73 ITALY SECOND HAND TRADING CURRENT AND FUTURE TYPE ANALYSIS, 2025–2034, (USD MILLION)
FIGURE 74 ITALY SECOND HAND TRADING CURRENT AND FUTURE END USER ANALYSIS, 2025–2034, (USD MILLION)
FIGURE 75 REST OF WESTERN EUROPE SECOND HAND TRADING CURRENT AND FUTURE TYPE ANALYSIS, 2025–2034, (USD MILLION)
FIGURE 76 REST OF WESTERN EUROPE SECOND HAND TRADING CURRENT AND FUTURE END USER ANALYSIS, 2025–2034, (USD MILLION)
FIGURE 77 EAST ASIA AND PACIFIC SECOND HAND TRADING CURRENT AND FUTURE MARKET VOLUME SHARE REGIONAL ANALYSIS, 2025–2034, (USD MILLION)
FIGURE 78 CHINA SECOND HAND TRADING CURRENT AND FUTURE TYPE ANALYSIS, 2025–2034, (USD MILLION)
FIGURE 79 CHINA SECOND HAND TRADING CURRENT AND FUTURE END USER ANALYSIS, 2025–2034, (USD MILLION)
FIGURE 80 JAPAN SECOND HAND TRADING CURRENT AND FUTURE TYPE ANALYSIS, 2025–2034, (USD MILLION)
FIGURE 81 JAPAN SECOND HAND TRADING CURRENT AND FUTURE END USER ANALYSIS, 2025–2034, (USD MILLION)
FIGURE 82 AUSTRALIA SECOND HAND TRADING CURRENT AND FUTURE TYPE ANALYSIS, 2025–2034, (USD MILLION)
FIGURE 83 AUSTRALIA SECOND HAND TRADING CURRENT AND FUTURE END USER ANALYSIS, 2025–2034, (USD MILLION)
FIGURE 84 CAMBODIA SECOND HAND TRADING CURRENT AND FUTURE TYPE ANALYSIS, 2025–2034, (USD MILLION)
FIGURE 85 CAMBODIA SECOND HAND TRADING CURRENT AND FUTURE END USER ANALYSIS, 2025–2034, (USD MILLION)
FIGURE 86 FIJI SECOND HAND TRADING CURRENT AND FUTURE TYPE ANALYSIS, 2025–2034, (USD MILLION)
FIGURE 87 FIJI SECOND HAND TRADING CURRENT AND FUTURE END USER ANALYSIS, 2025–2034, (USD MILLION)
FIGURE 88 INDONESIA SECOND HAND TRADING CURRENT AND FUTURE TYPE ANALYSIS, 2025–2034, (USD MILLION)
FIGURE 89 INDONESIA SECOND HAND TRADING CURRENT AND FUTURE END USER ANALYSIS, 2025–2034, (USD MILLION)
FIGURE 90 SOUTH KOREA SECOND HAND TRADING CURRENT AND FUTURE TYPE ANALYSIS, 2025–2034, (USD MILLION)
FIGURE 91 SOUTH KOREA SECOND HAND TRADING CURRENT AND FUTURE END USER ANALYSIS, 2025–2034, (USD MILLION)
FIGURE 92 REST OF EAST ASIA AND PACIFIC SECOND HAND TRADING CURRENT AND FUTURE TYPE ANALYSIS, 2025–2034, (USD MILLION)
FIGURE 93 REST OF EAST ASIA AND PACIFIC SECOND HAND TRADING CURRENT AND FUTURE END USER ANALYSIS, 2025–2034, (USD MILLION)
FIGURE 94 SEA AND SOUTH ASIA SECOND HAND TRADING CURRENT AND FUTURE MARKET VOLUME SHARE REGIONAL ANALYSIS, 2025–2034, (USD MILLION)
FIGURE 95 BANGLADESH SECOND HAND TRADING CURRENT AND FUTURE TYPE ANALYSIS, 2025–2034, (USD MILLION)
FIGURE 96 BANGLADESH SECOND HAND TRADING CURRENT AND FUTURE END USER ANALYSIS, 2025–2034, (USD MILLION)
FIGURE 97 NEW ZEALAND SECOND HAND TRADING CURRENT AND FUTURE TYPE ANALYSIS, 2025–2034, (USD MILLION)
FIGURE 98 NEW ZEALAND SECOND HAND TRADING CURRENT AND FUTURE END USER ANALYSIS, 2025–2034, (USD MILLION)
FIGURE 99 INDIA SECOND HAND TRADING CURRENT AND FUTURE TYPE ANALYSIS, 2025–2034, (USD MILLION)
FIGURE 100 INDIA SECOND HAND TRADING CURRENT AND FUTURE END USER ANALYSIS, 2025–2034, (USD MILLION)
FIGURE 101 SINGAPORE SECOND HAND TRADING CURRENT AND FUTURE TYPE ANALYSIS, 2025–2034, (USD MILLION)
FIGURE 102 SINGAPORE SECOND HAND TRADING CURRENT AND FUTURE END USER ANALYSIS, 2025–2034, (USD MILLION)
FIGURE 103 THAILAND SECOND HAND TRADING CURRENT AND FUTURE TYPE ANALYSIS, 2025–2034, (USD MILLION)
FIGURE 104 THAILAND SECOND HAND TRADING CURRENT AND FUTURE END USER ANALYSIS, 2025–2034, (USD MILLION)
FIGURE 105 TAIWAN SECOND HAND TRADING CURRENT AND FUTURE TYPE ANALYSIS, 2025–2034, (USD MILLION)
FIGURE 106 TAIWAN SECOND HAND TRADING CURRENT AND FUTURE END USER ANALYSIS, 2025–2034, (USD MILLION)
FIGURE 107 MALAYSIA SECOND HAND TRADING CURRENT AND FUTURE TYPE ANALYSIS, 2025–2034, (USD MILLION)
FIGURE 108 MALAYSIA SECOND HAND TRADING CURRENT AND FUTURE END USER ANALYSIS, 2025–2034, (USD MILLION)
FIGURE 109 REST OF SEA AND SOUTH ASIA SECOND HAND TRADING CURRENT AND FUTURE TYPE ANALYSIS, 2025–2034, (USD MILLION)
FIGURE 110 REST OF SEA AND SOUTH ASIA SECOND HAND TRADING CURRENT AND FUTURE END USER ANALYSIS, 2025–2034, (USD MILLION)
FIGURE 111 MIDDLE EAST AND AFRICA SECOND HAND TRADING CURRENT AND FUTURE MARKET VOLUME SHARE REGIONAL ANALYSIS, 2025–2034, (USD MILLION)
FIGURE 112 GCC COUNTRIES SECOND HAND TRADING CURRENT AND FUTURE TYPE ANALYSIS, 2025–2034, (USD MILLION)
FIGURE 113 GCC COUNTRIES SECOND HAND TRADING CURRENT AND FUTURE END USER ANALYSIS, 2025–2034, (USD MILLION)
FIGURE 114 SAUDI ARABIA SECOND HAND TRADING CURRENT AND FUTURE TYPE ANALYSIS, 2025–2034, (USD MILLION)
FIGURE 115 SAUDI ARABIA SECOND HAND TRADING CURRENT AND FUTURE END USER ANALYSIS, 2025–2034, (USD MILLION)
FIGURE 116 UAE SECOND HAND TRADING CURRENT AND FUTURE TYPE ANALYSIS, 2025–2034, (USD MILLION)
FIGURE 117 UAE SECOND HAND TRADING CURRENT AND FUTURE END USER ANALYSIS, 2025–2034, (USD MILLION)
FIGURE 118 BAHRAIN SECOND HAND TRADING CURRENT AND FUTURE TYPE ANALYSIS, 2025–2034, (USD MILLION)
FIGURE 119 BAHRAIN SECOND HAND TRADING CURRENT AND FUTURE END USER ANALYSIS, 2025–2034, (USD MILLION)
FIGURE 120 KUWAIT SECOND HAND TRADING CURRENT AND FUTURE TYPE ANALYSIS, 2025–2034, (USD MILLION)
FIGURE 121 KUWAIT SECOND HAND TRADING CURRENT AND FUTURE END USER ANALYSIS, 2025–2034, (USD MILLION)
FIGURE 122 OMAN SECOND HAND TRADING CURRENT AND FUTURE TYPE ANALYSIS, 2025–2034, (USD MILLION)
FIGURE 123 OMAN SECOND HAND TRADING CURRENT AND FUTURE END USER ANALYSIS, 2025–2034, (USD MILLION)
FIGURE 124 QATAR SECOND HAND TRADING CURRENT AND FUTURE TYPE ANALYSIS, 2025–2034, (USD MILLION)
FIGURE 125 QATAR SECOND HAND TRADING CURRENT AND FUTURE END USER ANALYSIS, 2025–2034, (USD MILLION)
FIGURE 126 EGYPT SECOND HAND TRADING CURRENT AND FUTURE TYPE ANALYSIS, 2025–2034, (USD MILLION)
FIGURE 127 EGYPT SECOND HAND TRADING CURRENT AND FUTURE END USER ANALYSIS, 2025–2034, (USD MILLION)
FIGURE 128 NIGERIA SECOND HAND TRADING CURRENT AND FUTURE TYPE ANALYSIS, 2025–2034, (USD MILLION)
FIGURE 129 NIGERIA SECOND HAND TRADING CURRENT AND FUTURE END USER ANALYSIS, 2025–2034, (USD MILLION)
FIGURE 130 SOUTH AFRICA SECOND HAND TRADING CURRENT AND FUTURE TYPE ANALYSIS, 2025–2034, (USD MILLION)
FIGURE 131 SOUTH AFRICA SECOND HAND TRADING CURRENT AND FUTURE END USER ANALYSIS, 2025–2034, (USD MILLION)
FIGURE 132 ISRAEL SECOND HAND TRADING CURRENT AND FUTURE TYPE ANALYSIS, 2025–2034, (USD MILLION)
FIGURE 133 ISRAEL SECOND HAND TRADING CURRENT AND FUTURE END USER ANALYSIS, 2025–2034, (USD MILLION)
FIGURE 134 REST OF MEA SECOND HAND TRADING CURRENT AND FUTURE TYPE ANALYSIS, 2025–2034, (USD MILLION)
FIGURE 135 REST OF MEA SECOND HAND TRADING CURRENT AND FUTURE END USER ANALYSIS, 2025–2034, (USD MILLION)
FIGURE 136 U. S. MARKET SHARE ANALYSIS BY TYPE (2024)
FIGURE 137 U. S. MARKET SHARE ANALYSIS BY END USER (2024)
FIGURE 138 CANADA MARKET SHARE ANALYSIS BY TYPE (2024)
FIGURE 139 CANADA MARKET SHARE ANALYSIS BY END USER (2024)
FIGURE 140 MEXICO MARKET SHARE ANALYSIS BY TYPE (2024)
FIGURE 141 MEXICO MARKET SHARE ANALYSIS BY END USER (2024)
FIGURE 142 CHINA MARKET SHARE ANALYSIS BY TYPE (2024)
FIGURE 143 CHINA MARKET SHARE ANALYSIS BY END USER (2024)
FIGURE 144 JAPAN MARKET SHARE ANALYSIS BY TYPE (2024)
FIGURE 145 JAPAN MARKET SHARE ANALYSIS BY END USER (2024)
FIGURE 146 INDIA MARKET SHARE ANALYSIS BY TYPE (2024)
FIGURE 147 INDIA MARKET SHARE ANALYSIS BY END USER (2024)
FIGURE 148 SOUTH KOREA MARKET SHARE ANALYSIS BY TYPE (2024)
FIGURE 149 SOUTH KOREA MARKET SHARE ANALYSIS BY END USER (2024)
FIGURE 150 SAUDI ARABIA MARKET SHARE ANALYSIS BY TYPE (2024)
FIGURE 151 SAUDI ARABIA MARKET SHARE ANALYSIS BY END USER (2024)
FIGURE 152 UAE MARKET SHARE ANALYSIS BY TYPE (2024)
FIGURE 153 UAE MARKET SHARE ANALYSIS BY END USER (2024)
FIGURE 154 EGYPT MARKET SHARE ANALYSIS BY TYPE (2024)
FIGURE 155 EGYPT MARKET SHARE ANALYSIS BY END USER (2024)
FIGURE 156 NIGERIA MARKET SHARE ANALYSIS BY TYPE (2024)
FIGURE 157 NIGERIA MARKET SHARE ANALYSIS BY END USER (2024)
FIGURE 158 SOUTH AFRICA MARKET SHARE ANALYSIS BY TYPE (2024)
FIGURE 159 SOUTH AFRICA MARKET SHARE ANALYSIS BY END USER (2024)
FIGURE 160 GERMANY MARKET SHARE ANALYSIS BY TYPE (2024)
FIGURE 161 GERMANY MARKET SHARE ANALYSIS BY END USER (2024)
FIGURE 162 FRANCE MARKET SHARE ANALYSIS BY TYPE (2024)
FIGURE 163 FRANCE MARKET SHARE ANALYSIS BY END USER (2024)
FIGURE 164 UK MARKET SHARE ANALYSIS BY TYPE (2024)
FIGURE 165 UK MARKET SHARE ANALYSIS BY END USER (2024)
FIGURE 166 SPAIN MARKET SHARE ANALYSIS BY TYPE (2024)
FIGURE 167 SPAIN MARKET SHARE ANALYSIS BY END USER (2024)
FIGURE 168 ITALY MARKET SHARE ANALYSIS BY TYPE (2024)
FIGURE 169 ITALY MARKET SHARE ANALYSIS BY END USER (2024)
FIGURE 170 BRAZIL MARKET SHARE ANALYSIS BY TYPE (2024)
FIGURE 171 BRAZIL MARKET SHARE ANALYSIS BY END USER (2024)
FIGURE 172 ARGENTINA MARKET SHARE ANALYSIS BY TYPE (2024)
FIGURE 173 ARGENTINA MARKET SHARE ANALYSIS BY END USER (2024)
FIGURE 174 COLUMBIA MARKET SHARE ANALYSIS BY TYPE (2024)
FIGURE 175 COLUMBIA MARKET SHARE ANALYSIS BY END USER (2024)
FIGURE 176 GLOBAL SECOND HAND TRADING CURRENT AND FUTURE MARKET KEY COUNTRY LEVEL ANALYSIS, 2024–2034, (USD MILLION)
FIGURE 177 FINANCIAL OVERVIEW:
Key Player Analysis
eBay Inc.: Leader. eBay operates a global marketplace that anchors recommerce in apparel, electronics, luxury, motors, and home, with trust features and category breadth that align with the market’s B2C dominance and a steady 2024–2033 CAGR of 5.3 percent for the sector. The company differentiates through buyer protection, authentication programs in select categories, and a refurbished offering that attracts value‑seeking buyers and professional sellers at scale. You should expect eBay to keep expanding managed services and data‑driven search to sustain conversion in core verticals where standardized quality and payments deliver repeat usage
eBay’s strategic focus includes deeper AI‑enabled discovery, pricing, and risk controls that compress dispute rates while supporting higher‑value categories with verification and warranties. Continued category curation and pro‑seller tools position eBay as a volume and trust leader, supporting defensible take rates as recommerce adoption broadens across regions.
Vinted: Leader. Vinted reported 2024 group revenue of €813.4 million, up 36 percent year over year, with net profit of €76.7 million and adjusted EBITDA of €158.9 million, reflecting scale economics in European C2C fashion and adjacent categories. The company expanded logistics via Vinted Go and payments via Vinted Pay while launching an investment arm, Vinted Ventures, to extend its position across the recommerce value chain. You can read these results as proof of resilient demand and disciplined execution that supports continued share gains in core EU markets.
Vinted’s differentiators include low‑cost cross‑border shipping in select corridors, category expansion into luxury and tech, and disciplined cost control that lifted profitability, with external reports highlighting strengthened margins and a €5 billion secondary valuation in late 2024. The company plans further geographic and category rollout in 2025, reinforcing its leadership in mobile‑led second‑hand fashion and adjacent high‑turn SKUs.
Vestiaire Collective: Innovator. Vestiaire Collective competes as an authenticated luxury resale specialist, addressing price‑sensitive and sustainability‑minded buyers who require stringent verification and quality control. The platform’s curation and authentication workflows underpin premium pricing and higher average order values relative to generalist marketplaces, positioning the company to benefit from ongoing premiumization within apparel recommerce.
Strategically, Vestiaire emphasizes authentication operations, expert grading, and managed shipping to reduce friction for cross‑border luxury buyers, supported by the broader market’s shift toward trust‑rich B2C formats. You should expect continued investment in AI‑assisted listing review and pricing guidance to raise sell‑through and protect buyer confidence in high‑value transactions.
OLX Group: Challenger. OLX Group delivered FY2025 revenue of US$777 million, up 18 percent year over year, with adjusted EBIT of US$270 million and a 35 percent margin, driven by Motors, Real Estate, and Jobs across selected growth markets. The group reported scale across nine brands in nine markets, nearly 64 million active listings daily, and 29 million monthly app users, supported by AI‑driven product enhancements in matching and user experience. You can view the sharper category focus and AI investments as catalysts for sustained growth with targeted margin expansion toward management’s medium‑term ambition.
Operationally, OLX has streamlined its portfolio, including prior exits from certain auto classifieds activities in India, while doubling down on dealer tools, vehicle history, and professional features that lift monetization in Motors and property marketplaces. This focus on core verticals and professional customers positions OLX to compound revenue in high‑intent categories where verification, data services, and subscriptions support durable unit economics.
Market Key Players:
Guazi
Vestiaire Collective
58.com
JD.com
Kongfz
Alibaba Group
Greendust
Vinted
OLX Group
Beijing Shanyi Shanmei Technology
eBay Inc.
Suning
2shoujie
Driver
Mainstream Adoption and Trust Infrastructure Drive GMV Growth
By 2025, second-hand trading platforms are growing due to clear demand signals and steady growth, supported by better buyer protections and improved category curation, especially in B2C formats. The market is moving from about USD 1.2 billion in 2023 toward USD 2.0 billion by 2033, with a ~5.3% CAGR. This shows predictable GMV growth instead of speculative spikes. Investments in authentication, escrow, and standardized fulfillment are boosting confidence, which directly increases conversion rates and repeat usage.
AI Enablement and Community Scale Lower Acquisition Costs
AI-driven search, image recognition, pricing guidance, and safer checkout processes are improving match rates and retention while lowering customer acquisition costs per transaction. Large ecosystems show the benefits of daily liquidity at community scale. U.S. participation data shows that secondhand buying and selling has become mainstream, confirming a solid adoption base. For operators, this means steadier GMV growth, better cohort economics, and more efficient marketing spending.
Regulatory fragmentation in product safety, liability, and tax compliance is a significant barrier, especially for platforms expanding across borders or quickly onboarding smaller sellers. Different rules on returns, warranties, and consumer protection add to operational complexity and slow geographic rollout, particularly in areas like electronics, toys, and personal goods.
Fraud, Returns, and Dispute Handling Pressure Margins
Fraud risk, counterfeits, and reverse logistics raise operating costs and dispute volumes, limiting margin growth for C2C and hybrid models. While B2C dominates due to higher trust and standardized quality controls, platforms still need to invest in compliance tools, identity verification, and category-specific policies. Ongoing profitability relies on managing chargebacks and compliance risks without hindering sales.
Opportunity
Asia Pacific Scale Enables Higher-Take-Rate Verticals
Asia Pacific leads the market with over a third of the share, driven by mature mobile commerce and large user bases in China and India. This environment supports certified electronics, authenticated fashion, and refurbished products that can earn higher take rates than general merchandise. Platforms that invest in inspection, grading, and warranty-backed resale can capture greater value while increasing liquidity.
North America Omnichannel Expansion Unlocks Multi-Category Growth
North America's resale ecosystem is also growing, with ample room for multi-category platforms and omnichannel partnerships. Managed B2C models and professional seller programs provide ways to build trust and consistency across apparel, electronics, and home goods. Focusing on categories with verifiable condition and quick turnover—backed by KYC, device checks, and warranties—can lower dispute ratios and speed up GMV growth.
Trend
AI-Led Personalization and Pricing Shorten Time to Sale
Platforms are increasingly using AI for personalization, automated pricing, and risk scoring to boost match rates and reduce time to sale. The prevalence of personal-use listings strengthens the data flywheel, allowing for more accurate recommendations and better inventory routing. These features enhance sell-through and reduce operational friction for both supply and demand.
Community Commerce and Managed Services Converge
Community commerce models are reaching their limits, especially in markets where blended C2C supply is enhanced with managed services that build trust and speed. In the United States, nearly universal buyer participation shows that recommerce is a key retail behavior. Platform roadmaps are focusing more on authentication, buyer guarantees, and localized logistics to maintain repeat rates and platform resilience through 2025 and beyond.
Recent Developments
Dec 2024 – The RealReal: Opened a new brick-and-mortar store in Houston’s Montrose Collective, bringing its U.S. retail footprint to 15 locations and extending authenticated luxury resale access in a high-growth metro. The expansion strengthens omnichannel reach and consignor acquisition in the U.S. Sunbelt.
Feb 2025 – The RealReal: Issued preliminary FY2024 results with Q4 GMV of about USD 503.5 million and FY2024 GMV tracking to USD 1.829 billion, exceeding guidance, alongside positive adjusted EBITDA and a strategic debt exchange to bolster the balance sheet. The result signals profitable growth momentum and improved unit economics into 2025.
Feb 2025 – Vestiaire Collective: Announced a U.S. celebrity closet collaboration with Paris Hilton, with net proceeds to charity, while noting the United States is now the platform’s largest market at roughly 20 percent of total business. The move lifts brand visibility and deepens U.S. buyer and seller engagement in authenticated luxury resale.
Apr 2025 – Vinted: Reported 2024 revenue of €813.4 million, up 36 percent year over year, net profit of €76.7 million, and adjusted EBITDA of €158.9 million, while expanding logistics (Vinted Go), payments (Vinted Pay), and launching Vinted Ventures to back recommerce startups. The results reinforce leadership in European C2C fashion and build moats in shipping, payments, and ecosystem investment.
Jun 2025 – OLX Group: Posted FY2025 revenue of USD 777 million, up 18 percent year over year, with adjusted EBIT of USD 270 million at a 35 percent margin; platforms hosted nearly 64 million daily active listings and 29 million monthly app users, driven by Motors, Real Estate, and Jobs. The scale and margin expansion strengthen OLX’s position in classifieds while AI-led product upgrades improve customer experience and monetization.
Aug 2025 – OLX Group: Agreed to sell OLX Uzbekistan to a joint venture led by TBC Bank Group as part of a portfolio streamlining to prioritize core geographies and categories. The divestment concentrates capital and management focus on higher-growth markets with stronger network effects.

 Aerospace And Defence
 Agriculture
 Automotive And Transportation
 Banking And Finance
 Business
 Chemicals And Materials
 Consumer And Retail
 Electronics And Semiconductors
 Food And Beverages
 Machinery & Equipments
 Manufacturing And Construction
 Medical Devices
 Others
 Pharmaceuticals And Healthcare
 Power And Energy
 Sports
 Technology

, By Platform (Online Marketplaces, Offline Stores, C2C Apps), By Consumer Demographics, Sustainability Impact, Regional Trends, Competitive Landscape, Business Models & Forecast 2025–2034")
, By Platform (Online Marketplaces, Offline Stores, C2C Apps), By Consumer Demographics, Sustainability Impact, Regional Trends, Competitive Landscape, Business Models & Forecast 2025–2034")
, By Platform (Online Marketplaces, Offline Stores, C2C Apps), By Consumer Demographics, Sustainability Impact, Regional Trends, Competitive Landscape, Business Models & Forecast 2025–2034")
, By Platform (Online Marketplaces, Offline Stores, C2C Apps), By Consumer Demographics, Sustainability Impact, Regional Trends, Competitive Landscape, Business Models & Forecast 2025–2034")

