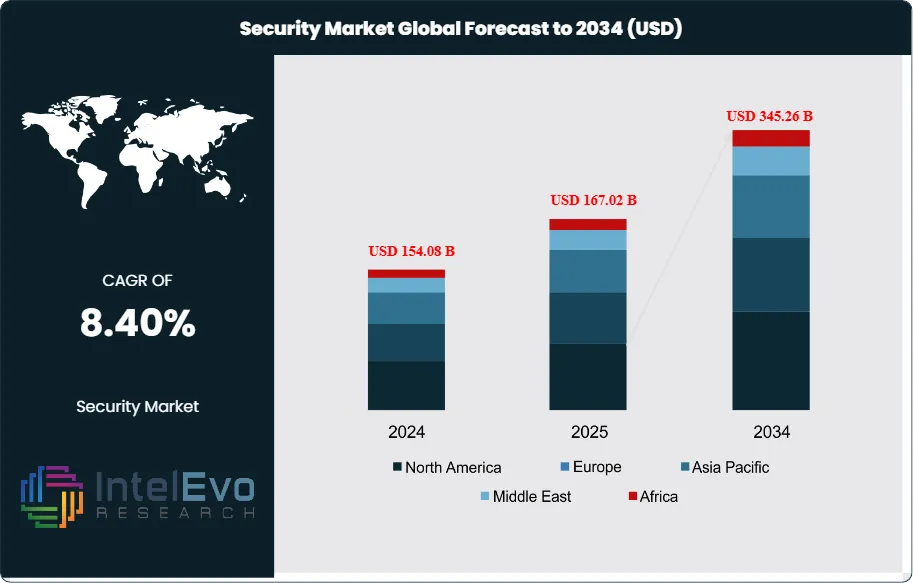
The Security Market size is expected to be worth around USD 345.26 billion by 2034, rising from USD 154.08 billion in 2024, and expanding at a CAGR of 8.40% during the forecast period from 2024 to 2034. This growth is driven by rising cyber threats, increasing adoption of cloud computing, and growing demand for advanced security solutions across enterprises and governments. The rapid integration of AI, machine learning, and zero-trust architectures is further transforming security strategies, positioning the market as a critical pillar for protecting digital assets and critical infrastructure worldwide.
The security market has emerged as a critical component of the global economy, addressing escalating concerns around physical safety, cybersecurity, and data protection. The market encompasses a comprehensive range of solutions including surveillance systems, access control, intrusion detection, cybersecurity tools, biometrics, and integrated solutions powered by artificial intelligence and Internet of Things technologies. These innovations enhance real-time threat detection, streamline responses, and provide predictive analytics to prevent incidents before they occur.
Market expansion is driven by increasing illegal events, terrorism, fraudulent activities globally, and stringent government norms that have accelerated adoption of security systems. The security industry benefits from significant adoption rates in military & defense sectors due to increased terrorism threats and cross-border intrusions. As global economies become more interconnected and dependent on digital infrastructure, demand for advanced security solutions has surged across residential, commercial, industrial, and governmental sectors.
The COVID-19 pandemic has further underscored the importance of physical security as organizations reassess their safety protocols to protect employees and visitors in an increasingly uncertain environment. Additionally, regulatory frameworks such as GDPR in Europe and CCPA in California have compelled organizations to prioritize security measures to avoid hefty penalties.
Regional market dynamics show North America leading with advanced technological infrastructure and significant investments in security solutions, particularly in the U.S. with strong demand across government, military, commercial, and industrial sectors. Increasing cyber threats, high-profile data breaches, and terrorism concerns have prompted businesses and governments to prioritize security.
Trade tensions and geopolitical conflicts have heightened the need for robust security infrastructure, particularly in critical sectors like defense, telecommunications, and energy. Organizations are investing heavily in securing supply chains and protecting against state-sponsored cyber-attacks.
Key Takeaways
Market Size & Growth: The Security Market is expected to reach USD 345.26 Billion by 2034, driven by escalating security threats and evolving technological demands across multiple sectors.
System Type Dominance: Video Surveillance Systems lead because they provide comprehensive visual monitoring with advanced AI-powered analytics, real-time threat detection, and scalable solutions that address growing security concerns across all industries.
Service Type Dominance: System Integration & Consulting leads in services due to the critical demand for unified security platforms that centralize multiple security components and provide customized solutions.
End User Dominance: Military & Defence dominates end-use applications because governments worldwide prioritize modernizing defense capabilities to counter emerging threats like cyber warfare and terrorism.
Drivers: Key drivers accelerating growth include increasing cyber threats and terrorism concerns, which boost market expansion through heightened security awareness and regulatory compliance requirements.
Restraints: Growth is hindered by high implementation costs and lack of skilled personnel, which create challenges such as budget constraints for smaller businesses and operational difficulties.
Opportunities: The market is poised for expansion due to opportunities like AI integration and IoT adoption, which enable enhanced threat detection and predictive analytics capabilities.
Trends: Emerging trends including cloud migration and remote monitoring are reshaping the market by enabling scalable, real-time protection and mobile security applications.
Regional Analysis: North America leads owing to advanced technological infrastructure and significant security investments. Asia Pacific shows high promise due to rapid industrialization and growing cybersecurity concerns.
System Type Analysis:
Video Surveillance Systems Leads With over 45% Market Share In Security Market: The video surveillance systems segment's leadership position stems from its technological sophistication and universal applicability across sectors. Modern surveillance systems incorporate artificial intelligence for facial recognition, behavioral analysis, and automated threat detection, making them indispensable for proactive security management. Their integration capabilities with other security components and cloud-based accessibility have made them the cornerstone of comprehensive security strategies for retail, transportation, banking, and government facilities.
Service Type Analysis:
System integration and consulting services dominate because organizations increasingly require holistic security solutions rather than fragmented systems. Professional integrators eliminate security vulnerabilities by creating seamless connections between physical security, cybersecurity, and operational systems. Their expertise ensures optimal system performance, reduces operational complexity, and provides ongoing strategic guidance for evolving security needs.
End User Analysis:
The military and defense end-use segment's prominence reflects global security imperatives and substantial government investments in advanced protection technologies. Defense organizations require sophisticated surveillance systems, secure communication networks, and electronic warfare capabilities to maintain operational superiority against evolving threats including terrorism, espionage, and border security challenges.
Regional Analysis:
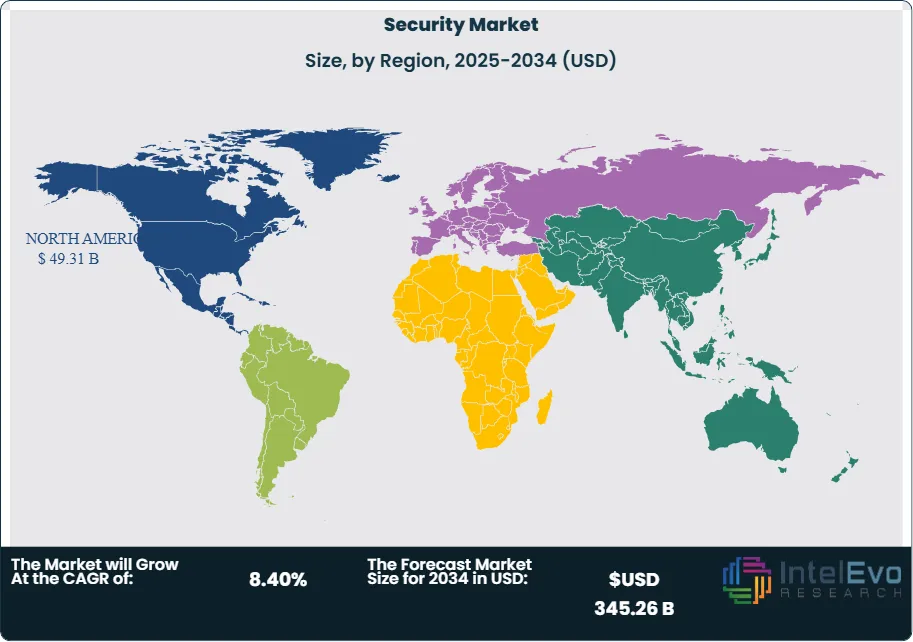
North America Leads With more than 30% Market Share In Security Market: North America dominates the global security market with a 32% market share in 2024, primarily driven by the United States' advanced technological infrastructure and substantial security investments across government, military, commercial, and industrial sectors. The region benefits from stringent regulatory frameworks, high digital penetration rates, and early adoption of cutting-edge technologies such as AI, IoT, and cloud-based security systems. Increasing cyber threats, high-profile data breaches, and terrorism concerns have prompted both businesses and governments to prioritize comprehensive security solutions.
Europe represents the second-largest regional market, characterized by strict data protection regulations like GDPR that compel organizations to invest heavily in security infrastructure. The region shows strong adoption of integrated security solutions and advanced surveillance technologies. Asia Pacific emerges as the fastest-growing region, fueled by rapid industrialization, urbanization, and growing cybersecurity awareness. Countries like China and India are experiencing significant demand growth due to expanding digital economies and increasing security threats.
Latin America and Middle East & Africa regions present substantial growth opportunities, driven by infrastructure development, rising security concerns, and government initiatives to modernize security systems. These emerging markets are gradually adopting advanced security technologies as economic conditions improve and threat landscapes evolve.
Customization for segments, region/country-level will be provided. Moreover, additional customization can be done based on the requirements.
Pricing and Purchase Options
Avail customized purchase options to meet your exact research needs. We have three licenses to opt for: Single User License, Multi-User License (Up to 5 Users), Corporate Use License (Unlimited User and Printable PDF).
TABLE OF CONTENTS
1. EXECUTIVE SUMMARY
1.1. MARKET SNAPSHOT
1.2. KEY FINDINGS & INSIGHTS
1.3. ANALYST RECOMMENDATIONS
1.4. FUTURE OUTLOOK
2. RESEARCH METHODOLOGY
2.1. MARKET DEFINITION & SCOPE
2.2. RESEARCH OBJECTIVES: PRIMARY & SECONDARY DATA SOURCES
2.3. DATA COLLECTION SOURCES
2.3.1. COVERAGE OF 100+ PRIMARY RESEARCH/CONSULTATION CALLS WITH INDUSTRY STAKEHOLDERS
FIGURE 17 NORTH AMERICA SECURITY CURRENT AND FUTURE TYPE ANALYSIS, 2025–2034, (USD MILLION)
FIGURE 18 NORTH AMERICA SECURITY CURRENT AND FUTURE END USER ANALYSIS, 2025–2034, (USD MILLION)
FIGURE 19 MARKET SHARE BY COUNTRY
FIGURE 20 LATIN AMERICA SECURITY CURRENT AND FUTURE TYPE ANALYSIS, 2025–2034, (USD MILLION)
FIGURE 21 LATIN AMERICA SECURITY CURRENT AND FUTURE END USER ANALYSIS, 2025–2034, (USD MILLION)
FIGURE 22 MARKET SHARE BY COUNTRY
FIGURE 23 EASTERN EUROPE SECURITY CURRENT AND FUTURE TYPE ANALYSIS, 2025–2034, (USD MILLION)
FIGURE 24 EASTERN EUROPE SECURITY CURRENT AND FUTURE END USER ANALYSIS, 2025–2034, (USD MILLION)
FIGURE 25 MARKET SHARE BY COUNTRY
FIGURE 26 WESTERN EUROPE SECURITY CURRENT AND FUTURE TYPE ANALYSIS, 2025–2034, (USD MILLION)
FIGURE 27 WESTERN EUROPE SECURITY CURRENT AND FUTURE END USER ANALYSIS, 2025–2034, (USD MILLION)
FIGURE 28 MARKET SHARE BY COUNTRY
FIGURE 29 EAST ASIA AND PACIFIC SECURITY CURRENT AND FUTURE TYPE ANALYSIS, 2025–2034, (USD MILLION)
FIGURE 30 EAST ASIA AND PACIFIC SECURITY CURRENT AND FUTURE END USER ANALYSIS, 2025–2034, (USD MILLION)
FIGURE 31 MARKET SHARE BY COUNTRY
FIGURE 32 SEA AND SOUTH ASIA SECURITY CURRENT AND FUTURE TYPE ANALYSIS, 2025–2034, (USD MILLION)
FIGURE 33 SEA AND SOUTH ASIA SECURITY CURRENT AND FUTURE END USER ANALYSIS, 2025–2034, (USD MILLION)
FIGURE 34 MARKET SHARE BY COUNTRY
FIGURE 35 MIDDLE EAST AND AFRICA SECURITY CURRENT AND FUTURE TYPE ANALYSIS, 2025–2034, (USD MILLION)
FIGURE 36 MIDDLE EAST AND AFRICA SECURITY CURRENT AND FUTURE END USER ANALYSIS, 2025–2034, (USD MILLION)
FIGURE 37 NORTH AMERICA SECURITY CURRENT AND FUTURE MARKET VOLUME SHARE REGIONAL ANALYSIS, 2025–2034, (USD MILLION)
FIGURE 38 U.S. SECURITY CURRENT AND FUTURE TYPE ANALYSIS, 2025–2034, (USD MILLION)
FIGURE 39 U.S. SECURITY CURRENT AND FUTURE END USER ANALYSIS, 2025–2034, (USD MILLION)
FIGURE 40 CANADA SECURITY CURRENT AND FUTURE TYPE ANALYSIS, 2025–2034, (USD MILLION)
FIGURE 41 CANADA SECURITY CURRENT AND FUTURE END USER ANALYSIS, 2025–2034, (USD MILLION)
FIGURE 42 LATIN AMERICA SECURITY CURRENT AND FUTURE MARKET VOLUME SHARE REGIONAL ANALYSIS, 2025–2034, (USD MILLION)
FIGURE 43 MEXICO SECURITY CURRENT AND FUTURE TYPE ANALYSIS, 2025–2034, (USD MILLION)
FIGURE 44 MEXICO SECURITY CURRENT AND FUTURE END USER ANALYSIS, 2025–2034, (USD MILLION)
FIGURE 45 BRAZIL SECURITY CURRENT AND FUTURE TYPE ANALYSIS, 2025–2034, (USD MILLION)
FIGURE 46 BRAZIL SECURITY CURRENT AND FUTURE END USER ANALYSIS, 2025–2034, (USD MILLION)
FIGURE 47 ARGENTINA SECURITY CURRENT AND FUTURE TYPE ANALYSIS, 2025–2034, (USD MILLION)
FIGURE 48 ARGENTINA SECURITY CURRENT AND FUTURE END USER ANALYSIS, 2025–2034, (USD MILLION)
FIGURE 49 COLUMBIA SECURITY CURRENT AND FUTURE TYPE ANALYSIS, 2025–2034, (USD MILLION)
FIGURE 50 COLUMBIA SECURITY CURRENT AND FUTURE END USER ANALYSIS, 2025–2034, (USD MILLION)
FIGURE 51 REST OF LATIN AMERICA SECURITY CURRENT AND FUTURE TYPE ANALYSIS, 2025–2034, (USD MILLION)
FIGURE 52 REST OF LATIN AMERICA SECURITY CURRENT AND FUTURE END USER ANALYSIS, 2025–2034, (USD MILLION)
FIGURE 53 EASTERN EUROPE SECURITY CURRENT AND FUTURE MARKET VOLUME SHARE REGIONAL ANALYSIS, 2025–2034, (USD MILLION)
FIGURE 54 POLAND SECURITY CURRENT AND FUTURE TYPE ANALYSIS, 2025–2034, (USD MILLION)
FIGURE 55 POLAND SECURITY CURRENT AND FUTURE END USER ANALYSIS, 2025–2034, (USD MILLION)
FIGURE 56 RUSSIA SECURITY CURRENT AND FUTURE TYPE ANALYSIS, 2025–2034, (USD MILLION)
FIGURE 57 RUSSIA SECURITY CURRENT AND FUTURE END USER ANALYSIS, 2025–2034, (USD MILLION)
FIGURE 58 CZECH REPUBLIC SECURITY CURRENT AND FUTURE TYPE ANALYSIS, 2025–2034, (USD MILLION)
FIGURE 59 CZECH REPUBLIC SECURITY CURRENT AND FUTURE END USER ANALYSIS, 2025–2034, (USD MILLION)
FIGURE 60 ROMANIA SECURITY CURRENT AND FUTURE TYPE ANALYSIS, 2025–2034, (USD MILLION)
FIGURE 61 ROMANIA SECURITY CURRENT AND FUTURE END USER ANALYSIS, 2025–2034, (USD MILLION)
FIGURE 62 REST OF EASTERN EUROPE SECURITY CURRENT AND FUTURE TYPE ANALYSIS, 2025–2034, (USD MILLION)
FIGURE 63 REST OF EASTERN EUROPE SECURITY CURRENT AND FUTURE END USER ANALYSIS, 2025–2034, (USD MILLION)
FIGURE 64 WESTERN EUROPE SECURITY CURRENT AND FUTURE MARKET VOLUME SHARE REGIONAL ANALYSIS, 2025–2034, (USD MILLION)
FIGURE 65 GERMANY SECURITY CURRENT AND FUTURE TYPE ANALYSIS, 2025–2034, (USD MILLION)
FIGURE 66 GERMANY SECURITY CURRENT AND FUTURE END USER ANALYSIS, 2025–2034, (USD MILLION)
FIGURE 67 FRANCE SECURITY CURRENT AND FUTURE TYPE ANALYSIS, 2025–2034, (USD MILLION)
FIGURE 68 FRANCE SECURITY CURRENT AND FUTURE END USER ANALYSIS, 2025–2034, (USD MILLION)
FIGURE 69 UK SECURITY CURRENT AND FUTURE TYPE ANALYSIS, 2025–2034, (USD MILLION)
FIGURE 70 UK SECURITY CURRENT AND FUTURE END USER ANALYSIS, 2025–2034, (USD MILLION)
FIGURE 71 SPAIN SECURITY CURRENT AND FUTURE TYPE ANALYSIS, 2025–2034, (USD MILLION)
FIGURE 72 SPAIN SECURITY CURRENT AND FUTURE END USER ANALYSIS, 2025–2034, (USD MILLION)
FIGURE 73 ITALY SECURITY CURRENT AND FUTURE TYPE ANALYSIS, 2025–2034, (USD MILLION)
FIGURE 74 ITALY SECURITY CURRENT AND FUTURE END USER ANALYSIS, 2025–2034, (USD MILLION)
FIGURE 75 REST OF WESTERN EUROPE SECURITY CURRENT AND FUTURE TYPE ANALYSIS, 2025–2034, (USD MILLION)
FIGURE 76 REST OF WESTERN EUROPE SECURITY CURRENT AND FUTURE END USER ANALYSIS, 2025–2034, (USD MILLION)
FIGURE 77 EAST ASIA AND PACIFIC SECURITY CURRENT AND FUTURE MARKET VOLUME SHARE REGIONAL ANALYSIS, 2025–2034, (USD MILLION)
FIGURE 78 CHINA SECURITY CURRENT AND FUTURE TYPE ANALYSIS, 2025–2034, (USD MILLION)
FIGURE 79 CHINA SECURITY CURRENT AND FUTURE END USER ANALYSIS, 2025–2034, (USD MILLION)
FIGURE 80 JAPAN SECURITY CURRENT AND FUTURE TYPE ANALYSIS, 2025–2034, (USD MILLION)
FIGURE 81 JAPAN SECURITY CURRENT AND FUTURE END USER ANALYSIS, 2025–2034, (USD MILLION)
FIGURE 82 AUSTRALIA SECURITY CURRENT AND FUTURE TYPE ANALYSIS, 2025–2034, (USD MILLION)
FIGURE 83 AUSTRALIA SECURITY CURRENT AND FUTURE END USER ANALYSIS, 2025–2034, (USD MILLION)
FIGURE 84 CAMBODIA SECURITY CURRENT AND FUTURE TYPE ANALYSIS, 2025–2034, (USD MILLION)
FIGURE 85 CAMBODIA SECURITY CURRENT AND FUTURE END USER ANALYSIS, 2025–2034, (USD MILLION)
FIGURE 86 FIJI SECURITY CURRENT AND FUTURE TYPE ANALYSIS, 2025–2034, (USD MILLION)
FIGURE 87 FIJI SECURITY CURRENT AND FUTURE END USER ANALYSIS, 2025–2034, (USD MILLION)
FIGURE 88 INDONESIA SECURITY CURRENT AND FUTURE TYPE ANALYSIS, 2025–2034, (USD MILLION)
FIGURE 89 INDONESIA SECURITY CURRENT AND FUTURE END USER ANALYSIS, 2025–2034, (USD MILLION)
FIGURE 90 SOUTH KOREA SECURITY CURRENT AND FUTURE TYPE ANALYSIS, 2025–2034, (USD MILLION)
FIGURE 91 SOUTH KOREA SECURITY CURRENT AND FUTURE END USER ANALYSIS, 2025–2034, (USD MILLION)
FIGURE 92 REST OF EAST ASIA AND PACIFIC SECURITY CURRENT AND FUTURE TYPE ANALYSIS, 2025–2034, (USD MILLION)
FIGURE 93 REST OF EAST ASIA AND PACIFIC SECURITY CURRENT AND FUTURE END USER ANALYSIS, 2025–2034, (USD MILLION)
FIGURE 94 SEA AND SOUTH ASIA SECURITY CURRENT AND FUTURE MARKET VOLUME SHARE REGIONAL ANALYSIS, 2025–2034, (USD MILLION)
FIGURE 95 BANGLADESH SECURITY CURRENT AND FUTURE TYPE ANALYSIS, 2025–2034, (USD MILLION)
FIGURE 96 BANGLADESH SECURITY CURRENT AND FUTURE END USER ANALYSIS, 2025–2034, (USD MILLION)
FIGURE 97 NEW ZEALAND SECURITY CURRENT AND FUTURE TYPE ANALYSIS, 2025–2034, (USD MILLION)
FIGURE 98 NEW ZEALAND SECURITY CURRENT AND FUTURE END USER ANALYSIS, 2025–2034, (USD MILLION)
FIGURE 99 INDIA SECURITY CURRENT AND FUTURE TYPE ANALYSIS, 2025–2034, (USD MILLION)
FIGURE 100 INDIA SECURITY CURRENT AND FUTURE END USER ANALYSIS, 2025–2034, (USD MILLION)
FIGURE 101 SINGAPORE SECURITY CURRENT AND FUTURE TYPE ANALYSIS, 2025–2034, (USD MILLION)
FIGURE 102 SINGAPORE SECURITY CURRENT AND FUTURE END USER ANALYSIS, 2025–2034, (USD MILLION)
FIGURE 103 THAILAND SECURITY CURRENT AND FUTURE TYPE ANALYSIS, 2025–2034, (USD MILLION)
FIGURE 104 THAILAND SECURITY CURRENT AND FUTURE END USER ANALYSIS, 2025–2034, (USD MILLION)
FIGURE 105 TAIWAN SECURITY CURRENT AND FUTURE TYPE ANALYSIS, 2025–2034, (USD MILLION)
FIGURE 106 TAIWAN SECURITY CURRENT AND FUTURE END USER ANALYSIS, 2025–2034, (USD MILLION)
FIGURE 107 MALAYSIA SECURITY CURRENT AND FUTURE TYPE ANALYSIS, 2025–2034, (USD MILLION)
FIGURE 108 MALAYSIA SECURITY CURRENT AND FUTURE END USER ANALYSIS, 2025–2034, (USD MILLION)
FIGURE 109 REST OF SEA AND SOUTH ASIA SECURITY CURRENT AND FUTURE TYPE ANALYSIS, 2025–2034, (USD MILLION)
FIGURE 110 REST OF SEA AND SOUTH ASIA SECURITY CURRENT AND FUTURE END USER ANALYSIS, 2025–2034, (USD MILLION)
FIGURE 111 MIDDLE EAST AND AFRICA SECURITY CURRENT AND FUTURE MARKET VOLUME SHARE REGIONAL ANALYSIS, 2025–2034, (USD MILLION)
FIGURE 112 GCC COUNTRIES SECURITY CURRENT AND FUTURE TYPE ANALYSIS, 2025–2034, (USD MILLION)
FIGURE 113 GCC COUNTRIES SECURITY CURRENT AND FUTURE END USER ANALYSIS, 2025–2034, (USD MILLION)
FIGURE 114 SAUDI ARABIA SECURITY CURRENT AND FUTURE TYPE ANALYSIS, 2025–2034, (USD MILLION)
FIGURE 115 SAUDI ARABIA SECURITY CURRENT AND FUTURE END USER ANALYSIS, 2025–2034, (USD MILLION)
FIGURE 116 UAE SECURITY CURRENT AND FUTURE TYPE ANALYSIS, 2025–2034, (USD MILLION)
FIGURE 117 UAE SECURITY CURRENT AND FUTURE END USER ANALYSIS, 2025–2034, (USD MILLION)
FIGURE 118 BAHRAIN SECURITY CURRENT AND FUTURE TYPE ANALYSIS, 2025–2034, (USD MILLION)
FIGURE 119 BAHRAIN SECURITY CURRENT AND FUTURE END USER ANALYSIS, 2025–2034, (USD MILLION)
FIGURE 120 KUWAIT SECURITY CURRENT AND FUTURE TYPE ANALYSIS, 2025–2034, (USD MILLION)
FIGURE 121 KUWAIT SECURITY CURRENT AND FUTURE END USER ANALYSIS, 2025–2034, (USD MILLION)
FIGURE 122 OMAN SECURITY CURRENT AND FUTURE TYPE ANALYSIS, 2025–2034, (USD MILLION)
FIGURE 123 OMAN SECURITY CURRENT AND FUTURE END USER ANALYSIS, 2025–2034, (USD MILLION)
FIGURE 124 QATAR SECURITY CURRENT AND FUTURE TYPE ANALYSIS, 2025–2034, (USD MILLION)
FIGURE 125 QATAR SECURITY CURRENT AND FUTURE END USER ANALYSIS, 2025–2034, (USD MILLION)
FIGURE 126 EGYPT SECURITY CURRENT AND FUTURE TYPE ANALYSIS, 2025–2034, (USD MILLION)
FIGURE 127 EGYPT SECURITY CURRENT AND FUTURE END USER ANALYSIS, 2025–2034, (USD MILLION)
FIGURE 128 NIGERIA SECURITY CURRENT AND FUTURE TYPE ANALYSIS, 2025–2034, (USD MILLION)
FIGURE 129 NIGERIA SECURITY CURRENT AND FUTURE END USER ANALYSIS, 2025–2034, (USD MILLION)
FIGURE 130 SOUTH AFRICA SECURITY CURRENT AND FUTURE TYPE ANALYSIS, 2025–2034, (USD MILLION)
FIGURE 131 SOUTH AFRICA SECURITY CURRENT AND FUTURE END USER ANALYSIS, 2025–2034, (USD MILLION)
FIGURE 132 ISRAEL SECURITY CURRENT AND FUTURE TYPE ANALYSIS, 2025–2034, (USD MILLION)
FIGURE 133 ISRAEL SECURITY CURRENT AND FUTURE END USER ANALYSIS, 2025–2034, (USD MILLION)
FIGURE 134 REST OF MEA SECURITY CURRENT AND FUTURE TYPE ANALYSIS, 2025–2034, (USD MILLION)
FIGURE 135 REST OF MEA SECURITY CURRENT AND FUTURE END USER ANALYSIS, 2025–2034, (USD MILLION)
FIGURE 136 U. S. MARKET SHARE ANALYSIS BY TYPE (2024)
FIGURE 137 U. S. MARKET SHARE ANALYSIS BY END USER (2024)
FIGURE 138 CANADA MARKET SHARE ANALYSIS BY TYPE (2024)
FIGURE 139 CANADA MARKET SHARE ANALYSIS BY END USER (2024)
FIGURE 140 MEXICO MARKET SHARE ANALYSIS BY TYPE (2024)
FIGURE 141 MEXICO MARKET SHARE ANALYSIS BY END USER (2024)
FIGURE 142 CHINA MARKET SHARE ANALYSIS BY TYPE (2024)
FIGURE 143 CHINA MARKET SHARE ANALYSIS BY END USER (2024)
FIGURE 144 JAPAN MARKET SHARE ANALYSIS BY TYPE (2024)
FIGURE 145 JAPAN MARKET SHARE ANALYSIS BY END USER (2024)
FIGURE 146 INDIA MARKET SHARE ANALYSIS BY TYPE (2024)
FIGURE 147 INDIA MARKET SHARE ANALYSIS BY END USER (2024)
FIGURE 148 SOUTH KOREA MARKET SHARE ANALYSIS BY TYPE (2024)
FIGURE 149 SOUTH KOREA MARKET SHARE ANALYSIS BY END USER (2024)
FIGURE 150 SAUDI ARABIA MARKET SHARE ANALYSIS BY TYPE (2024)
FIGURE 151 SAUDI ARABIA MARKET SHARE ANALYSIS BY END USER (2024)
FIGURE 152 UAE MARKET SHARE ANALYSIS BY TYPE (2024)
FIGURE 153 UAE MARKET SHARE ANALYSIS BY END USER (2024)
FIGURE 154 EGYPT MARKET SHARE ANALYSIS BY TYPE (2024)
FIGURE 155 EGYPT MARKET SHARE ANALYSIS BY END USER (2024)
FIGURE 156 NIGERIA MARKET SHARE ANALYSIS BY TYPE (2024)
FIGURE 157 NIGERIA MARKET SHARE ANALYSIS BY END USER (2024)
FIGURE 158 SOUTH AFRICA MARKET SHARE ANALYSIS BY TYPE (2024)
FIGURE 159 SOUTH AFRICA MARKET SHARE ANALYSIS BY END USER (2024)
FIGURE 160 GERMANY MARKET SHARE ANALYSIS BY TYPE (2024)
FIGURE 161 GERMANY MARKET SHARE ANALYSIS BY END USER (2024)
FIGURE 162 FRANCE MARKET SHARE ANALYSIS BY TYPE (2024)
FIGURE 163 FRANCE MARKET SHARE ANALYSIS BY END USER (2024)
FIGURE 164 UK MARKET SHARE ANALYSIS BY TYPE (2024)
FIGURE 165 UK MARKET SHARE ANALYSIS BY END USER (2024)
FIGURE 166 SPAIN MARKET SHARE ANALYSIS BY TYPE (2024)
FIGURE 167 SPAIN MARKET SHARE ANALYSIS BY END USER (2024)
FIGURE 168 ITALY MARKET SHARE ANALYSIS BY TYPE (2024)
FIGURE 169 ITALY MARKET SHARE ANALYSIS BY END USER (2024)
FIGURE 170 BRAZIL MARKET SHARE ANALYSIS BY TYPE (2024)
FIGURE 171 BRAZIL MARKET SHARE ANALYSIS BY END USER (2024)
FIGURE 172 ARGENTINA MARKET SHARE ANALYSIS BY TYPE (2024)
FIGURE 173 ARGENTINA MARKET SHARE ANALYSIS BY END USER (2024)
FIGURE 174 COLUMBIA MARKET SHARE ANALYSIS BY TYPE (2024)
FIGURE 175 COLUMBIA MARKET SHARE ANALYSIS BY END USER (2024)
FIGURE 176 GLOBAL SECURITY CURRENT AND FUTURE MARKET KEY COUNTRY LEVEL ANALYSIS, 2024–2034, (USD MILLION)
FIGURE 177 FINANCIAL OVERVIEW:
Key Players Analysis
Honeywell International Inc.: Honeywell maintains a dominant position in the security market through its comprehensive portfolio of integrated security solutions spanning video surveillance, access control, intrusion detection, and fire safety systems. The company leverages its industrial automation expertise to deliver sophisticated security platforms that integrate seamlessly with building management systems. Honeywell's competitive advantage lies in its ability to provide end-to-end security solutions for large enterprise customers, combining hardware, software, and services into unified offerings. The company's strong research and development capabilities enable continuous innovation in AI-powered analytics, cloud-based security management, and mobile security applications.
Johnson Controls: Johnson Controls operates as a leading security solutions provider with significant market share through its comprehensive building technologies and security systems portfolio. The company's competitive strength stems from its ability to integrate security solutions with broader building automation and energy management systems, providing customers with holistic facility management capabilities. Johnson Controls maintains strong relationships with commercial and industrial customers through its extensive service network and technical expertise. The company's strategic focus on digital transformation and smart building technologies positions it well for future growth in integrated security markets.
Axis Communications AB: Axis Communications holds a leading position in the video surveillance market, particularly in network cameras and video management software solutions. The company's competitive differentiation lies in its focus on IP-based video surveillance technologies and open platform approach that enables integration with third-party security systems. Axis maintains strong technical capabilities in video analytics, artificial intelligence, and edge computing, allowing it to deliver advanced surveillance solutions that provide actionable insights beyond basic monitoring. The company's commitment to cybersecurity and privacy protection helps maintain customer trust in an increasingly security-conscious market environment.
Market Key Players
Apex Fabrication & Design, Inc.
Johnson Controls
ASSA ABLOY
Axis Communications AB
Perimeter Protection Germany GmbH
Honeywell International, Inc.
ZABAG Security Engineering GmbH
Teledyne FLIR LLC
Apex Perimeter Protection
Anixter Inc.
Drivers:
Increasing Cyber Threats and Terrorism:
The escalating frequency and sophistication of cyber-attacks, combined with persistent terrorism threats, serve as the primary driver for security market growth. Organizations worldwide face an unprecedented level of digital and physical security challenges, including state-sponsored cyber warfare, ransomware attacks, data breaches, and terrorist activities. The FBI reported a 6% increase in hate crimes in 2020, illustrating the pressing need for robust security solutions. Government statistics indicate rising criminal activities across multiple sectors, compelling businesses to invest in comprehensive security infrastructure. The interconnected nature of modern digital systems amplifies the potential impact of security breaches, making preventive measures essential for business continuity. This threat environment drives continuous innovation in security technologies and increases demand for integrated solutions that can address both physical and cyber security challenges simultaneously.
Regulatory Compliance and Government Mandates:
Stringent regulatory frameworks and government mandates significantly accelerate security market growth by establishing mandatory security standards across industries. Regulations such as GDPR in Europe and CCPA in California impose heavy penalties for data protection failures, compelling organizations to prioritize security investments. Government spending on national security, defense modernization, and critical infrastructure protection creates substantial market demand. Compliance requirements in sectors like banking, healthcare, and telecommunications drive consistent security spending as organizations must meet specific security standards to maintain operational licenses. These regulatory pressures ensure sustained market growth as companies view security investments as necessary compliance costs rather than optional expenditures.
Restraints:
High Implementation and Maintenance Costs:
Significant financial barriers associated with advanced security systems implementation and ongoing maintenance present major market restraints, particularly affecting smaller businesses and organizations with limited budgets. Initial deployment costs for comprehensive security infrastructure can be substantial, including hardware procurement, software licensing, installation, and system integration expenses. Ongoing maintenance requirements, regular upgrades, and the need for specialized personnel create continuous financial obligations that strain organizational resources. Many small and medium enterprises find it challenging to justify large security investments when facing competing operational priorities. Additionally, the rapid pace of technological advancement necessitates frequent system updates and replacements, further increasing the total cost of ownership and creating budget planning challenges for organizations.
Skills Shortage and Technical Complexity:
The security industry faces a critical shortage of skilled professionals capable of managing, operating, and maintaining sophisticated security systems, creating implementation and operational challenges. The complexity of modern security solutions requires specialized knowledge in cybersecurity, network management, system integration, and threat analysis. Organizations struggle to find qualified personnel who can effectively utilize advanced security technologies and respond appropriately to security incidents. This skills gap leads to suboptimal system utilization, increased vulnerability to security breaches, and higher operational costs as organizations compete for limited talent. The rapid evolution of security technologies exacerbates this challenge, requiring continuous training and professional development investments that many organizations find difficult to sustain.
Opportunities:
Artificial Intelligence and Machine Learning Integration:
The integration of AI and ML technologies presents significant growth opportunities by enhancing threat detection capabilities, automating security responses, and providing predictive analytics for proactive security management. The global AI in security market is expected to significantly, indicating robust expansion potential. AI-powered security systems can analyze vast amounts of data in real-time, identify patterns indicating potential threats, and respond faster than traditional security methods. Machine learning algorithms continuously improve their threat detection accuracy, reducing false positives and enhancing overall security effectiveness. Organizations increasingly recognize AI's potential to address the skills shortage by automating routine security tasks and providing intelligent insights for security decision-making.
Cloud Security and Remote Monitoring Solutions:
The shift toward cloud-based security solutions and remote monitoring capabilities creates substantial market opportunities as organizations seek scalable, flexible, and cost-effective security alternatives. Cloud deployment models enable organizations to access advanced security technologies without significant upfront investments in hardware infrastructure. Remote monitoring capabilities allow security providers to offer managed services, creating new revenue streams while providing clients with 24/7 security oversight. The COVID-19 pandemic accelerated remote work adoption, increasing demand for cloud-based security solutions that can protect distributed workforces and digital assets. Mobile security applications and IoT integration further expand the addressable market by enabling security management from anywhere and extending protection to connected devices.
Trends:
Integration of IoT and Smart Technologies:
The convergence of Internet of Things devices with security systems is transforming traditional security approaches by creating interconnected, intelligent security ecosystems. Smart security devices can communicate with each other, share threat intelligence, and coordinate responses across multiple security layers. IoT sensors provide granular monitoring capabilities, detecting environmental changes, unauthorized access attempts, and equipment malfunctions in real-time. This integration enables predictive maintenance, reduces false alarms, and improves overall security system reliability. Organizations benefit from centralized security management platforms that provide comprehensive visibility across all connected security devices and systems.
Zero Trust Security Architecture Adoption:
The widespread adoption of Zero Trust security models represents a fundamental shift from perimeter-based security to identity-centric protection strategies. Zero Trust assumes no inherent trust in any user, device, or network component, requiring continuous verification and authorization for all access requests. This approach addresses the limitations of traditional security models in protecting against insider threats and advanced persistent attacks. Organizations are implementing Zero Trust principles across their physical and digital security infrastructure, driving demand for advanced authentication technologies, continuous monitoring solutions, and integrated security platforms that can enforce granular access controls.
Recent Development
In July 2025: Scientists at the prestigious La Sapienza University of Rome have developed groundbreaking research technology called WhoFi, representing a paradigm shift in human identification methodologies through wireless signal analysis. This innovative system demonstrates the capability to accurately identify specific individuals by examining and interpreting the unique patterns within Wi-Fi signal transmissions, opening unprecedented possibilities for security applications and surveillance technologies.
In January 2025: Safer Group has introduced their innovative S1 Security Pod to the UK market, marking a significant advancement in intelligent retail security solutions. This sophisticated, tamper-proof security system combines artificial intelligence-powered surveillance cameras, advanced motion detection sensors, and powerful audible deterrents to effectively combat retail crime and antisocial activities.