Global Security Service Edge (SSE) Market Size, Share, Analysis By Component (Solutions, Services), By Organization Size (SMEs, Large Enterprises), By Deployment Mode (Cloud-Based, On-Premises, Hybrid), By End User (BFSI, IT & Telecom, Healthcare, Government & Public Sector, Manufacturing, Retail & E-commerce, Energy & Utilities), Industry Region & Key Players-Industry Segment Overview, Market Dynamics, Competitive Strategies, Trends & Forecast 2025-2034
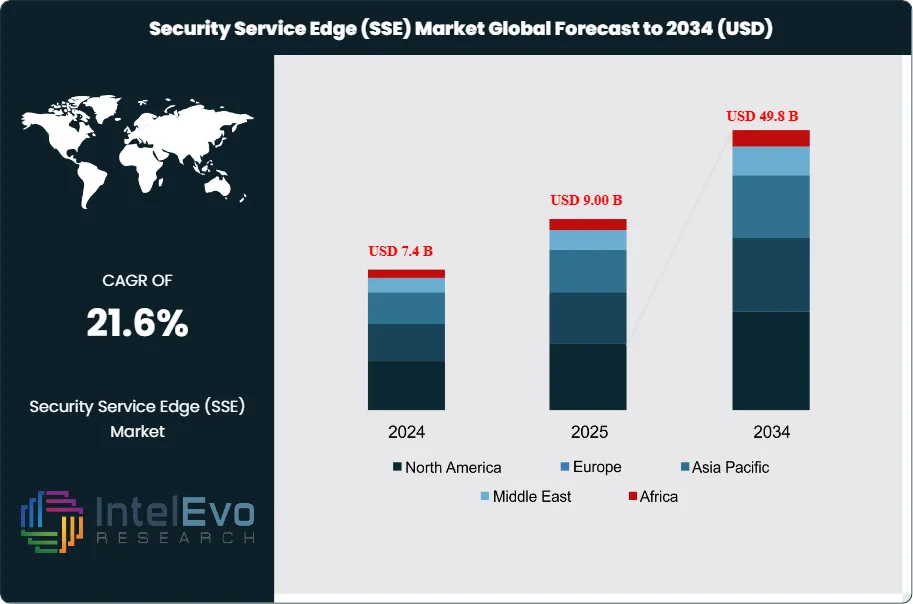
The Global Security Service Edge (SSE) Market size is expected to be worth around USD 49.8 billion by 2034, up from USD 7.4 billion in 2024, growing at a CAGR of 21.6% during the forecast period from 2025 to 2034. The market’s rapid growth is driven by the surge in remote work adoption, cloud migration, and increasing cybersecurity threats that demand integrated cloud-based security frameworks. SSE solutions combining Secure Web Gateway (SWG), Cloud Access Security Broker (CASB), and Zero Trust Network Access (ZTNA) are becoming essential for modern enterprises. As organizations embrace hybrid IT infrastructures, the demand for scalable and unified security services will continue to accelerate globally.
A rapidly changing sector of the cybersecurity landscape, the Security Service Edge (SSE) industry is characterized by the incorporation of security features into cloud-based infrastructure. SSE solutions give companies a complete architecture that lets them instantly secure their networks, data, and apps. These solutions, which are designed to meet the growing need for security in distributed contexts, include tools like zero-trust network access (ZTNA), cloud access security brokers, and secure web gateways. As businesses move more and more to remote work models and hybrid cloud architectures, the necessity to protect data and the growing acceptance of cloud technologies are driving the SSE market.
One of the main factors propelling the SSE market's growth is the adoption of Zero Trust security methods. In order to secure digital assets even in a setting without a perimeter, zero trust principles emphasize confirming each user and device trying to access network resources. This concept is in line with the increasing requirement for businesses to safeguard confidential information, particularly as remote and hybrid workforces become more common. SSE solutions are increasingly essential in a number of areas, such as government, manufacturing, healthcare, and finance. For instance, SSE is being used by financial institutions to protect sensitive financial data and guarantee adherence to strict laws like GDPR and PCI DSS. SSE aids in the protection of patient data in the healthcare industry, particularly as the use of electronic health records (EHR) grows. SSE tackles the hazards associated with industrial systems and connected devices in manufacturing. Strong security frameworks offered by SSE solutions are in high demand due to the expanding requirement for remote access, secure cloud collaboration, and compliance across industries.
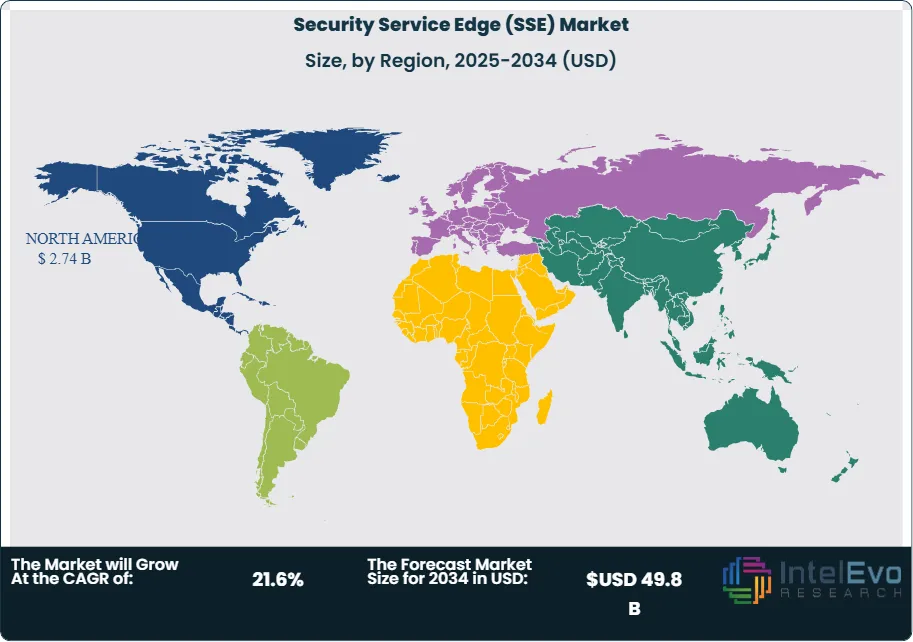
North America is considered to have the highest growth market for Security Service Edge (SSE) mainly due to high regulatory concerns and increasing demand for safety and security towards data. Furthermore, the need for sophisticated security solutions has increased due to a high degree of digitization. The capacity of SSE to safeguard edge settings becomes increasingly important as more and more companies embrace remote and hybrid work practices. Additionally, a strong ecosystem of cybersecurity providers and the region's established technology infrastructure support the expansion of SSE services. Adoption of SSE solutions is further accelerated by the focus on data protection and compliance, which makes North America a vital hub for the thriving SSE sector.
COVID 19 has had a mixed effect on the market size of Security Service Edge (SSE). Businesses' approaches to cybersecurity were profoundly impacted by the COVID-19 epidemic, which sped up the adoption of new security concepts and technology. The growing use of remote work during this period was one of the most significant changes, forcing businesses to reevaluate their security protocols. One important way to address these changing demands is using Security Service Edge (SSE).
Key Takeaways
Market Growth: The Security Service Edge (SSE) market is expected to reach USD 49.8 billion by 2034, growing at a robust CAGR of 21.6%, indicating strong market expansion.
Component Segment Dominance: The component segment is dominated by solutions, accounting for over 58% of the market share. The need to strengthen cybersecurity in ever-changing digital environments is driving the growing use of Security Service Edge (SSE) solutions, which include technologies such as FWaaS (Firewall as a Service), ZTNA (Zero Trust Network Access), SWG (Secure Web Gateways), CASB (Cloud Access Security Broker), and others.
Industry Vertical Segment Insights: BFSI is anticipated to hold the largest market share, reflecting the sector’s need for robust security measures. Because of the high value of the data involved and the growing sophistication of cyber threats, the BFSI sector confronts many cybersecurity challenges.
Driver: The significance of putting strong security measures in place at the edge to identify and stop threats before they reach vital assets is becoming more widely recognized as a result of the rise in cyberattacks that target businesses. Advanced threat detection and response capabilities are frequently included in SSE solutions, which support market growth dynamics by fostering a more proactive and efficient security posture.
Restraint: Concerns about data privacy and compliance are serious obstacles for the SSE industry. Concerns about maintaining regulatory compliance and safeguarding user privacy grew as businesses processed and stored sensitive data at the edge more and more. It may be difficult to adopt SSE solutions while adhering to various industry standards and data protection rules, especially in highly regulated industries like healthcare and banking.
Opportunity: Significant prospects exist in the Security Service Edge market due to the growing demand for hybrid cloud solutions, the need for improved compliance management, the development of AI-powered security, and the growth of small and mid-sized enterprises.
Trend: It is anticipated that the use of AI and ML technology in SSE solutions would increase. These tools can improve threat detection, automate security incident response, and offer predictive analytics to spot possible dangers. SSE platforms may become more flexible and able to respond to new cyberthreats instantly by utilizing AI and ML.
Regional Analysis: The market for security services is expanding in North America. The region's high degree of digitization and proactive commitment to cybersecurity have increased demand for cutting-edge security solutions. The capacity of SSE to safeguard edge settings becomes increasingly important as more and more companies embrace remote and hybrid work practices.
Component Analysis:
Security Service Edge (SSE) market can be categorized by material. These include solutions and services. The SSE framework's solutions comprise a range of hardware and software for controlling and safeguarding network access to data and apps. Secure online gateways, cloud access security brokers, and zero-trust security network access are just a few of the integrated security features that these systems are intended to provide. In the SSE market, services are just as important as solutions, which have the largest market share. The deployment, operation, and maintenance of SSE systems are supported by professional and managed services. These services are crucial for businesses who want to improve their security measures without making large upfront costs or that lack the internal knowledge to handle complicated security environments.
End User Industry Analysis:
There are three categories for industry verticals: the Banking, Financial Services, and Insurance (BFSI) sector. The BFSI sector holds the largest market share during the forecast period. The sector's stringent legal requirements and the vital necessity for strong data protection procedures to safeguard sensitive financial data are the main causes of this dominance.
Because of the high value of the data involved and the growing sophistication of cyber threats, the BFSI sector confronts many cybersecurity challenges. In order to provide safe data access, guard against data breaches, and adhere to national and international laws like GDPR, PCI-DSS, and others that need stringent data security protocols, financial institutions are thus major users of SSE solutions.
Region Analysis:
North America Leads With 37% Market Share in the Security Service Edge (SSE) Market. North America and Asia-Pacific are the regions with the highest market shares for Security Service Edge (SSE), driven by increased need for cloud security solutions and advanced cybersecurity infrastructure. North America holds approximately 37% of the market share, owing to the increasing cyberthreats and stringent data protection laws in sectors like government, healthcare, and finance. North America's early adoption of cloud technology, the abundance of cybersecurity providers, and sophisticated regulatory frameworks like HIPAA and GDPR are important reasons contributing to its substantial market dominance. The region's focus on safeguarding cloud environments and remote workers also makes a substantial contribution to the Security Service Edge (SSE) market's expansion.
By Component (Solutions, (Secure Web Gateway (SWG), Cloud Access Security Broker (CASB), Zero Trust Network Access (ZTNA), Firewall as a Service (FWaaS), Data Loss Prevention (DLP)), Services, (Professional Services, Managed Services)), By Organization Size (Small and Medium Enterprises (SMEs), Large Enterprises), By Deployment Mode (Cloud-Based Deployment, On-Premises Deployment, Hybrid Deployment), By End User Industry (BFSI, IT & Telecommunications, Healthcare, Government & Public Sector, Manufacturing, Retail & E-commerce, Energy & Utilities, Others (Education, Transportation, etc.))
Research Methodology
Primary Research- 100 Interviews of Stakeholders
Secondary Research
Desk Research
Regional scope
North America (United States, Canada, Mexico)
Latin America (Brazil, Argentina, Columbia)
East Asia And Pacific (China, Japan, South Korea, Australia, Cambodia, Fiji, Indonesia)
Sea And South Asia (India, Singapore, Thailand, Taiwan, Malaysia)
Eastern Europe (Poland, Russia, Czech Republic, Romania)
Western Europe (Germany, U.K., France, Spain, Itlay)
Middle East & Africa (GCC Countries, Egypt, Nigeria, South Africa, Israel)
Customization for segments, region/country-level will be provided. Moreover, additional customization can be done based on the requirements.
Pricing and Purchase Options
Avail customized purchase options to meet your exact research needs. We have three licenses to opt for: Single User License, Multi-User License (Up to 5 Users), Corporate Use License (Unlimited User and Printable PDF).
TABLE OF CONTENTS
1. EXECUTIVE SUMMARY
1.1. MARKET SNAPSHOT
1.2. KEY FINDINGS & INSIGHTS
1.3. ANALYST RECOMMENDATIONS
1.4. FUTURE OUTLOOK
2. RESEARCH METHODOLOGY
2.1. MARKET DEFINITION & SCOPE
2.2. RESEARCH OBJECTIVES: PRIMARY & SECONDARY DATA SOURCES
2.3. DATA COLLECTION SOURCES
2.3.1. COVERAGE OF 100+ PRIMARY RESEARCH/CONSULTATION CALLS WITH INDUSTRY STAKEHOLDERS
FIGURE 17 NORTH AMERICA SECURITY SERVICE EDGE (SSE) CURRENT AND FUTURE TYPE ANALYSIS, 2025–2034, (USD MILLION)
FIGURE 18 NORTH AMERICA SECURITY SERVICE EDGE (SSE) CURRENT AND FUTURE END USER ANALYSIS, 2025–2034, (USD MILLION)
FIGURE 19 MARKET SHARE BY COUNTRY
FIGURE 20 LATIN AMERICA SECURITY SERVICE EDGE (SSE) CURRENT AND FUTURE TYPE ANALYSIS, 2025–2034, (USD MILLION)
FIGURE 21 LATIN AMERICA SECURITY SERVICE EDGE (SSE) CURRENT AND FUTURE END USER ANALYSIS, 2025–2034, (USD MILLION)
FIGURE 22 MARKET SHARE BY COUNTRY
FIGURE 23 EASTERN EUROPE SECURITY SERVICE EDGE (SSE) CURRENT AND FUTURE TYPE ANALYSIS, 2025–2034, (USD MILLION)
FIGURE 24 EASTERN EUROPE SECURITY SERVICE EDGE (SSE) CURRENT AND FUTURE END USER ANALYSIS, 2025–2034, (USD MILLION)
FIGURE 25 MARKET SHARE BY COUNTRY
FIGURE 26 WESTERN EUROPE SECURITY SERVICE EDGE (SSE) CURRENT AND FUTURE TYPE ANALYSIS, 2025–2034, (USD MILLION)
FIGURE 27 WESTERN EUROPE SECURITY SERVICE EDGE (SSE) CURRENT AND FUTURE END USER ANALYSIS, 2025–2034, (USD MILLION)
FIGURE 28 MARKET SHARE BY COUNTRY
FIGURE 29 EAST ASIA AND PACIFIC SECURITY SERVICE EDGE (SSE) CURRENT AND FUTURE TYPE ANALYSIS, 2025–2034, (USD MILLION)
FIGURE 30 EAST ASIA AND PACIFIC SECURITY SERVICE EDGE (SSE) CURRENT AND FUTURE END USER ANALYSIS, 2025–2034, (USD MILLION)
FIGURE 31 MARKET SHARE BY COUNTRY
FIGURE 32 SEA AND SOUTH ASIA SECURITY SERVICE EDGE (SSE) CURRENT AND FUTURE TYPE ANALYSIS, 2025–2034, (USD MILLION)
FIGURE 33 SEA AND SOUTH ASIA SECURITY SERVICE EDGE (SSE) CURRENT AND FUTURE END USER ANALYSIS, 2025–2034, (USD MILLION)
FIGURE 34 MARKET SHARE BY COUNTRY
FIGURE 35 MIDDLE EAST AND AFRICA SECURITY SERVICE EDGE (SSE) CURRENT AND FUTURE TYPE ANALYSIS, 2025–2034, (USD MILLION)
FIGURE 36 MIDDLE EAST AND AFRICA SECURITY SERVICE EDGE (SSE) CURRENT AND FUTURE END USER ANALYSIS, 2025–2034, (USD MILLION)
FIGURE 37 NORTH AMERICA SECURITY SERVICE EDGE (SSE) CURRENT AND FUTURE MARKET VOLUME SHARE REGIONAL ANALYSIS, 2025–2034, (USD MILLION)
FIGURE 38 U.S. SECURITY SERVICE EDGE (SSE) CURRENT AND FUTURE TYPE ANALYSIS, 2025–2034, (USD MILLION)
FIGURE 39 U.S. SECURITY SERVICE EDGE (SSE) CURRENT AND FUTURE END USER ANALYSIS, 2025–2034, (USD MILLION)
FIGURE 40 CANADA SECURITY SERVICE EDGE (SSE) CURRENT AND FUTURE TYPE ANALYSIS, 2025–2034, (USD MILLION)
FIGURE 41 CANADA SECURITY SERVICE EDGE (SSE) CURRENT AND FUTURE END USER ANALYSIS, 2025–2034, (USD MILLION)
FIGURE 42 LATIN AMERICA SECURITY SERVICE EDGE (SSE) CURRENT AND FUTURE MARKET VOLUME SHARE REGIONAL ANALYSIS, 2025–2034, (USD MILLION)
FIGURE 43 MEXICO SECURITY SERVICE EDGE (SSE) CURRENT AND FUTURE TYPE ANALYSIS, 2025–2034, (USD MILLION)
FIGURE 44 MEXICO SECURITY SERVICE EDGE (SSE) CURRENT AND FUTURE END USER ANALYSIS, 2025–2034, (USD MILLION)
FIGURE 45 BRAZIL SECURITY SERVICE EDGE (SSE) CURRENT AND FUTURE TYPE ANALYSIS, 2025–2034, (USD MILLION)
FIGURE 46 BRAZIL SECURITY SERVICE EDGE (SSE) CURRENT AND FUTURE END USER ANALYSIS, 2025–2034, (USD MILLION)
FIGURE 47 ARGENTINA SECURITY SERVICE EDGE (SSE) CURRENT AND FUTURE TYPE ANALYSIS, 2025–2034, (USD MILLION)
FIGURE 48 ARGENTINA SECURITY SERVICE EDGE (SSE) CURRENT AND FUTURE END USER ANALYSIS, 2025–2034, (USD MILLION)
FIGURE 49 COLUMBIA SECURITY SERVICE EDGE (SSE) CURRENT AND FUTURE TYPE ANALYSIS, 2025–2034, (USD MILLION)
FIGURE 50 COLUMBIA SECURITY SERVICE EDGE (SSE) CURRENT AND FUTURE END USER ANALYSIS, 2025–2034, (USD MILLION)
FIGURE 51 REST OF LATIN AMERICA SECURITY SERVICE EDGE (SSE) CURRENT AND FUTURE TYPE ANALYSIS, 2025–2034, (USD MILLION)
FIGURE 52 REST OF LATIN AMERICA SECURITY SERVICE EDGE (SSE) CURRENT AND FUTURE END USER ANALYSIS, 2025–2034, (USD MILLION)
FIGURE 53 EASTERN EUROPE SECURITY SERVICE EDGE (SSE) CURRENT AND FUTURE MARKET VOLUME SHARE REGIONAL ANALYSIS, 2025–2034, (USD MILLION)
FIGURE 54 POLAND SECURITY SERVICE EDGE (SSE) CURRENT AND FUTURE TYPE ANALYSIS, 2025–2034, (USD MILLION)
FIGURE 55 POLAND SECURITY SERVICE EDGE (SSE) CURRENT AND FUTURE END USER ANALYSIS, 2025–2034, (USD MILLION)
FIGURE 56 RUSSIA SECURITY SERVICE EDGE (SSE) CURRENT AND FUTURE TYPE ANALYSIS, 2025–2034, (USD MILLION)
FIGURE 57 RUSSIA SECURITY SERVICE EDGE (SSE) CURRENT AND FUTURE END USER ANALYSIS, 2025–2034, (USD MILLION)
FIGURE 58 CZECH REPUBLIC SECURITY SERVICE EDGE (SSE) CURRENT AND FUTURE TYPE ANALYSIS, 2025–2034, (USD MILLION)
FIGURE 59 CZECH REPUBLIC SECURITY SERVICE EDGE (SSE) CURRENT AND FUTURE END USER ANALYSIS, 2025–2034, (USD MILLION)
FIGURE 60 ROMANIA SECURITY SERVICE EDGE (SSE) CURRENT AND FUTURE TYPE ANALYSIS, 2025–2034, (USD MILLION)
FIGURE 61 ROMANIA SECURITY SERVICE EDGE (SSE) CURRENT AND FUTURE END USER ANALYSIS, 2025–2034, (USD MILLION)
FIGURE 62 REST OF EASTERN EUROPE SECURITY SERVICE EDGE (SSE) CURRENT AND FUTURE TYPE ANALYSIS, 2025–2034, (USD MILLION)
FIGURE 63 REST OF EASTERN EUROPE SECURITY SERVICE EDGE (SSE) CURRENT AND FUTURE END USER ANALYSIS, 2025–2034, (USD MILLION)
FIGURE 64 WESTERN EUROPE SECURITY SERVICE EDGE (SSE) CURRENT AND FUTURE MARKET VOLUME SHARE REGIONAL ANALYSIS, 2025–2034, (USD MILLION)
FIGURE 65 GERMANY SECURITY SERVICE EDGE (SSE) CURRENT AND FUTURE TYPE ANALYSIS, 2025–2034, (USD MILLION)
FIGURE 66 GERMANY SECURITY SERVICE EDGE (SSE) CURRENT AND FUTURE END USER ANALYSIS, 2025–2034, (USD MILLION)
FIGURE 67 FRANCE SECURITY SERVICE EDGE (SSE) CURRENT AND FUTURE TYPE ANALYSIS, 2025–2034, (USD MILLION)
FIGURE 68 FRANCE SECURITY SERVICE EDGE (SSE) CURRENT AND FUTURE END USER ANALYSIS, 2025–2034, (USD MILLION)
FIGURE 69 UK SECURITY SERVICE EDGE (SSE) CURRENT AND FUTURE TYPE ANALYSIS, 2025–2034, (USD MILLION)
FIGURE 70 UK SECURITY SERVICE EDGE (SSE) CURRENT AND FUTURE END USER ANALYSIS, 2025–2034, (USD MILLION)
FIGURE 71 SPAIN SECURITY SERVICE EDGE (SSE) CURRENT AND FUTURE TYPE ANALYSIS, 2025–2034, (USD MILLION)
FIGURE 72 SPAIN SECURITY SERVICE EDGE (SSE) CURRENT AND FUTURE END USER ANALYSIS, 2025–2034, (USD MILLION)
FIGURE 73 ITALY SECURITY SERVICE EDGE (SSE) CURRENT AND FUTURE TYPE ANALYSIS, 2025–2034, (USD MILLION)
FIGURE 74 ITALY SECURITY SERVICE EDGE (SSE) CURRENT AND FUTURE END USER ANALYSIS, 2025–2034, (USD MILLION)
FIGURE 75 REST OF WESTERN EUROPE SECURITY SERVICE EDGE (SSE) CURRENT AND FUTURE TYPE ANALYSIS, 2025–2034, (USD MILLION)
FIGURE 76 REST OF WESTERN EUROPE SECURITY SERVICE EDGE (SSE) CURRENT AND FUTURE END USER ANALYSIS, 2025–2034, (USD MILLION)
FIGURE 77 EAST ASIA AND PACIFIC SECURITY SERVICE EDGE (SSE) CURRENT AND FUTURE MARKET VOLUME SHARE REGIONAL ANALYSIS, 2025–2034, (USD MILLION)
FIGURE 78 CHINA SECURITY SERVICE EDGE (SSE) CURRENT AND FUTURE TYPE ANALYSIS, 2025–2034, (USD MILLION)
FIGURE 79 CHINA SECURITY SERVICE EDGE (SSE) CURRENT AND FUTURE END USER ANALYSIS, 2025–2034, (USD MILLION)
FIGURE 80 JAPAN SECURITY SERVICE EDGE (SSE) CURRENT AND FUTURE TYPE ANALYSIS, 2025–2034, (USD MILLION)
FIGURE 81 JAPAN SECURITY SERVICE EDGE (SSE) CURRENT AND FUTURE END USER ANALYSIS, 2025–2034, (USD MILLION)
FIGURE 82 AUSTRALIA SECURITY SERVICE EDGE (SSE) CURRENT AND FUTURE TYPE ANALYSIS, 2025–2034, (USD MILLION)
FIGURE 83 AUSTRALIA SECURITY SERVICE EDGE (SSE) CURRENT AND FUTURE END USER ANALYSIS, 2025–2034, (USD MILLION)
FIGURE 84 CAMBODIA SECURITY SERVICE EDGE (SSE) CURRENT AND FUTURE TYPE ANALYSIS, 2025–2034, (USD MILLION)
FIGURE 85 CAMBODIA SECURITY SERVICE EDGE (SSE) CURRENT AND FUTURE END USER ANALYSIS, 2025–2034, (USD MILLION)
FIGURE 86 FIJI SECURITY SERVICE EDGE (SSE) CURRENT AND FUTURE TYPE ANALYSIS, 2025–2034, (USD MILLION)
FIGURE 87 FIJI SECURITY SERVICE EDGE (SSE) CURRENT AND FUTURE END USER ANALYSIS, 2025–2034, (USD MILLION)
FIGURE 88 INDONESIA SECURITY SERVICE EDGE (SSE) CURRENT AND FUTURE TYPE ANALYSIS, 2025–2034, (USD MILLION)
FIGURE 89 INDONESIA SECURITY SERVICE EDGE (SSE) CURRENT AND FUTURE END USER ANALYSIS, 2025–2034, (USD MILLION)
FIGURE 90 SOUTH KOREA SECURITY SERVICE EDGE (SSE) CURRENT AND FUTURE TYPE ANALYSIS, 2025–2034, (USD MILLION)
FIGURE 91 SOUTH KOREA SECURITY SERVICE EDGE (SSE) CURRENT AND FUTURE END USER ANALYSIS, 2025–2034, (USD MILLION)
FIGURE 92 REST OF EAST ASIA AND PACIFIC SECURITY SERVICE EDGE (SSE) CURRENT AND FUTURE TYPE ANALYSIS, 2025–2034, (USD MILLION)
FIGURE 93 REST OF EAST ASIA AND PACIFIC SECURITY SERVICE EDGE (SSE) CURRENT AND FUTURE END USER ANALYSIS, 2025–2034, (USD MILLION)
FIGURE 94 SEA AND SOUTH ASIA SECURITY SERVICE EDGE (SSE) CURRENT AND FUTURE MARKET VOLUME SHARE REGIONAL ANALYSIS, 2025–2034, (USD MILLION)
FIGURE 95 BANGLADESH SECURITY SERVICE EDGE (SSE) CURRENT AND FUTURE TYPE ANALYSIS, 2025–2034, (USD MILLION)
FIGURE 96 BANGLADESH SECURITY SERVICE EDGE (SSE) CURRENT AND FUTURE END USER ANALYSIS, 2025–2034, (USD MILLION)
FIGURE 97 NEW ZEALAND SECURITY SERVICE EDGE (SSE) CURRENT AND FUTURE TYPE ANALYSIS, 2025–2034, (USD MILLION)
FIGURE 98 NEW ZEALAND SECURITY SERVICE EDGE (SSE) CURRENT AND FUTURE END USER ANALYSIS, 2025–2034, (USD MILLION)
FIGURE 99 INDIA SECURITY SERVICE EDGE (SSE) CURRENT AND FUTURE TYPE ANALYSIS, 2025–2034, (USD MILLION)
FIGURE 100 INDIA SECURITY SERVICE EDGE (SSE) CURRENT AND FUTURE END USER ANALYSIS, 2025–2034, (USD MILLION)
FIGURE 101 SINGAPORE SECURITY SERVICE EDGE (SSE) CURRENT AND FUTURE TYPE ANALYSIS, 2025–2034, (USD MILLION)
FIGURE 102 SINGAPORE SECURITY SERVICE EDGE (SSE) CURRENT AND FUTURE END USER ANALYSIS, 2025–2034, (USD MILLION)
FIGURE 103 THAILAND SECURITY SERVICE EDGE (SSE) CURRENT AND FUTURE TYPE ANALYSIS, 2025–2034, (USD MILLION)
FIGURE 104 THAILAND SECURITY SERVICE EDGE (SSE) CURRENT AND FUTURE END USER ANALYSIS, 2025–2034, (USD MILLION)
FIGURE 105 TAIWAN SECURITY SERVICE EDGE (SSE) CURRENT AND FUTURE TYPE ANALYSIS, 2025–2034, (USD MILLION)
FIGURE 106 TAIWAN SECURITY SERVICE EDGE (SSE) CURRENT AND FUTURE END USER ANALYSIS, 2025–2034, (USD MILLION)
FIGURE 107 MALAYSIA SECURITY SERVICE EDGE (SSE) CURRENT AND FUTURE TYPE ANALYSIS, 2025–2034, (USD MILLION)
FIGURE 108 MALAYSIA SECURITY SERVICE EDGE (SSE) CURRENT AND FUTURE END USER ANALYSIS, 2025–2034, (USD MILLION)
FIGURE 109 REST OF SEA AND SOUTH ASIA SECURITY SERVICE EDGE (SSE) CURRENT AND FUTURE TYPE ANALYSIS, 2025–2034, (USD MILLION)
FIGURE 110 REST OF SEA AND SOUTH ASIA SECURITY SERVICE EDGE (SSE) CURRENT AND FUTURE END USER ANALYSIS, 2025–2034, (USD MILLION)
FIGURE 111 MIDDLE EAST AND AFRICA SECURITY SERVICE EDGE (SSE) CURRENT AND FUTURE MARKET VOLUME SHARE REGIONAL ANALYSIS, 2025–2034, (USD MILLION)
FIGURE 112 GCC COUNTRIES SECURITY SERVICE EDGE (SSE) CURRENT AND FUTURE TYPE ANALYSIS, 2025–2034, (USD MILLION)
FIGURE 113 GCC COUNTRIES SECURITY SERVICE EDGE (SSE) CURRENT AND FUTURE END USER ANALYSIS, 2025–2034, (USD MILLION)
FIGURE 114 SAUDI ARABIA SECURITY SERVICE EDGE (SSE) CURRENT AND FUTURE TYPE ANALYSIS, 2025–2034, (USD MILLION)
FIGURE 115 SAUDI ARABIA SECURITY SERVICE EDGE (SSE) CURRENT AND FUTURE END USER ANALYSIS, 2025–2034, (USD MILLION)
FIGURE 116 UAE SECURITY SERVICE EDGE (SSE) CURRENT AND FUTURE TYPE ANALYSIS, 2025–2034, (USD MILLION)
FIGURE 117 UAE SECURITY SERVICE EDGE (SSE) CURRENT AND FUTURE END USER ANALYSIS, 2025–2034, (USD MILLION)
FIGURE 118 BAHRAIN SECURITY SERVICE EDGE (SSE) CURRENT AND FUTURE TYPE ANALYSIS, 2025–2034, (USD MILLION)
FIGURE 119 BAHRAIN SECURITY SERVICE EDGE (SSE) CURRENT AND FUTURE END USER ANALYSIS, 2025–2034, (USD MILLION)
FIGURE 120 KUWAIT SECURITY SERVICE EDGE (SSE) CURRENT AND FUTURE TYPE ANALYSIS, 2025–2034, (USD MILLION)
FIGURE 121 KUWAIT SECURITY SERVICE EDGE (SSE) CURRENT AND FUTURE END USER ANALYSIS, 2025–2034, (USD MILLION)
FIGURE 122 OMAN SECURITY SERVICE EDGE (SSE) CURRENT AND FUTURE TYPE ANALYSIS, 2025–2034, (USD MILLION)
FIGURE 123 OMAN SECURITY SERVICE EDGE (SSE) CURRENT AND FUTURE END USER ANALYSIS, 2025–2034, (USD MILLION)
FIGURE 124 QATAR SECURITY SERVICE EDGE (SSE) CURRENT AND FUTURE TYPE ANALYSIS, 2025–2034, (USD MILLION)
FIGURE 125 QATAR SECURITY SERVICE EDGE (SSE) CURRENT AND FUTURE END USER ANALYSIS, 2025–2034, (USD MILLION)
FIGURE 126 EGYPT SECURITY SERVICE EDGE (SSE) CURRENT AND FUTURE TYPE ANALYSIS, 2025–2034, (USD MILLION)
FIGURE 127 EGYPT SECURITY SERVICE EDGE (SSE) CURRENT AND FUTURE END USER ANALYSIS, 2025–2034, (USD MILLION)
FIGURE 128 NIGERIA SECURITY SERVICE EDGE (SSE) CURRENT AND FUTURE TYPE ANALYSIS, 2025–2034, (USD MILLION)
FIGURE 129 NIGERIA SECURITY SERVICE EDGE (SSE) CURRENT AND FUTURE END USER ANALYSIS, 2025–2034, (USD MILLION)
FIGURE 130 SOUTH AFRICA SECURITY SERVICE EDGE (SSE) CURRENT AND FUTURE TYPE ANALYSIS, 2025–2034, (USD MILLION)
FIGURE 131 SOUTH AFRICA SECURITY SERVICE EDGE (SSE) CURRENT AND FUTURE END USER ANALYSIS, 2025–2034, (USD MILLION)
FIGURE 132 ISRAEL SECURITY SERVICE EDGE (SSE) CURRENT AND FUTURE TYPE ANALYSIS, 2025–2034, (USD MILLION)
FIGURE 133 ISRAEL SECURITY SERVICE EDGE (SSE) CURRENT AND FUTURE END USER ANALYSIS, 2025–2034, (USD MILLION)
FIGURE 134 REST OF MEA SECURITY SERVICE EDGE (SSE) CURRENT AND FUTURE TYPE ANALYSIS, 2025–2034, (USD MILLION)
FIGURE 135 REST OF MEA SECURITY SERVICE EDGE (SSE) CURRENT AND FUTURE END USER ANALYSIS, 2025–2034, (USD MILLION)
FIGURE 136 U. S. MARKET SHARE ANALYSIS BY TYPE (2024)
FIGURE 137 U. S. MARKET SHARE ANALYSIS BY END USER (2024)
FIGURE 138 CANADA MARKET SHARE ANALYSIS BY TYPE (2024)
FIGURE 139 CANADA MARKET SHARE ANALYSIS BY END USER (2024)
FIGURE 140 MEXICO MARKET SHARE ANALYSIS BY TYPE (2024)
FIGURE 141 MEXICO MARKET SHARE ANALYSIS BY END USER (2024)
FIGURE 142 CHINA MARKET SHARE ANALYSIS BY TYPE (2024)
FIGURE 143 CHINA MARKET SHARE ANALYSIS BY END USER (2024)
FIGURE 144 JAPAN MARKET SHARE ANALYSIS BY TYPE (2024)
FIGURE 145 JAPAN MARKET SHARE ANALYSIS BY END USER (2024)
FIGURE 146 INDIA MARKET SHARE ANALYSIS BY TYPE (2024)
FIGURE 147 INDIA MARKET SHARE ANALYSIS BY END USER (2024)
FIGURE 148 SOUTH KOREA MARKET SHARE ANALYSIS BY TYPE (2024)
FIGURE 149 SOUTH KOREA MARKET SHARE ANALYSIS BY END USER (2024)
FIGURE 150 SAUDI ARABIA MARKET SHARE ANALYSIS BY TYPE (2024)
FIGURE 151 SAUDI ARABIA MARKET SHARE ANALYSIS BY END USER (2024)
FIGURE 152 UAE MARKET SHARE ANALYSIS BY TYPE (2024)
FIGURE 153 UAE MARKET SHARE ANALYSIS BY END USER (2024)
FIGURE 154 EGYPT MARKET SHARE ANALYSIS BY TYPE (2024)
FIGURE 155 EGYPT MARKET SHARE ANALYSIS BY END USER (2024)
FIGURE 156 NIGERIA MARKET SHARE ANALYSIS BY TYPE (2024)
FIGURE 157 NIGERIA MARKET SHARE ANALYSIS BY END USER (2024)
FIGURE 158 SOUTH AFRICA MARKET SHARE ANALYSIS BY TYPE (2024)
FIGURE 159 SOUTH AFRICA MARKET SHARE ANALYSIS BY END USER (2024)
FIGURE 160 GERMANY MARKET SHARE ANALYSIS BY TYPE (2024)
FIGURE 161 GERMANY MARKET SHARE ANALYSIS BY END USER (2024)
FIGURE 162 FRANCE MARKET SHARE ANALYSIS BY TYPE (2024)
FIGURE 163 FRANCE MARKET SHARE ANALYSIS BY END USER (2024)
FIGURE 164 UK MARKET SHARE ANALYSIS BY TYPE (2024)
FIGURE 165 UK MARKET SHARE ANALYSIS BY END USER (2024)
FIGURE 166 SPAIN MARKET SHARE ANALYSIS BY TYPE (2024)
FIGURE 167 SPAIN MARKET SHARE ANALYSIS BY END USER (2024)
FIGURE 168 ITALY MARKET SHARE ANALYSIS BY TYPE (2024)
FIGURE 169 ITALY MARKET SHARE ANALYSIS BY END USER (2024)
FIGURE 170 BRAZIL MARKET SHARE ANALYSIS BY TYPE (2024)
FIGURE 171 BRAZIL MARKET SHARE ANALYSIS BY END USER (2024)
FIGURE 172 ARGENTINA MARKET SHARE ANALYSIS BY TYPE (2024)
FIGURE 173 ARGENTINA MARKET SHARE ANALYSIS BY END USER (2024)
FIGURE 174 COLUMBIA MARKET SHARE ANALYSIS BY TYPE (2024)
FIGURE 175 COLUMBIA MARKET SHARE ANALYSIS BY END USER (2024)
FIGURE 176 GLOBAL SECURITY SERVICE EDGE (SSE) CURRENT AND FUTURE MARKET KEY COUNTRY LEVEL ANALYSIS, 2024–2034, (USD MILLION)
FIGURE 177 FINANCIAL OVERVIEW:
Key Players Analysis:
Palo Alto Networks: With its cutting-edge SSE solutions that integrate firewalls, secure access, and AI-driven threat detection, Palo Alto Networks is renowned for being a leader in network security. The Prisma Access technology from Palo Alto is widely used, particularly by businesses looking for cloud security and safe remote access. Its emphasis on cloud-native security and innovation increases its market share.
Fortinet: Fortinet is one of the leading companies with a solid reputation for offering complete network security solutions. Its Security Fabric platform provides comprehensive SSE solutions that provide data protection and safe access over dispersed networks. Fortinet is a top option for companies seeking to safeguard hybrid cloud systems because of its strategic focus on performance and scalability.
Zscaler, Inc.: Zscaler, Inc. has become well-known for its cloud-first security approach, providing a scalable platform for protecting remote workers. No matter where you are, Zscaler's Zero Trust architecture guarantees safe access to data and apps. The company has a competitive advantage in the quickly changing SSE market because of its significant emphasis on cloud-native security.
Market Key Players
Zscaler, Inc.
Palo Alto Networks, Inc.
Netskope, Inc.
Cisco Systems, Inc.
Cloudflare, Inc.
Forcepoint LLC
McAfee Corp.
Akamai Technologies
Fortinet, Inc.
Broadcom Inc. (Symantec)
Check Point Software Technologies Ltd.
Versa Networks, Inc.
Perimeter 81
Cato Networks
iboss, Inc.
Proofpoint
Citrix
Kyndryl Inc.
VMware
Aryaka
Driver:
Growing Cybersecurity Threats
The primary drivers propelling the Security Service Edge (SSE) market expansion include the growing frequency of cybersecurity threats, the expanding use of cloud computing, the growing need for remote workforce security, and developments in zero-trust architecture. As more companies transition to cloud-based operations, cloud adoption is speeding up. The need for SSE solutions is increased by this shift, which necessitates sophisticated security services to safeguard data and apps on the cloud. Furthermore, the need for security solutions that safeguard dispersed networks has grown as remote office services have become more popular. By offering smooth access control and traffic management regardless of location, SSE enables businesses to protect their remote workers.
Increasing trend of AI and Machine learning
Key growth reasons for the Security Service Edge market include the emergence of AI and machine learning, rising data volumes, the move to cloud migration, and the rising need for secure remote access. SSE solutions are being improved by AI and machine learning, which offer automated reaction mechanisms and real-time threat identification. Strong edge security is needed due to the growing amount of data being created and sent across networks. SSE solutions aid in the management and security of massive data flows, guaranteeing data integrity and defense against online threats.
Restrain:
High cost and complexity
Concerns about data privacy, high implementation costs, integration challenges, and low awareness are some of the main challenges holding back the Security Service Edge market's expansion. It costs a lot of money to implement SSE solutions, especially for large businesses that need to expand security across several platforms and locations. Another obstacle is the intricacy of integration. It can be challenging for many firms to integrate their legacy systems with contemporary SSE solutions, which hinders rollout and lowers the possibility of adoption. Concerns about data privacy are another important barrier. Because SSE solutions frequently need access to sensitive data for protection and monitoring, companies are reluctant to deploy these systems because of concern about data breaches or improper management.
Opportunities:
Rising demand for hybrid cloud solutions
Significant prospects exist in the Security Service Edge market due to the growing demand for hybrid cloud solutions, the need for improved compliance management, the development of AI-powered security, and the growth of small and mid-sized enterprises. An additional sector with opportunity is compliance management. Businesses are searching for security solutions that assist them in meeting compliance criteria as laws across industries become more stringent. Automated compliance monitoring SSE solutions are well-positioned to take advantage of this demand.
Trends:
AI-Driven Security and Zero Trust Architecture
The latest trend factors affecting the Security Service Edge market are the growing emphasis on Secure Access Service Edge (SASE) models, the acceptance of AI-driven security, the emergence of zero-trust architecture, and the rising demand for integrated threat intelligence. Another important development as companies shift to more stringent access controls and continuous verification is zero-trust architecture. Businesses looking to improve their security regimes are increasingly choosing SSE solutions that adhere to zero-trust standards.
Recent Development:
In July 2023, Netskope announced a new partnership with Wipro Limited. The collaboration intends to offer Wipro's extensive global enterprise clientele Managed Secure Access Service Edge (SASE) and Managed Zero Trust Network Access (ZTNA) services that are cloud-native and resilient.
In January 2024, In collaboration with Cisco, Kyndryl introduced two new Security Service Edge (SSE) products. These consist of a managed service that incorporates Cisco's Secure Access technology into a cloud-delivered paradigm and a consulting service that assists organisations in implementing a secure network architecture.
In September 2023, SoftBank Corp. will provide Netskope's Security Service Edge (SSE), increasing access to its extensive security features. By providing managed services that complement SoftBank's enterprise network solutions, the partnership seeks to improve cloud environment security.
In December 2023, With an emphasis on protecting cloud networks, Zayo Group and Netskope have partnered to offer improved Security Service Edge (SSE) capabilities. Organisations may improve security in a remote work environment by utilising Zayo's vast network infrastructure in conjunction with Netskope's cloud-native security features.
In August 2023, With the launch of Lacework Edge, the company expanded its data-driven strategy to the Security Service Edge (SSE). Lacework Edge improves threat detection and lowers risks by utilising automation and machine learning to improve cloud security.