Global Self-Checkout System Market Size, Share, Analysis Report By Component (Services ,Systems), By Type (Cashless ,Cash-based), By Application (Supermarkets and Hypermarkets ,Convenience Stores ,Department Stores ,Others),Region and Key Players - Industry Segment Overview, Market Dynamics, Competitive Strategies, Trends and Forecast 2025-2034
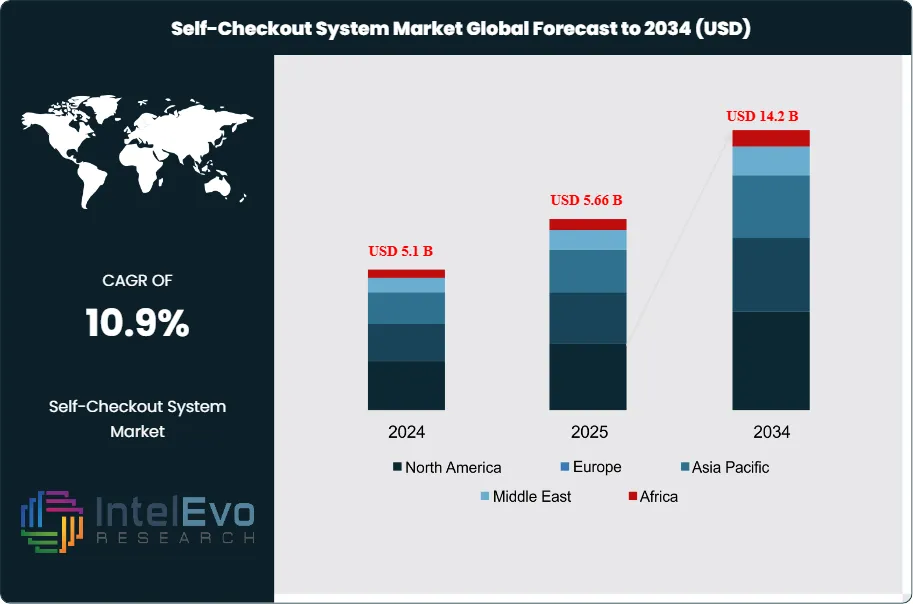
The Self-Checkout System Market size is projected to reach USD 14.2 billion by 2034, rising from USD 5.1 billion in 2024, growing at a CAGR of 10.9% during the forecast period from 2025 to 2034. The growth of the market is driven by increasing demand for contactless shopping experiences, AI-powered retail automation, and enhanced customer convenience across supermarkets, hypermarkets, and specialty stores. As global retailers embrace digital transformation, self-checkout systems are emerging as a key enabler of efficiency, cost savings, and improved customer satisfaction. The trend toward smart retail ecosystems and seamless checkout technology continues to reshape the retail landscape — making self-checkout solutions one of the fastest-growing retail tech innovations globally.
The self-checkout system market represents a rapidly evolving segment within the retail technology landscape, characterized by automated point-of-sale solutions that enable customers to scan, bag, and pay for merchandise without traditional cashier assistance. The market size stood at USD 5.48 billion in 2024 and is projected to grow at a CAGR of 15.5% during the forecast period, driven by increasing consumer demand for convenience, operational efficiency requirements, and the accelerating digital transformation of retail environments. Key factors influencing market growth include rising labor costs, the need for reduced waiting times, technological advancements in artificial intelligence and machine learning, and the growing preference for contactless shopping experiences that emerged prominently during the COVID-19 pandemic.
The market's expansion is further supported by the integration of advanced technologies such as computer vision, RFID scanning, mobile payment systems, and biometric authentication, which collectively enhance user experience and operational reliability. AI-driven self-checkout systems are bolstering the growth of retail stores, with market players like Diebold Nixdorf unveiling new technology for cashierless registers, leveraging AI to mitigate shrinkage, verify age for liquor purchases, and expedite transactions. Additionally, the increasing penetration of smartphones and digital payment methods has created a conducive environment for cashless self-checkout solutions, while the expansion of modern retail formats across emerging economies presents significant growth opportunities.
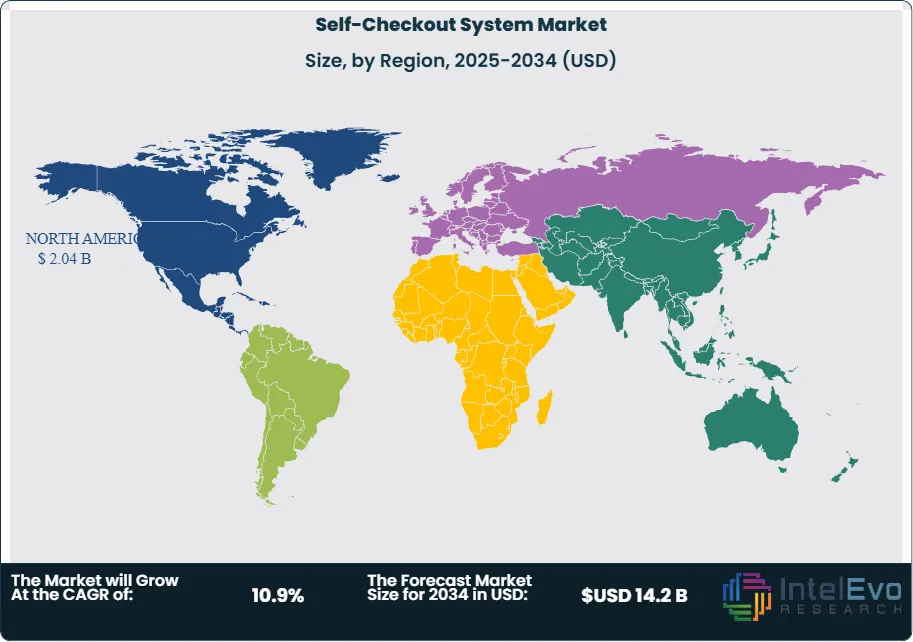
Regional Analysis: The Asia Pacific self-checkout systems market is growing rapidly at a CAGR of over 15% from 2025 to 2030, driven by the expansion of modern retail formats, rising urbanization, and increasing consumer preference. North America continues to lead the global market due to early adoption of retail automation technologies, high consumer acceptance rates, and presence of major market players, while Europe follows closely with significant investments in retail digitalization.
COVID-19 Impact: The COVID-19 pandemic significantly accelerated the market as businesses prioritized contactless solutions to enhance safety and minimize human interaction. The increased shift towards contactless payment options during the COVID-19 pandemic has further driven the market, as retailers sought to reduce physical contact points and address consumer safety concerns while maintaining operational efficiency during lockdowns and social distancing measures.
Regional Conflicts and Trade Tariffs: The ongoing trade tensions between major economies have created challenges for global supply chains in the self-checkout system market, particularly affecting the procurement of electronic components and hardware from different regions. Tariffs on technology goods and semiconductors have increased manufacturing costs for system integrators and may impact pricing strategies for end-users. However, these challenges have also encouraged regional manufacturing capabilities and partnerships, leading to more localized supply chains and potentially reduced dependency on single-source suppliers, which could enhance market resilience in the long term.
Key Takeaways:
Market Growth: The Self-Checkout System Market is expected to reach USD 14.2 billion by 2034, due to factors such as retailers prioritize automation, cost reduction, and improved shopper satisfaction. Increasing adoption in supermarkets, hypermarkets, and large department stores is particularly notable, while cashless payment integration further propels expansion.
Component Dominance: Systems constitute the largest component segment, driven by the rising preference for integrated kiosks with advanced scanning, weighing, and payment capabilities. Hardware sales outpace services due to the capital-intensive nature of deployment and the need for continuous upgrades.
Type Dominance: Cashless self-checkout solutions are increasingly dominant because of the proliferation of mobile wallets, NFC, and QR code payments. Consumers appreciate faster transaction processing and reduced waiting times, leading retailers to phase out cash-based machines in high-traffic locations.
Application Dominance: Supermarkets and hypermarkets remain the largest application segment as these retailers typically have the highest transaction volumes and strong incentives to optimize labor costs. The scale of operations justifies the investment in multiple lanes of self-checkout systems.
Driver: The push for contactless, seamless shopping experiences and the need to address labor shortages are the primary drivers of market growth. Retailers are leveraging self-checkout to improve customer throughput and operational efficiency.
Restraint: High upfront investment and concerns over theft and shrinkage are major restraints. Smaller retailers, in particular, find the cost barrier challenging to overcome without substantial ROI projections.
Opportunity: Advancements in AI-powered loss prevention and customer assistance create significant opportunities for vendors. Emerging markets with modernizing retail infrastructure present additional growth prospects.
Trend: Integration with digital wallets and facial recognition is a prominent trend. Additionally, modular self-checkout pods designed for smaller stores and convenience formats are gaining traction.
Regional Analysis: North America leads due to technological readiness, consumer acceptance, and significant retailer investments. Europe and Asia Pacific follow, with strong growth potential in emerging economies.
Component Analysis:
Systems are the cornerstone of self-checkout deployments. These integrated solutions include touchscreen displays, barcode scanners, weighing scales, and payment terminals. Large supermarkets and hypermarkets often invest in multiple units per store to handle high customer throughput. The ability to customize hardware configurations to support advanced payment options, such as digital wallets and biometrics, has increased the appeal of systems over standalone services. Furthermore, frequent hardware refresh cycles and evolving security standards necessitate ongoing upgrades, driving recurring demand. As the retail sector becomes more digitized, systems continue to account for the majority of market revenue.
Type Analysis:
Cashless self-checkout systems lead the market segment due to their alignment with evolving consumer payment preferences and operational advantages. These systems support credit cards, debit cards, mobile payments, and contactless transactions, offering faster processing times and reduced cash handling requirements. The cashless segment's dominance is further reinforced by the COVID-19 pandemic's acceleration of contactless payment adoption. However, the cash-based segment dominated the market with the highest revenue share in 2024, driven by consumer preference for traditional payment methods among certain demographics, indicating regional variations in payment preferences and the continued relevance of cash-accepting systems in specific markets.
End User Analysis:
Supermarkets and Hypermarkets Leads With over 55% Market Share In Self-Checkout System Market. Supermarkets and hypermarkets represent the largest application segment for self-checkout systems due to their high transaction volumes, diverse product ranges, and significant potential for labor cost optimization. These large-format retail stores benefit from the scalability of self-checkout solutions and their ability to handle peak shopping periods more efficiently. The segment's dominance is supported by the widespread adoption rates, with grocers having a 96% adoption rate for self-checkout systems. Convenience stores and department stores follow as secondary application segments, each with specific requirements for compact, efficient self-checkout solutions tailored to their operational models.
Region Analysis:
North America Leads With more than 40% Market Share In Self-Checkout System Market. North America leads the global self-checkout system market due to several strategic advantages including early technology adoption, high consumer acceptance rates, and the presence of major market players such as NCR Corporation, Diebold Nixdorf, and Toshiba Global Commerce Solutions. The region's market leadership is reinforced by advanced retail infrastructure, widespread digital payment adoption, and significant investments in retail automation technologies. In North America, the market sees demand for advanced self-checkout systems with features such as mobile payment integration, biometric authentication, and enhanced security measures.
The Asia Pacific region demonstrates the fastest growth potential, growing significantly at a CAGR of over 15% from 2025 to 2030, driven by the expansion of modern retail formats, rising urbanization, and increasing consumer preference. Countries like China, India, and Japan are experiencing rapid retail modernization, creating substantial opportunities for self-checkout system deployment. Europe maintains a strong position with significant investments in retail digitalization and sustainability initiatives driving adoption.
By Offering (Hardware, Software, Services), By Model Type, Cash Model, Cashless Model), By Mounting Type (Standalone, Wall-Mounted, Mobile), By End User (Retail (Supermarkets, Hypermarkets, Convenience Stores), Hospitality (Hotels, Restaurants, Cafes), Healthcare, Transportation (Airports, Metro, Bus Terminals), Others)
Research Methodology
Primary Research- 100 Interviews of Stakeholders
Secondary Research
Desk Research
Regional scope
North America (United States, Canada, Mexico)
Latin America (Brazil, Argentina, Columbia)
East Asia And Pacific (China, Japan, South Korea, Australia, Cambodia, Fiji, Indonesia)
Sea And South Asia (India, Singapore, Thailand, Taiwan, Malaysia)
Eastern Europe (Poland, Russia, Czech Republic, Romania)
Western Europe (Germany, U.K., France, Spain, Itlay)
Middle East & Africa (GCC Countries, Egypt, Nigeria, South Africa, Israel)
Competitive Landscape
IBM Corporation ,Diebold Nixdorf, Incorporated ,Honeywell International Inc. ,ePOS HYBRID ,CCL Technology ,Fujitsu ,OLEA Kiosk. ,Gilbarco Veeder-Root Company. ,ITAB ,Toshiba Global Commerce Solutions ,MetroClick ,NCR Corporation ,StrongPoint ,Pyramid Computer GMBH
Customization Scope
Customization for segments, region/country-level will be provided. Moreover, additional customization can be done based on the requirements.
Pricing and Purchase Options
Avail customized purchase options to meet your exact research needs. We have three licenses to opt for: Single User License, Multi-User License (Up to 5 Users), Corporate Use License (Unlimited User and Printable PDF).
TABLE OF CONTENTS
1. EXECUTIVE SUMMARY
1.1. MARKET SNAPSHOT
1.2. KEY FINDINGS & INSIGHTS
1.3. ANALYST RECOMMENDATIONS
1.4. FUTURE OUTLOOK
2. RESEARCH METHODOLOGY
2.1. MARKET DEFINITION & SCOPE
2.2. RESEARCH OBJECTIVES: PRIMARY & SECONDARY DATA SOURCES
2.3. DATA COLLECTION SOURCES
2.3.1. COVERAGE OF 100+ PRIMARY RESEARCH/CONSULTATION CALLS WITH INDUSTRY STAKEHOLDERS
FIGURE 17 NORTH AMERICA SELF-CHECKOUT SYSTEM CURRENT AND FUTURE TYPE ANALYSIS, 2025–2034, (USD MILLION)
FIGURE 18 NORTH AMERICA SELF-CHECKOUT SYSTEM CURRENT AND FUTURE END USER ANALYSIS, 2025–2034, (USD MILLION)
FIGURE 19 MARKET SHARE BY COUNTRY
FIGURE 20 LATIN AMERICA SELF-CHECKOUT SYSTEM CURRENT AND FUTURE TYPE ANALYSIS, 2025–2034, (USD MILLION)
FIGURE 21 LATIN AMERICA SELF-CHECKOUT SYSTEM CURRENT AND FUTURE END USER ANALYSIS, 2025–2034, (USD MILLION)
FIGURE 22 MARKET SHARE BY COUNTRY
FIGURE 23 EASTERN EUROPE SELF-CHECKOUT SYSTEM CURRENT AND FUTURE TYPE ANALYSIS, 2025–2034, (USD MILLION)
FIGURE 24 EASTERN EUROPE SELF-CHECKOUT SYSTEM CURRENT AND FUTURE END USER ANALYSIS, 2025–2034, (USD MILLION)
FIGURE 25 MARKET SHARE BY COUNTRY
FIGURE 26 WESTERN EUROPE SELF-CHECKOUT SYSTEM CURRENT AND FUTURE TYPE ANALYSIS, 2025–2034, (USD MILLION)
FIGURE 27 WESTERN EUROPE SELF-CHECKOUT SYSTEM CURRENT AND FUTURE END USER ANALYSIS, 2025–2034, (USD MILLION)
FIGURE 28 MARKET SHARE BY COUNTRY
FIGURE 29 EAST ASIA AND PACIFIC SELF-CHECKOUT SYSTEM CURRENT AND FUTURE TYPE ANALYSIS, 2025–2034, (USD MILLION)
FIGURE 30 EAST ASIA AND PACIFIC SELF-CHECKOUT SYSTEM CURRENT AND FUTURE END USER ANALYSIS, 2025–2034, (USD MILLION)
FIGURE 31 MARKET SHARE BY COUNTRY
FIGURE 32 SEA AND SOUTH ASIA SELF-CHECKOUT SYSTEM CURRENT AND FUTURE TYPE ANALYSIS, 2025–2034, (USD MILLION)
FIGURE 33 SEA AND SOUTH ASIA SELF-CHECKOUT SYSTEM CURRENT AND FUTURE END USER ANALYSIS, 2025–2034, (USD MILLION)
FIGURE 34 MARKET SHARE BY COUNTRY
FIGURE 35 MIDDLE EAST AND AFRICA SELF-CHECKOUT SYSTEM CURRENT AND FUTURE TYPE ANALYSIS, 2025–2034, (USD MILLION)
FIGURE 36 MIDDLE EAST AND AFRICA SELF-CHECKOUT SYSTEM CURRENT AND FUTURE END USER ANALYSIS, 2025–2034, (USD MILLION)
FIGURE 37 NORTH AMERICA SELF-CHECKOUT SYSTEM CURRENT AND FUTURE MARKET VOLUME SHARE REGIONAL ANALYSIS, 2025–2034, (USD MILLION)
FIGURE 38 U.S. SELF-CHECKOUT SYSTEM CURRENT AND FUTURE TYPE ANALYSIS, 2025–2034, (USD MILLION)
FIGURE 39 U.S. SELF-CHECKOUT SYSTEM CURRENT AND FUTURE END USER ANALYSIS, 2025–2034, (USD MILLION)
FIGURE 40 CANADA SELF-CHECKOUT SYSTEM CURRENT AND FUTURE TYPE ANALYSIS, 2025–2034, (USD MILLION)
FIGURE 41 CANADA SELF-CHECKOUT SYSTEM CURRENT AND FUTURE END USER ANALYSIS, 2025–2034, (USD MILLION)
FIGURE 42 LATIN AMERICA SELF-CHECKOUT SYSTEM CURRENT AND FUTURE MARKET VOLUME SHARE REGIONAL ANALYSIS, 2025–2034, (USD MILLION)
FIGURE 43 MEXICO SELF-CHECKOUT SYSTEM CURRENT AND FUTURE TYPE ANALYSIS, 2025–2034, (USD MILLION)
FIGURE 44 MEXICO SELF-CHECKOUT SYSTEM CURRENT AND FUTURE END USER ANALYSIS, 2025–2034, (USD MILLION)
FIGURE 45 BRAZIL SELF-CHECKOUT SYSTEM CURRENT AND FUTURE TYPE ANALYSIS, 2025–2034, (USD MILLION)
FIGURE 46 BRAZIL SELF-CHECKOUT SYSTEM CURRENT AND FUTURE END USER ANALYSIS, 2025–2034, (USD MILLION)
FIGURE 47 ARGENTINA SELF-CHECKOUT SYSTEM CURRENT AND FUTURE TYPE ANALYSIS, 2025–2034, (USD MILLION)
FIGURE 48 ARGENTINA SELF-CHECKOUT SYSTEM CURRENT AND FUTURE END USER ANALYSIS, 2025–2034, (USD MILLION)
FIGURE 49 COLUMBIA SELF-CHECKOUT SYSTEM CURRENT AND FUTURE TYPE ANALYSIS, 2025–2034, (USD MILLION)
FIGURE 50 COLUMBIA SELF-CHECKOUT SYSTEM CURRENT AND FUTURE END USER ANALYSIS, 2025–2034, (USD MILLION)
FIGURE 51 REST OF LATIN AMERICA SELF-CHECKOUT SYSTEM CURRENT AND FUTURE TYPE ANALYSIS, 2025–2034, (USD MILLION)
FIGURE 52 REST OF LATIN AMERICA SELF-CHECKOUT SYSTEM CURRENT AND FUTURE END USER ANALYSIS, 2025–2034, (USD MILLION)
FIGURE 53 EASTERN EUROPE SELF-CHECKOUT SYSTEM CURRENT AND FUTURE MARKET VOLUME SHARE REGIONAL ANALYSIS, 2025–2034, (USD MILLION)
FIGURE 54 POLAND SELF-CHECKOUT SYSTEM CURRENT AND FUTURE TYPE ANALYSIS, 2025–2034, (USD MILLION)
FIGURE 55 POLAND SELF-CHECKOUT SYSTEM CURRENT AND FUTURE END USER ANALYSIS, 2025–2034, (USD MILLION)
FIGURE 56 RUSSIA SELF-CHECKOUT SYSTEM CURRENT AND FUTURE TYPE ANALYSIS, 2025–2034, (USD MILLION)
FIGURE 57 RUSSIA SELF-CHECKOUT SYSTEM CURRENT AND FUTURE END USER ANALYSIS, 2025–2034, (USD MILLION)
FIGURE 58 CZECH REPUBLIC SELF-CHECKOUT SYSTEM CURRENT AND FUTURE TYPE ANALYSIS, 2025–2034, (USD MILLION)
FIGURE 59 CZECH REPUBLIC SELF-CHECKOUT SYSTEM CURRENT AND FUTURE END USER ANALYSIS, 2025–2034, (USD MILLION)
FIGURE 60 ROMANIA SELF-CHECKOUT SYSTEM CURRENT AND FUTURE TYPE ANALYSIS, 2025–2034, (USD MILLION)
FIGURE 61 ROMANIA SELF-CHECKOUT SYSTEM CURRENT AND FUTURE END USER ANALYSIS, 2025–2034, (USD MILLION)
FIGURE 62 REST OF EASTERN EUROPE SELF-CHECKOUT SYSTEM CURRENT AND FUTURE TYPE ANALYSIS, 2025–2034, (USD MILLION)
FIGURE 63 REST OF EASTERN EUROPE SELF-CHECKOUT SYSTEM CURRENT AND FUTURE END USER ANALYSIS, 2025–2034, (USD MILLION)
FIGURE 64 WESTERN EUROPE SELF-CHECKOUT SYSTEM CURRENT AND FUTURE MARKET VOLUME SHARE REGIONAL ANALYSIS, 2025–2034, (USD MILLION)
FIGURE 65 GERMANY SELF-CHECKOUT SYSTEM CURRENT AND FUTURE TYPE ANALYSIS, 2025–2034, (USD MILLION)
FIGURE 66 GERMANY SELF-CHECKOUT SYSTEM CURRENT AND FUTURE END USER ANALYSIS, 2025–2034, (USD MILLION)
FIGURE 67 FRANCE SELF-CHECKOUT SYSTEM CURRENT AND FUTURE TYPE ANALYSIS, 2025–2034, (USD MILLION)
FIGURE 68 FRANCE SELF-CHECKOUT SYSTEM CURRENT AND FUTURE END USER ANALYSIS, 2025–2034, (USD MILLION)
FIGURE 69 UK SELF-CHECKOUT SYSTEM CURRENT AND FUTURE TYPE ANALYSIS, 2025–2034, (USD MILLION)
FIGURE 70 UK SELF-CHECKOUT SYSTEM CURRENT AND FUTURE END USER ANALYSIS, 2025–2034, (USD MILLION)
FIGURE 71 SPAIN SELF-CHECKOUT SYSTEM CURRENT AND FUTURE TYPE ANALYSIS, 2025–2034, (USD MILLION)
FIGURE 72 SPAIN SELF-CHECKOUT SYSTEM CURRENT AND FUTURE END USER ANALYSIS, 2025–2034, (USD MILLION)
FIGURE 73 ITALY SELF-CHECKOUT SYSTEM CURRENT AND FUTURE TYPE ANALYSIS, 2025–2034, (USD MILLION)
FIGURE 74 ITALY SELF-CHECKOUT SYSTEM CURRENT AND FUTURE END USER ANALYSIS, 2025–2034, (USD MILLION)
FIGURE 75 REST OF WESTERN EUROPE SELF-CHECKOUT SYSTEM CURRENT AND FUTURE TYPE ANALYSIS, 2025–2034, (USD MILLION)
FIGURE 76 REST OF WESTERN EUROPE SELF-CHECKOUT SYSTEM CURRENT AND FUTURE END USER ANALYSIS, 2025–2034, (USD MILLION)
FIGURE 77 EAST ASIA AND PACIFIC SELF-CHECKOUT SYSTEM CURRENT AND FUTURE MARKET VOLUME SHARE REGIONAL ANALYSIS, 2025–2034, (USD MILLION)
FIGURE 78 CHINA SELF-CHECKOUT SYSTEM CURRENT AND FUTURE TYPE ANALYSIS, 2025–2034, (USD MILLION)
FIGURE 79 CHINA SELF-CHECKOUT SYSTEM CURRENT AND FUTURE END USER ANALYSIS, 2025–2034, (USD MILLION)
FIGURE 80 JAPAN SELF-CHECKOUT SYSTEM CURRENT AND FUTURE TYPE ANALYSIS, 2025–2034, (USD MILLION)
FIGURE 81 JAPAN SELF-CHECKOUT SYSTEM CURRENT AND FUTURE END USER ANALYSIS, 2025–2034, (USD MILLION)
FIGURE 82 AUSTRALIA SELF-CHECKOUT SYSTEM CURRENT AND FUTURE TYPE ANALYSIS, 2025–2034, (USD MILLION)
FIGURE 83 AUSTRALIA SELF-CHECKOUT SYSTEM CURRENT AND FUTURE END USER ANALYSIS, 2025–2034, (USD MILLION)
FIGURE 84 CAMBODIA SELF-CHECKOUT SYSTEM CURRENT AND FUTURE TYPE ANALYSIS, 2025–2034, (USD MILLION)
FIGURE 85 CAMBODIA SELF-CHECKOUT SYSTEM CURRENT AND FUTURE END USER ANALYSIS, 2025–2034, (USD MILLION)
FIGURE 86 FIJI SELF-CHECKOUT SYSTEM CURRENT AND FUTURE TYPE ANALYSIS, 2025–2034, (USD MILLION)
FIGURE 87 FIJI SELF-CHECKOUT SYSTEM CURRENT AND FUTURE END USER ANALYSIS, 2025–2034, (USD MILLION)
FIGURE 88 INDONESIA SELF-CHECKOUT SYSTEM CURRENT AND FUTURE TYPE ANALYSIS, 2025–2034, (USD MILLION)
FIGURE 89 INDONESIA SELF-CHECKOUT SYSTEM CURRENT AND FUTURE END USER ANALYSIS, 2025–2034, (USD MILLION)
FIGURE 90 SOUTH KOREA SELF-CHECKOUT SYSTEM CURRENT AND FUTURE TYPE ANALYSIS, 2025–2034, (USD MILLION)
FIGURE 91 SOUTH KOREA SELF-CHECKOUT SYSTEM CURRENT AND FUTURE END USER ANALYSIS, 2025–2034, (USD MILLION)
FIGURE 92 REST OF EAST ASIA AND PACIFIC SELF-CHECKOUT SYSTEM CURRENT AND FUTURE TYPE ANALYSIS, 2025–2034, (USD MILLION)
FIGURE 93 REST OF EAST ASIA AND PACIFIC SELF-CHECKOUT SYSTEM CURRENT AND FUTURE END USER ANALYSIS, 2025–2034, (USD MILLION)
FIGURE 94 SEA AND SOUTH ASIA SELF-CHECKOUT SYSTEM CURRENT AND FUTURE MARKET VOLUME SHARE REGIONAL ANALYSIS, 2025–2034, (USD MILLION)
FIGURE 95 BANGLADESH SELF-CHECKOUT SYSTEM CURRENT AND FUTURE TYPE ANALYSIS, 2025–2034, (USD MILLION)
FIGURE 96 BANGLADESH SELF-CHECKOUT SYSTEM CURRENT AND FUTURE END USER ANALYSIS, 2025–2034, (USD MILLION)
FIGURE 97 NEW ZEALAND SELF-CHECKOUT SYSTEM CURRENT AND FUTURE TYPE ANALYSIS, 2025–2034, (USD MILLION)
FIGURE 98 NEW ZEALAND SELF-CHECKOUT SYSTEM CURRENT AND FUTURE END USER ANALYSIS, 2025–2034, (USD MILLION)
FIGURE 99 INDIA SELF-CHECKOUT SYSTEM CURRENT AND FUTURE TYPE ANALYSIS, 2025–2034, (USD MILLION)
FIGURE 100 INDIA SELF-CHECKOUT SYSTEM CURRENT AND FUTURE END USER ANALYSIS, 2025–2034, (USD MILLION)
FIGURE 101 SINGAPORE SELF-CHECKOUT SYSTEM CURRENT AND FUTURE TYPE ANALYSIS, 2025–2034, (USD MILLION)
FIGURE 102 SINGAPORE SELF-CHECKOUT SYSTEM CURRENT AND FUTURE END USER ANALYSIS, 2025–2034, (USD MILLION)
FIGURE 103 THAILAND SELF-CHECKOUT SYSTEM CURRENT AND FUTURE TYPE ANALYSIS, 2025–2034, (USD MILLION)
FIGURE 104 THAILAND SELF-CHECKOUT SYSTEM CURRENT AND FUTURE END USER ANALYSIS, 2025–2034, (USD MILLION)
FIGURE 105 TAIWAN SELF-CHECKOUT SYSTEM CURRENT AND FUTURE TYPE ANALYSIS, 2025–2034, (USD MILLION)
FIGURE 106 TAIWAN SELF-CHECKOUT SYSTEM CURRENT AND FUTURE END USER ANALYSIS, 2025–2034, (USD MILLION)
FIGURE 107 MALAYSIA SELF-CHECKOUT SYSTEM CURRENT AND FUTURE TYPE ANALYSIS, 2025–2034, (USD MILLION)
FIGURE 108 MALAYSIA SELF-CHECKOUT SYSTEM CURRENT AND FUTURE END USER ANALYSIS, 2025–2034, (USD MILLION)
FIGURE 109 REST OF SEA AND SOUTH ASIA SELF-CHECKOUT SYSTEM CURRENT AND FUTURE TYPE ANALYSIS, 2025–2034, (USD MILLION)
FIGURE 110 REST OF SEA AND SOUTH ASIA SELF-CHECKOUT SYSTEM CURRENT AND FUTURE END USER ANALYSIS, 2025–2034, (USD MILLION)
FIGURE 111 MIDDLE EAST AND AFRICA SELF-CHECKOUT SYSTEM CURRENT AND FUTURE MARKET VOLUME SHARE REGIONAL ANALYSIS, 2025–2034, (USD MILLION)
FIGURE 112 GCC COUNTRIES SELF-CHECKOUT SYSTEM CURRENT AND FUTURE TYPE ANALYSIS, 2025–2034, (USD MILLION)
FIGURE 113 GCC COUNTRIES SELF-CHECKOUT SYSTEM CURRENT AND FUTURE END USER ANALYSIS, 2025–2034, (USD MILLION)
FIGURE 114 SAUDI ARABIA SELF-CHECKOUT SYSTEM CURRENT AND FUTURE TYPE ANALYSIS, 2025–2034, (USD MILLION)
FIGURE 115 SAUDI ARABIA SELF-CHECKOUT SYSTEM CURRENT AND FUTURE END USER ANALYSIS, 2025–2034, (USD MILLION)
FIGURE 116 UAE SELF-CHECKOUT SYSTEM CURRENT AND FUTURE TYPE ANALYSIS, 2025–2034, (USD MILLION)
FIGURE 117 UAE SELF-CHECKOUT SYSTEM CURRENT AND FUTURE END USER ANALYSIS, 2025–2034, (USD MILLION)
FIGURE 118 BAHRAIN SELF-CHECKOUT SYSTEM CURRENT AND FUTURE TYPE ANALYSIS, 2025–2034, (USD MILLION)
FIGURE 119 BAHRAIN SELF-CHECKOUT SYSTEM CURRENT AND FUTURE END USER ANALYSIS, 2025–2034, (USD MILLION)
FIGURE 120 KUWAIT SELF-CHECKOUT SYSTEM CURRENT AND FUTURE TYPE ANALYSIS, 2025–2034, (USD MILLION)
FIGURE 121 KUWAIT SELF-CHECKOUT SYSTEM CURRENT AND FUTURE END USER ANALYSIS, 2025–2034, (USD MILLION)
FIGURE 122 OMAN SELF-CHECKOUT SYSTEM CURRENT AND FUTURE TYPE ANALYSIS, 2025–2034, (USD MILLION)
FIGURE 123 OMAN SELF-CHECKOUT SYSTEM CURRENT AND FUTURE END USER ANALYSIS, 2025–2034, (USD MILLION)
FIGURE 124 QATAR SELF-CHECKOUT SYSTEM CURRENT AND FUTURE TYPE ANALYSIS, 2025–2034, (USD MILLION)
FIGURE 125 QATAR SELF-CHECKOUT SYSTEM CURRENT AND FUTURE END USER ANALYSIS, 2025–2034, (USD MILLION)
FIGURE 126 EGYPT SELF-CHECKOUT SYSTEM CURRENT AND FUTURE TYPE ANALYSIS, 2025–2034, (USD MILLION)
FIGURE 127 EGYPT SELF-CHECKOUT SYSTEM CURRENT AND FUTURE END USER ANALYSIS, 2025–2034, (USD MILLION)
FIGURE 128 NIGERIA SELF-CHECKOUT SYSTEM CURRENT AND FUTURE TYPE ANALYSIS, 2025–2034, (USD MILLION)
FIGURE 129 NIGERIA SELF-CHECKOUT SYSTEM CURRENT AND FUTURE END USER ANALYSIS, 2025–2034, (USD MILLION)
FIGURE 130 SOUTH AFRICA SELF-CHECKOUT SYSTEM CURRENT AND FUTURE TYPE ANALYSIS, 2025–2034, (USD MILLION)
FIGURE 131 SOUTH AFRICA SELF-CHECKOUT SYSTEM CURRENT AND FUTURE END USER ANALYSIS, 2025–2034, (USD MILLION)
FIGURE 132 ISRAEL SELF-CHECKOUT SYSTEM CURRENT AND FUTURE TYPE ANALYSIS, 2025–2034, (USD MILLION)
FIGURE 133 ISRAEL SELF-CHECKOUT SYSTEM CURRENT AND FUTURE END USER ANALYSIS, 2025–2034, (USD MILLION)
FIGURE 134 REST OF MEA SELF-CHECKOUT SYSTEM CURRENT AND FUTURE TYPE ANALYSIS, 2025–2034, (USD MILLION)
FIGURE 135 REST OF MEA SELF-CHECKOUT SYSTEM CURRENT AND FUTURE END USER ANALYSIS, 2025–2034, (USD MILLION)
FIGURE 136 U. S. MARKET SHARE ANALYSIS BY TYPE (2024)
FIGURE 137 U. S. MARKET SHARE ANALYSIS BY END USER (2024)
FIGURE 138 CANADA MARKET SHARE ANALYSIS BY TYPE (2024)
FIGURE 139 CANADA MARKET SHARE ANALYSIS BY END USER (2024)
FIGURE 140 MEXICO MARKET SHARE ANALYSIS BY TYPE (2024)
FIGURE 141 MEXICO MARKET SHARE ANALYSIS BY END USER (2024)
FIGURE 142 CHINA MARKET SHARE ANALYSIS BY TYPE (2024)
FIGURE 143 CHINA MARKET SHARE ANALYSIS BY END USER (2024)
FIGURE 144 JAPAN MARKET SHARE ANALYSIS BY TYPE (2024)
FIGURE 145 JAPAN MARKET SHARE ANALYSIS BY END USER (2024)
FIGURE 146 INDIA MARKET SHARE ANALYSIS BY TYPE (2024)
FIGURE 147 INDIA MARKET SHARE ANALYSIS BY END USER (2024)
FIGURE 148 SOUTH KOREA MARKET SHARE ANALYSIS BY TYPE (2024)
FIGURE 149 SOUTH KOREA MARKET SHARE ANALYSIS BY END USER (2024)
FIGURE 150 SAUDI ARABIA MARKET SHARE ANALYSIS BY TYPE (2024)
FIGURE 151 SAUDI ARABIA MARKET SHARE ANALYSIS BY END USER (2024)
FIGURE 152 UAE MARKET SHARE ANALYSIS BY TYPE (2024)
FIGURE 153 UAE MARKET SHARE ANALYSIS BY END USER (2024)
FIGURE 154 EGYPT MARKET SHARE ANALYSIS BY TYPE (2024)
FIGURE 155 EGYPT MARKET SHARE ANALYSIS BY END USER (2024)
FIGURE 156 NIGERIA MARKET SHARE ANALYSIS BY TYPE (2024)
FIGURE 157 NIGERIA MARKET SHARE ANALYSIS BY END USER (2024)
FIGURE 158 SOUTH AFRICA MARKET SHARE ANALYSIS BY TYPE (2024)
FIGURE 159 SOUTH AFRICA MARKET SHARE ANALYSIS BY END USER (2024)
FIGURE 160 GERMANY MARKET SHARE ANALYSIS BY TYPE (2024)
FIGURE 161 GERMANY MARKET SHARE ANALYSIS BY END USER (2024)
FIGURE 162 FRANCE MARKET SHARE ANALYSIS BY TYPE (2024)
FIGURE 163 FRANCE MARKET SHARE ANALYSIS BY END USER (2024)
FIGURE 164 UK MARKET SHARE ANALYSIS BY TYPE (2024)
FIGURE 165 UK MARKET SHARE ANALYSIS BY END USER (2024)
FIGURE 166 SPAIN MARKET SHARE ANALYSIS BY TYPE (2024)
FIGURE 167 SPAIN MARKET SHARE ANALYSIS BY END USER (2024)
FIGURE 168 ITALY MARKET SHARE ANALYSIS BY TYPE (2024)
FIGURE 169 ITALY MARKET SHARE ANALYSIS BY END USER (2024)
FIGURE 170 BRAZIL MARKET SHARE ANALYSIS BY TYPE (2024)
FIGURE 171 BRAZIL MARKET SHARE ANALYSIS BY END USER (2024)
FIGURE 172 ARGENTINA MARKET SHARE ANALYSIS BY TYPE (2024)
FIGURE 173 ARGENTINA MARKET SHARE ANALYSIS BY END USER (2024)
FIGURE 174 COLUMBIA MARKET SHARE ANALYSIS BY TYPE (2024)
FIGURE 175 COLUMBIA MARKET SHARE ANALYSIS BY END USER (2024)
FIGURE 176 GLOBAL SELF-CHECKOUT SYSTEM CURRENT AND FUTURE MARKET KEY COUNTRY LEVEL ANALYSIS, 2024–2034, (USD MILLION)
FIGURE 177 FINANCIAL OVERVIEW:
Key Players Analysis:
NCR Corporation: NCR Corporation stands as one of the industry giants in the self-checkout system market, leveraging decades of experience in point-of-sale technology and retail automation. The company's comprehensive portfolio includes advanced self-checkout solutions featuring integrated payment processing, inventory management capabilities, and sophisticated anti-theft measures. NCR's market leadership is reinforced by its global presence, extensive service network, and strong relationships with major retail chains worldwide. The company's focus on innovation includes the development of AI-powered features, mobile integration capabilities, and cloud-based management platforms that enhance operational efficiency and customer experience. NCR's strategic partnerships with payment processors and technology providers strengthen its competitive position and enable comprehensive solution offerings.
Diebold Nixdorf, Incorporated: Diebold Nixdorf represents a major force in the self-checkout system market, combining expertise in banking technology with retail automation solutions. The company's strength lies in its integrated approach to retail technology, offering comprehensive solutions that encompass hardware, software, and services. Diebold Nixdorf unveiled new technology for cashierless registers, leveraging AI to mitigate shrinkage, verify age for liquor purchases, and expedite transactions. The company's focus on artificial intelligence and machine learning capabilities positions it at the forefront of next-generation self-checkout technology. Diebold Nixdorf's global service network and strong financial position enable it to compete effectively in both developed and emerging markets while supporting large-scale retail implementations.
Toshiba Global Commerce Solutions: Toshiba Global Commerce Solutions has established itself as a significant player in the self-checkout system market through its focus on innovative technology and comprehensive retail solutions. The company's strengths include advanced scanning technology, integrated payment processing capabilities, and robust security features that address retailers' concerns about shrinkage and fraud. Toshiba's investment in research and development has resulted in cutting-edge features such as computer vision recognition, mobile payment integration, and analytics capabilities that provide retailers with valuable operational insights. The company's strategic focus on customer experience and operational efficiency has enabled it to secure partnerships with major retail chains and expand its market presence globally.
IBM Corporation: IBM Corporation leverages its extensive technology expertise and artificial intelligence capabilities to compete in the self-checkout system market. The company's strength lies in its advanced software solutions, analytics capabilities, and integration with broader retail technology ecosystems. IBM's Watson AI technology enhances self-checkout systems with intelligent features such as product recognition, predictive maintenance, and customer behavior analysis. The company's focus on hybrid cloud solutions and enterprise-grade security makes it particularly attractive to large retailers seeking comprehensive technology partnerships. IBM's global presence and strong brand recognition provide competitive advantages in securing enterprise-level contracts and supporting international retail deployments.
Market Key Players
IBM Corporation
Diebold Nixdorf, Incorporated
Honeywell International Inc.
ePOS HYBRID
CCL Technology
Fujitsu
OLEA Kiosk.
Gilbarco Veeder-Root Company.
ITAB
Toshiba Global Commerce Solutions
MetroClick
NCR Corporation
StrongPoint
Pyramid Computer GMBH
Driver:
Rising Labor Costs and Staff Shortages:
Retailers globally are grappling with escalating labor expenses and persistent shortages of qualified employees. Self-checkout systems help mitigate this issue by reducing reliance on cashiers and reallocating human resources to customer service roles. Particularly in developed economies, where minimum wages are rising steadily, the operational savings achieved by self-checkout deployments are substantial. As a result, even medium-sized retailers see automation as a necessity rather than an option.
Demand for Contactless Shopping Experiences:
The pandemic fundamentally altered consumer expectations regarding hygiene and convenience. Shoppers now prefer minimal physical contact during transactions. Self-checkout systems address this need by enabling touchless payments and faster processing. Retailers have responded by prioritizing upgrades and deploying more units per store to reduce queues and enhance perceived safety. This shift is expected to have a long-term impact on the market, sustaining growth momentum.
Restrain:
High Upfront Investment and Maintenance Costs:
Self-checkout solutions require significant capital expenditure. Hardware installation, software integration, and staff training contribute to high initial costs, which can deter smaller retailers. Maintenance expenses—including updates, repairs, and loss prevention systems add to the financial burden. This limits widespread adoption in resource-constrained environments.
Security Risks and Shrinkage Concerns:
Self-checkout lanes are more susceptible to theft and operational errors compared to staffed checkout. “Skip scanning,” barcode swapping, and accidental non-payment are persistent challenges. Although AI-powered loss prevention tools are emerging, many retailers remain cautious about fully transitioning to self-service due to the perceived increase in shrinkage rates.
Opportunities:
AI Integration for Loss Prevention and Customer Assistance:
Vendors are increasingly embedding machine learning algorithms and computer vision to monitor transactions in real time. These technologies can detect suspicious behavior and automatically prompt staff intervention, reducing shrinkage risks. Additionally, AI-powered virtual assistants help guide customers through the checkout process, improving usability and driving adoption in demographics less comfortable with self-service.
Growth in Emerging Markets:
As modern retail formats proliferate across Asia Pacific, Latin America, and the Middle East, demand for automated solutions will surge. Rising middle-class populations, urbanization, and increasing smartphone penetration create a fertile environment for self-checkout adoption. Manufacturers that tailor affordable, modular solutions for these regions will find ample opportunities for expansion.
Trends:
Mobile and Digital Wallet Integration:
A significant trend is the widespread integration of self-checkout with mobile wallets such as Apple Pay, Google Pay, and Alipay. Retailers are designing systems that seamlessly connect to loyalty programs, enabling faster checkouts and personalized promotions. This integration has become a competitive differentiator in attracting digitally savvy consumers.
Modular Self-Checkout Pods for Smaller Stores:
Another emerging trend is the development of compact, modular self-checkout pods suited for convenience stores and small-format retail. These solutions reduce space requirements and cost, making them viable even for independent retailers. Modular units can be scaled as needed, offering flexibility and lowering the barrier to entry for businesses previously unable to justify full-size systems.
Recent Development:
In June 2025: 365 Retail Markets has announced an agreement to acquire Cantaloupe, a leading provider of end-to-end technology solutions for self-service retail, in a transaction valued at $11.20 per share in cash. This acquisition marks a significant development in the unattended retail technology sector, bringing together two major players to create a more robust and innovative platform for operators and consumers alike.
In May 2025: Diebold Nixdorf, a global leader in retail technology, has significantly broadened its U.S. manufacturing footprint by launching a new production line dedicated to self-service checkout and kiosk systems at its North Canton, Ohio facility. This strategic move is designed to enhance supply chain reliability, increase responsiveness to domestic market needs, and deliver localized solutions for American retailers.