Self-Storage and Moving Services Market Size, Growth & Forecast | CAGR of 7.5%
Global Self-Storage and Moving Services Market Size, Share & Urban Mobility Analysis By Service Type (Storage, Relocation, On-Demand), By End User (Residential, Commercial), Smart Storage Trends, Regional Expansion, Competitive Landscape & Forecast 2025–2034
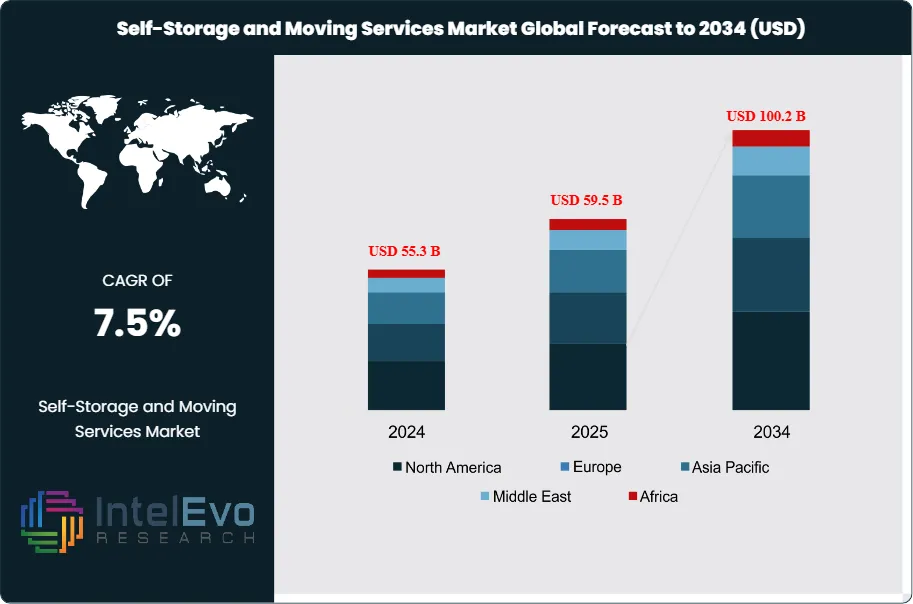
The Self-Storage and Moving Services Market is estimated at USD 55.3 billion in 2024 and is on track to reach roughly USD 100.2 billion by 2034, implying a compound annual growth rate (CAGR) of 7.5% over 2025–2034. This expansion is supported by rising urbanization, increased residential mobility, and the growing prevalence of smaller living spaces that drive demand for flexible storage solutions. Growth in e-commerce, corporate relocations, and lifestyle transitions such as downsizing and temporary housing further reinforce steady utilization rates across both self-storage facilities and professional moving services.
The industry has expanded steadily over the past decade, supported by rising urbanization, smaller living spaces, and greater workforce mobility. Demand has shifted from being primarily residential to a balanced mix of personal and commercial use, with small businesses increasingly relying on storage and relocation services to manage inventory and logistics.
The market landscape reflects both maturity and expansion potential. In the United States, more than 52,000 self-storage facilities serve an estimated 14.5 million households, making it the most developed market globally. Europe and Asia-Pacific are emerging as growth hotspots, with rising urban density and housing constraints driving adoption. The United Kingdom, for example, has seen consistent demand, with nearly four in ten households reporting use of self-storage. In Asia, rapid urban migration in countries such as China and India is creating strong demand for affordable, flexible storage solutions.
Growth is underpinned by several demand-side drivers. Urban downsizing, cross-border relocations, and the rise of e-commerce are fueling storage requirements. On the supply side, operators are expanding capacity and introducing differentiated services such as climate-controlled units, advanced security systems, and integrated moving assistance. However, the market faces challenges including high real estate costs in metropolitan areas, regulatory constraints on land use, and competitive saturation in mature regions. Operators must balance pricing with service quality to maintain profitability.
Technology is reshaping the sector. Digital booking platforms, automated access systems, and AI-enabled inventory tracking are improving customer convenience and operational efficiency. Some providers are experimenting with mobile storage units and on-demand moving services, aligning with consumer expectations for flexibility. These advancements are expected to accelerate adoption, particularly among younger demographics and small enterprises.
For investors, North America remains the largest and most stable market, while Asia-Pacific offers the highest growth potential over the next decade. Secondary cities in Europe and Latin America also present opportunities as urbanization intensifies. The industry’s trajectory reflects broader demographic and housing trends, positioning self-storage and moving services as a critical enabler of mobility, convenience, and business continuity in the global economy.
Key Takeaways
Market Growth: The global self-storage and moving services market was valued at USD 55.3 billion in 2024 and is projected to reach USD 100.2 billion by 2034, expanding at a CAGR of 7.5%. Growth is supported by urbanization, smaller housing units, and rising demand from both households and small businesses.
Service Type: Self-storage accounted for 52.3% of total revenue in 2024, reflecting strong demand for flexible storage solutions among individuals and enterprises managing inventory overflow.
Storage Type: Indoor storage represented 47.9% of the market in 2024, driven by the need for climate-controlled facilities to protect electronics, documents, and temperature-sensitive goods.
End User: Residential customers held 62.7% of the market in 2024, underscoring the impact of downsizing, relocations, and lifestyle shifts toward smaller living spaces.
Driver: Rising urban density and mobility are fueling demand. In the United States alone, more than 14.5 million households use self-storage, supported by over 52,000 facilities nationwide.
Restraint: High real estate and operating costs in metropolitan areas limit expansion, with facility development costs reducing margins by up to 15% in saturated urban markets.
Opportunity: Asia-Pacific presents the strongest growth potential, with urban migration in India and China expected to drive double-digit adoption rates. The region is forecast to outpace the global CAGR, creating attractive entry points for investors.
Trend: Technology integration is reshaping the sector. Operators are deploying digital booking platforms, automated access, and AI-enabled inventory tracking, with early adopters reporting efficiency gains of up to 20%.
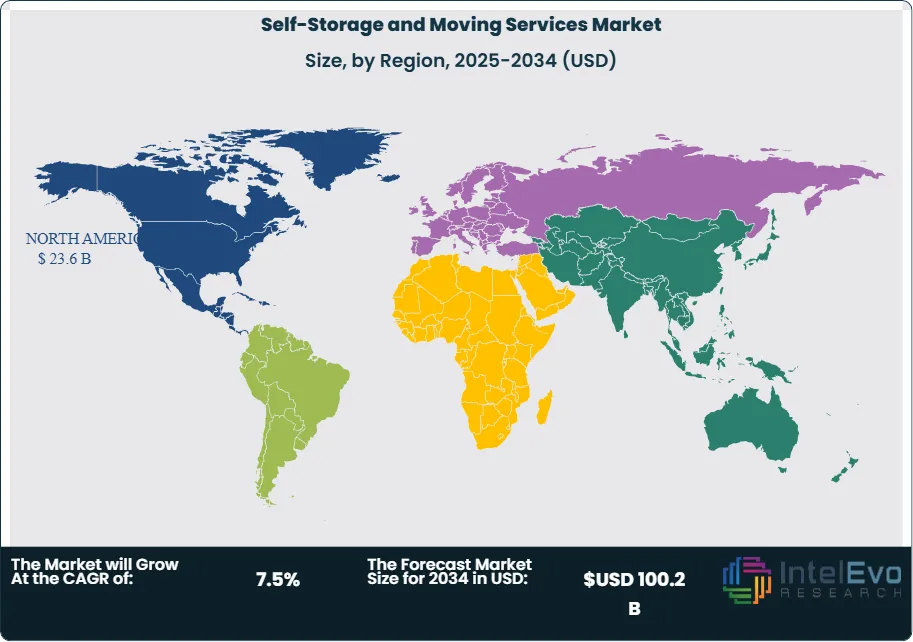
Regional Analysis: North America led the market in 2024 with a 45.2% share, valued at USD 23.64 billion, supported by mature infrastructure and high household adoption. Asia-Pacific is projected to record the fastest CAGR through 2034, while Europe shows steady growth in secondary cities where storage penetration remains below 30%.
Service Type Analysis
Self-storage continues to dominate the global market in 2025, accounting for more than half of total revenues at 52.3%. The segment’s strength is linked to rising urban density, smaller living spaces, and the growing need for flexible storage among both households and small enterprises. Customers value the ability to rent units on short or long terms, with 24/7 access and cost efficiency compared to renting larger properties. This model has become particularly attractive in metropolitan areas where housing affordability pressures are high.
Moving services represent the second-largest category, holding 31.4% of the market. These services cover packing, loading, transportation, and unloading, providing convenience for individuals and businesses relocating across cities or regions. Demand is supported by workforce mobility and cross-border relocations, with service providers increasingly offering bundled packages that combine moving and storage. Packing services account for 9.2% of the market, reflecting heightened awareness of damage risks during transit. Professional packing has become a preferred add-on, particularly for high-value goods. Truck rental, with a 7.1% share, remains a cost-sensitive option for customers who prefer to manage moves independently, though it lacks the convenience and security of full-service offerings.
Storage Type Analysis
Indoor storage leads the market with a 47.9% share in 2025, supported by demand for secure, climate-controlled environments. These facilities are favored for storing electronics, documents, antiques, and personal valuables. Enhanced security features such as gated access, surveillance, and on-site staff further strengthen adoption. Outdoor storage follows with 29.1%, offering larger and more economical units suitable for vehicles, equipment, and bulk items that do not require climate control.
Climate-controlled storage accounts for 16.5% of the market. This segment is expanding as customers seek stable temperature and humidity conditions for sensitive goods, including artwork, medical supplies, and business archives. Vehicle storage represents 6.5% of the market, driven by urban households without sufficient parking space and by seasonal demand for recreational vehicles and boats. With rising restrictions on street parking in major cities, this segment is expected to see steady growth through 2030.
End-Use Analysis
Residential users remain the largest customer base, representing 62.7% of the market in 2025. The segment is driven by relocations, downsizing, and the need for temporary storage during housing transitions. Seasonal storage of furniture, sports equipment, and personal belongings also contributes to demand. Urbanization trends, particularly in Asia and Europe, continue to reinforce residential reliance on self-storage.
Commercial users account for 27.2% of the market. Small and medium-sized enterprises increasingly use storage facilities for inventory management, seasonal stock, and equipment. Many businesses also combine storage with truck rental to streamline logistics. Industrial users represent 10.1%, with demand centered on storing machinery, spare parts, and vehicles not in daily use. While smaller in share, the industrial segment is expected to expand as manufacturing and construction firms adopt flexible storage solutions to reduce fixed warehouse costs.
Regional Analysis
North America leads the global market with a 45.2% share in 2025, valued at approximately USD 23.6 billion. The region benefits from a mature infrastructure, high consumer adoption, and the presence of established operators. Frequent relocations, high disposable incomes, and a culture of convenience continue to support growth. The U.S. alone hosts more than 52,000 self-storage facilities, serving over 14 million households.
Europe is experiencing steady expansion, particularly in the UK, Germany, and France, where urban density and apartment living drive demand. The region’s market is also shaped by professional mobility and cross-border relocations. Asia Pacific is the fastest-growing region, supported by rising middle-class incomes, urban migration, and small business adoption. China and India are key growth engines, with double-digit CAGR projections through 2030.
Latin America and the Middle East & Africa remain smaller markets but present long-term opportunities. In Latin America, Brazil and Mexico are seeing increased adoption as urbanization accelerates. In the Middle East, the UAE and Saudi Arabia are emerging hubs, supported by expatriate populations and large-scale infrastructure projects. These regions are expected to attract investment as operators expand into underserved markets.
By Service Type (Self-Storage, Moving Services, Packing Services, Truck Rental), By Storage Type (Indoor Storage, Outdoor Storage, Climate-Controlled Storage, Vehicle Storage), By End-User (Residential, Commercial, Industrial)
Research Methodology
Primary Research- 100 Interviews of Stakeholders
Secondary Research
Desk Research
Regional scope
North America (United States, Canada, Mexico)
Latin America (Brazil, Argentina, Columbia)
East Asia And Pacific (China, Japan, South Korea, Australia, Cambodia, Fiji, Indonesia)
Sea And South Asia (India, Singapore, Thailand, Taiwan, Malaysia)
Eastern Europe (Poland, Russia, Czech Republic, Romania)
Western Europe (Germany, U.K., France, Spain, Itlay)
Middle East & Africa (GCC Countries, Egypt, Nigeria, South Africa, Israel)
Competitive Landscape
SmartStop Self Storage, Bekins Van Lines, Public Storage, PODS Enterprises, CubeSmart, Rent-A-Space, Extra Space Storage, Moving APT, SpareFoot, U-Haul International, Two Men and a Truck, Life Storage
Customization Scope
Customization for segments, region/country-level will be provided. Moreover, additional customization can be done based on the requirements.
Pricing and Purchase Options
Avail customized purchase options to meet your exact research needs. We have three licenses to opt for: Single User License, Multi-User License (Up to 5 Users), Corporate Use License (Unlimited User and Printable PDF).
TABLE OF CONTENTS
1. EXECUTIVE SUMMARY
1.1. MARKET SNAPSHOT
1.2. KEY FINDINGS & INSIGHTS
1.3. ANALYST RECOMMENDATIONS
1.4. FUTURE OUTLOOK
2. RESEARCH METHODOLOGY
2.1. MARKET DEFINITION & SCOPE
2.2. RESEARCH OBJECTIVES: PRIMARY & SECONDARY DATA SOURCES
2.3. DATA COLLECTION SOURCES
2.3.1. COVERAGE OF 100+ PRIMARY RESEARCH/CONSULTATION CALLS WITH INDUSTRY STAKEHOLDERS
FIGURE 17 NORTH AMERICA SELF-STORAGE AND MOVING SERVICES CURRENT AND FUTURE TYPE ANALYSIS, 2025–2034, (USD MILLION)
FIGURE 18 NORTH AMERICA SELF-STORAGE AND MOVING SERVICES CURRENT AND FUTURE END USER ANALYSIS, 2025–2034, (USD MILLION)
FIGURE 19 MARKET SHARE BY COUNTRY
FIGURE 20 LATIN AMERICA SELF-STORAGE AND MOVING SERVICES CURRENT AND FUTURE TYPE ANALYSIS, 2025–2034, (USD MILLION)
FIGURE 21 LATIN AMERICA SELF-STORAGE AND MOVING SERVICES CURRENT AND FUTURE END USER ANALYSIS, 2025–2034, (USD MILLION)
FIGURE 22 MARKET SHARE BY COUNTRY
FIGURE 23 EASTERN EUROPE SELF-STORAGE AND MOVING SERVICES CURRENT AND FUTURE TYPE ANALYSIS, 2025–2034, (USD MILLION)
FIGURE 24 EASTERN EUROPE SELF-STORAGE AND MOVING SERVICES CURRENT AND FUTURE END USER ANALYSIS, 2025–2034, (USD MILLION)
FIGURE 25 MARKET SHARE BY COUNTRY
FIGURE 26 WESTERN EUROPE SELF-STORAGE AND MOVING SERVICES CURRENT AND FUTURE TYPE ANALYSIS, 2025–2034, (USD MILLION)
FIGURE 27 WESTERN EUROPE SELF-STORAGE AND MOVING SERVICES CURRENT AND FUTURE END USER ANALYSIS, 2025–2034, (USD MILLION)
FIGURE 28 MARKET SHARE BY COUNTRY
FIGURE 29 EAST ASIA AND PACIFIC SELF-STORAGE AND MOVING SERVICES CURRENT AND FUTURE TYPE ANALYSIS, 2025–2034, (USD MILLION)
FIGURE 30 EAST ASIA AND PACIFIC SELF-STORAGE AND MOVING SERVICES CURRENT AND FUTURE END USER ANALYSIS, 2025–2034, (USD MILLION)
FIGURE 31 MARKET SHARE BY COUNTRY
FIGURE 32 SEA AND SOUTH ASIA SELF-STORAGE AND MOVING SERVICES CURRENT AND FUTURE TYPE ANALYSIS, 2025–2034, (USD MILLION)
FIGURE 33 SEA AND SOUTH ASIA SELF-STORAGE AND MOVING SERVICES CURRENT AND FUTURE END USER ANALYSIS, 2025–2034, (USD MILLION)
FIGURE 34 MARKET SHARE BY COUNTRY
FIGURE 35 MIDDLE EAST AND AFRICA SELF-STORAGE AND MOVING SERVICES CURRENT AND FUTURE TYPE ANALYSIS, 2025–2034, (USD MILLION)
FIGURE 36 MIDDLE EAST AND AFRICA SELF-STORAGE AND MOVING SERVICES CURRENT AND FUTURE END USER ANALYSIS, 2025–2034, (USD MILLION)
FIGURE 37 NORTH AMERICA SELF-STORAGE AND MOVING SERVICES CURRENT AND FUTURE MARKET VOLUME SHARE REGIONAL ANALYSIS, 2025–2034, (USD MILLION)
FIGURE 38 U.S. SELF-STORAGE AND MOVING SERVICES CURRENT AND FUTURE TYPE ANALYSIS, 2025–2034, (USD MILLION)
FIGURE 39 U.S. SELF-STORAGE AND MOVING SERVICES CURRENT AND FUTURE END USER ANALYSIS, 2025–2034, (USD MILLION)
FIGURE 40 CANADA SELF-STORAGE AND MOVING SERVICES CURRENT AND FUTURE TYPE ANALYSIS, 2025–2034, (USD MILLION)
FIGURE 41 CANADA SELF-STORAGE AND MOVING SERVICES CURRENT AND FUTURE END USER ANALYSIS, 2025–2034, (USD MILLION)
FIGURE 42 LATIN AMERICA SELF-STORAGE AND MOVING SERVICES CURRENT AND FUTURE MARKET VOLUME SHARE REGIONAL ANALYSIS, 2025–2034, (USD MILLION)
FIGURE 43 MEXICO SELF-STORAGE AND MOVING SERVICES CURRENT AND FUTURE TYPE ANALYSIS, 2025–2034, (USD MILLION)
FIGURE 44 MEXICO SELF-STORAGE AND MOVING SERVICES CURRENT AND FUTURE END USER ANALYSIS, 2025–2034, (USD MILLION)
FIGURE 45 BRAZIL SELF-STORAGE AND MOVING SERVICES CURRENT AND FUTURE TYPE ANALYSIS, 2025–2034, (USD MILLION)
FIGURE 46 BRAZIL SELF-STORAGE AND MOVING SERVICES CURRENT AND FUTURE END USER ANALYSIS, 2025–2034, (USD MILLION)
FIGURE 47 ARGENTINA SELF-STORAGE AND MOVING SERVICES CURRENT AND FUTURE TYPE ANALYSIS, 2025–2034, (USD MILLION)
FIGURE 48 ARGENTINA SELF-STORAGE AND MOVING SERVICES CURRENT AND FUTURE END USER ANALYSIS, 2025–2034, (USD MILLION)
FIGURE 49 COLUMBIA SELF-STORAGE AND MOVING SERVICES CURRENT AND FUTURE TYPE ANALYSIS, 2025–2034, (USD MILLION)
FIGURE 50 COLUMBIA SELF-STORAGE AND MOVING SERVICES CURRENT AND FUTURE END USER ANALYSIS, 2025–2034, (USD MILLION)
FIGURE 51 REST OF LATIN AMERICA SELF-STORAGE AND MOVING SERVICES CURRENT AND FUTURE TYPE ANALYSIS, 2025–2034, (USD MILLION)
FIGURE 52 REST OF LATIN AMERICA SELF-STORAGE AND MOVING SERVICES CURRENT AND FUTURE END USER ANALYSIS, 2025–2034, (USD MILLION)
FIGURE 53 EASTERN EUROPE SELF-STORAGE AND MOVING SERVICES CURRENT AND FUTURE MARKET VOLUME SHARE REGIONAL ANALYSIS, 2025–2034, (USD MILLION)
FIGURE 54 POLAND SELF-STORAGE AND MOVING SERVICES CURRENT AND FUTURE TYPE ANALYSIS, 2025–2034, (USD MILLION)
FIGURE 55 POLAND SELF-STORAGE AND MOVING SERVICES CURRENT AND FUTURE END USER ANALYSIS, 2025–2034, (USD MILLION)
FIGURE 56 RUSSIA SELF-STORAGE AND MOVING SERVICES CURRENT AND FUTURE TYPE ANALYSIS, 2025–2034, (USD MILLION)
FIGURE 57 RUSSIA SELF-STORAGE AND MOVING SERVICES CURRENT AND FUTURE END USER ANALYSIS, 2025–2034, (USD MILLION)
FIGURE 58 CZECH REPUBLIC SELF-STORAGE AND MOVING SERVICES CURRENT AND FUTURE TYPE ANALYSIS, 2025–2034, (USD MILLION)
FIGURE 59 CZECH REPUBLIC SELF-STORAGE AND MOVING SERVICES CURRENT AND FUTURE END USER ANALYSIS, 2025–2034, (USD MILLION)
FIGURE 60 ROMANIA SELF-STORAGE AND MOVING SERVICES CURRENT AND FUTURE TYPE ANALYSIS, 2025–2034, (USD MILLION)
FIGURE 61 ROMANIA SELF-STORAGE AND MOVING SERVICES CURRENT AND FUTURE END USER ANALYSIS, 2025–2034, (USD MILLION)
FIGURE 62 REST OF EASTERN EUROPE SELF-STORAGE AND MOVING SERVICES CURRENT AND FUTURE TYPE ANALYSIS, 2025–2034, (USD MILLION)
FIGURE 63 REST OF EASTERN EUROPE SELF-STORAGE AND MOVING SERVICES CURRENT AND FUTURE END USER ANALYSIS, 2025–2034, (USD MILLION)
FIGURE 64 WESTERN EUROPE SELF-STORAGE AND MOVING SERVICES CURRENT AND FUTURE MARKET VOLUME SHARE REGIONAL ANALYSIS, 2025–2034, (USD MILLION)
FIGURE 65 GERMANY SELF-STORAGE AND MOVING SERVICES CURRENT AND FUTURE TYPE ANALYSIS, 2025–2034, (USD MILLION)
FIGURE 66 GERMANY SELF-STORAGE AND MOVING SERVICES CURRENT AND FUTURE END USER ANALYSIS, 2025–2034, (USD MILLION)
FIGURE 67 FRANCE SELF-STORAGE AND MOVING SERVICES CURRENT AND FUTURE TYPE ANALYSIS, 2025–2034, (USD MILLION)
FIGURE 68 FRANCE SELF-STORAGE AND MOVING SERVICES CURRENT AND FUTURE END USER ANALYSIS, 2025–2034, (USD MILLION)
FIGURE 69 UK SELF-STORAGE AND MOVING SERVICES CURRENT AND FUTURE TYPE ANALYSIS, 2025–2034, (USD MILLION)
FIGURE 70 UK SELF-STORAGE AND MOVING SERVICES CURRENT AND FUTURE END USER ANALYSIS, 2025–2034, (USD MILLION)
FIGURE 71 SPAIN SELF-STORAGE AND MOVING SERVICES CURRENT AND FUTURE TYPE ANALYSIS, 2025–2034, (USD MILLION)
FIGURE 72 SPAIN SELF-STORAGE AND MOVING SERVICES CURRENT AND FUTURE END USER ANALYSIS, 2025–2034, (USD MILLION)
FIGURE 73 ITALY SELF-STORAGE AND MOVING SERVICES CURRENT AND FUTURE TYPE ANALYSIS, 2025–2034, (USD MILLION)
FIGURE 74 ITALY SELF-STORAGE AND MOVING SERVICES CURRENT AND FUTURE END USER ANALYSIS, 2025–2034, (USD MILLION)
FIGURE 75 REST OF WESTERN EUROPE SELF-STORAGE AND MOVING SERVICES CURRENT AND FUTURE TYPE ANALYSIS, 2025–2034, (USD MILLION)
FIGURE 76 REST OF WESTERN EUROPE SELF-STORAGE AND MOVING SERVICES CURRENT AND FUTURE END USER ANALYSIS, 2025–2034, (USD MILLION)
FIGURE 77 EAST ASIA AND PACIFIC SELF-STORAGE AND MOVING SERVICES CURRENT AND FUTURE MARKET VOLUME SHARE REGIONAL ANALYSIS, 2025–2034, (USD MILLION)
FIGURE 78 CHINA SELF-STORAGE AND MOVING SERVICES CURRENT AND FUTURE TYPE ANALYSIS, 2025–2034, (USD MILLION)
FIGURE 79 CHINA SELF-STORAGE AND MOVING SERVICES CURRENT AND FUTURE END USER ANALYSIS, 2025–2034, (USD MILLION)
FIGURE 80 JAPAN SELF-STORAGE AND MOVING SERVICES CURRENT AND FUTURE TYPE ANALYSIS, 2025–2034, (USD MILLION)
FIGURE 81 JAPAN SELF-STORAGE AND MOVING SERVICES CURRENT AND FUTURE END USER ANALYSIS, 2025–2034, (USD MILLION)
FIGURE 82 AUSTRALIA SELF-STORAGE AND MOVING SERVICES CURRENT AND FUTURE TYPE ANALYSIS, 2025–2034, (USD MILLION)
FIGURE 83 AUSTRALIA SELF-STORAGE AND MOVING SERVICES CURRENT AND FUTURE END USER ANALYSIS, 2025–2034, (USD MILLION)
FIGURE 84 CAMBODIA SELF-STORAGE AND MOVING SERVICES CURRENT AND FUTURE TYPE ANALYSIS, 2025–2034, (USD MILLION)
FIGURE 85 CAMBODIA SELF-STORAGE AND MOVING SERVICES CURRENT AND FUTURE END USER ANALYSIS, 2025–2034, (USD MILLION)
FIGURE 86 FIJI SELF-STORAGE AND MOVING SERVICES CURRENT AND FUTURE TYPE ANALYSIS, 2025–2034, (USD MILLION)
FIGURE 87 FIJI SELF-STORAGE AND MOVING SERVICES CURRENT AND FUTURE END USER ANALYSIS, 2025–2034, (USD MILLION)
FIGURE 88 INDONESIA SELF-STORAGE AND MOVING SERVICES CURRENT AND FUTURE TYPE ANALYSIS, 2025–2034, (USD MILLION)
FIGURE 89 INDONESIA SELF-STORAGE AND MOVING SERVICES CURRENT AND FUTURE END USER ANALYSIS, 2025–2034, (USD MILLION)
FIGURE 90 SOUTH KOREA SELF-STORAGE AND MOVING SERVICES CURRENT AND FUTURE TYPE ANALYSIS, 2025–2034, (USD MILLION)
FIGURE 91 SOUTH KOREA SELF-STORAGE AND MOVING SERVICES CURRENT AND FUTURE END USER ANALYSIS, 2025–2034, (USD MILLION)
FIGURE 92 REST OF EAST ASIA AND PACIFIC SELF-STORAGE AND MOVING SERVICES CURRENT AND FUTURE TYPE ANALYSIS, 2025–2034, (USD MILLION)
FIGURE 93 REST OF EAST ASIA AND PACIFIC SELF-STORAGE AND MOVING SERVICES CURRENT AND FUTURE END USER ANALYSIS, 2025–2034, (USD MILLION)
FIGURE 94 SEA AND SOUTH ASIA SELF-STORAGE AND MOVING SERVICES CURRENT AND FUTURE MARKET VOLUME SHARE REGIONAL ANALYSIS, 2025–2034, (USD MILLION)
FIGURE 95 BANGLADESH SELF-STORAGE AND MOVING SERVICES CURRENT AND FUTURE TYPE ANALYSIS, 2025–2034, (USD MILLION)
FIGURE 96 BANGLADESH SELF-STORAGE AND MOVING SERVICES CURRENT AND FUTURE END USER ANALYSIS, 2025–2034, (USD MILLION)
FIGURE 97 NEW ZEALAND SELF-STORAGE AND MOVING SERVICES CURRENT AND FUTURE TYPE ANALYSIS, 2025–2034, (USD MILLION)
FIGURE 98 NEW ZEALAND SELF-STORAGE AND MOVING SERVICES CURRENT AND FUTURE END USER ANALYSIS, 2025–2034, (USD MILLION)
FIGURE 99 INDIA SELF-STORAGE AND MOVING SERVICES CURRENT AND FUTURE TYPE ANALYSIS, 2025–2034, (USD MILLION)
FIGURE 100 INDIA SELF-STORAGE AND MOVING SERVICES CURRENT AND FUTURE END USER ANALYSIS, 2025–2034, (USD MILLION)
FIGURE 101 SINGAPORE SELF-STORAGE AND MOVING SERVICES CURRENT AND FUTURE TYPE ANALYSIS, 2025–2034, (USD MILLION)
FIGURE 102 SINGAPORE SELF-STORAGE AND MOVING SERVICES CURRENT AND FUTURE END USER ANALYSIS, 2025–2034, (USD MILLION)
FIGURE 103 THAILAND SELF-STORAGE AND MOVING SERVICES CURRENT AND FUTURE TYPE ANALYSIS, 2025–2034, (USD MILLION)
FIGURE 104 THAILAND SELF-STORAGE AND MOVING SERVICES CURRENT AND FUTURE END USER ANALYSIS, 2025–2034, (USD MILLION)
FIGURE 105 TAIWAN SELF-STORAGE AND MOVING SERVICES CURRENT AND FUTURE TYPE ANALYSIS, 2025–2034, (USD MILLION)
FIGURE 106 TAIWAN SELF-STORAGE AND MOVING SERVICES CURRENT AND FUTURE END USER ANALYSIS, 2025–2034, (USD MILLION)
FIGURE 107 MALAYSIA SELF-STORAGE AND MOVING SERVICES CURRENT AND FUTURE TYPE ANALYSIS, 2025–2034, (USD MILLION)
FIGURE 108 MALAYSIA SELF-STORAGE AND MOVING SERVICES CURRENT AND FUTURE END USER ANALYSIS, 2025–2034, (USD MILLION)
FIGURE 109 REST OF SEA AND SOUTH ASIA SELF-STORAGE AND MOVING SERVICES CURRENT AND FUTURE TYPE ANALYSIS, 2025–2034, (USD MILLION)
FIGURE 110 REST OF SEA AND SOUTH ASIA SELF-STORAGE AND MOVING SERVICES CURRENT AND FUTURE END USER ANALYSIS, 2025–2034, (USD MILLION)
FIGURE 111 MIDDLE EAST AND AFRICA SELF-STORAGE AND MOVING SERVICES CURRENT AND FUTURE MARKET VOLUME SHARE REGIONAL ANALYSIS, 2025–2034, (USD MILLION)
FIGURE 112 GCC COUNTRIES SELF-STORAGE AND MOVING SERVICES CURRENT AND FUTURE TYPE ANALYSIS, 2025–2034, (USD MILLION)
FIGURE 113 GCC COUNTRIES SELF-STORAGE AND MOVING SERVICES CURRENT AND FUTURE END USER ANALYSIS, 2025–2034, (USD MILLION)
FIGURE 114 SAUDI ARABIA SELF-STORAGE AND MOVING SERVICES CURRENT AND FUTURE TYPE ANALYSIS, 2025–2034, (USD MILLION)
FIGURE 115 SAUDI ARABIA SELF-STORAGE AND MOVING SERVICES CURRENT AND FUTURE END USER ANALYSIS, 2025–2034, (USD MILLION)
FIGURE 116 UAE SELF-STORAGE AND MOVING SERVICES CURRENT AND FUTURE TYPE ANALYSIS, 2025–2034, (USD MILLION)
FIGURE 117 UAE SELF-STORAGE AND MOVING SERVICES CURRENT AND FUTURE END USER ANALYSIS, 2025–2034, (USD MILLION)
FIGURE 118 BAHRAIN SELF-STORAGE AND MOVING SERVICES CURRENT AND FUTURE TYPE ANALYSIS, 2025–2034, (USD MILLION)
FIGURE 119 BAHRAIN SELF-STORAGE AND MOVING SERVICES CURRENT AND FUTURE END USER ANALYSIS, 2025–2034, (USD MILLION)
FIGURE 120 KUWAIT SELF-STORAGE AND MOVING SERVICES CURRENT AND FUTURE TYPE ANALYSIS, 2025–2034, (USD MILLION)
FIGURE 121 KUWAIT SELF-STORAGE AND MOVING SERVICES CURRENT AND FUTURE END USER ANALYSIS, 2025–2034, (USD MILLION)
FIGURE 122 OMAN SELF-STORAGE AND MOVING SERVICES CURRENT AND FUTURE TYPE ANALYSIS, 2025–2034, (USD MILLION)
FIGURE 123 OMAN SELF-STORAGE AND MOVING SERVICES CURRENT AND FUTURE END USER ANALYSIS, 2025–2034, (USD MILLION)
FIGURE 124 QATAR SELF-STORAGE AND MOVING SERVICES CURRENT AND FUTURE TYPE ANALYSIS, 2025–2034, (USD MILLION)
FIGURE 125 QATAR SELF-STORAGE AND MOVING SERVICES CURRENT AND FUTURE END USER ANALYSIS, 2025–2034, (USD MILLION)
FIGURE 126 EGYPT SELF-STORAGE AND MOVING SERVICES CURRENT AND FUTURE TYPE ANALYSIS, 2025–2034, (USD MILLION)
FIGURE 127 EGYPT SELF-STORAGE AND MOVING SERVICES CURRENT AND FUTURE END USER ANALYSIS, 2025–2034, (USD MILLION)
FIGURE 128 NIGERIA SELF-STORAGE AND MOVING SERVICES CURRENT AND FUTURE TYPE ANALYSIS, 2025–2034, (USD MILLION)
FIGURE 129 NIGERIA SELF-STORAGE AND MOVING SERVICES CURRENT AND FUTURE END USER ANALYSIS, 2025–2034, (USD MILLION)
FIGURE 130 SOUTH AFRICA SELF-STORAGE AND MOVING SERVICES CURRENT AND FUTURE TYPE ANALYSIS, 2025–2034, (USD MILLION)
FIGURE 131 SOUTH AFRICA SELF-STORAGE AND MOVING SERVICES CURRENT AND FUTURE END USER ANALYSIS, 2025–2034, (USD MILLION)
FIGURE 132 ISRAEL SELF-STORAGE AND MOVING SERVICES CURRENT AND FUTURE TYPE ANALYSIS, 2025–2034, (USD MILLION)
FIGURE 133 ISRAEL SELF-STORAGE AND MOVING SERVICES CURRENT AND FUTURE END USER ANALYSIS, 2025–2034, (USD MILLION)
FIGURE 134 REST OF MEA SELF-STORAGE AND MOVING SERVICES CURRENT AND FUTURE TYPE ANALYSIS, 2025–2034, (USD MILLION)
FIGURE 135 REST OF MEA SELF-STORAGE AND MOVING SERVICES CURRENT AND FUTURE END USER ANALYSIS, 2025–2034, (USD MILLION)
FIGURE 136 U. S. MARKET SHARE ANALYSIS BY TYPE (2024)
FIGURE 137 U. S. MARKET SHARE ANALYSIS BY END USER (2024)
FIGURE 138 CANADA MARKET SHARE ANALYSIS BY TYPE (2024)
FIGURE 139 CANADA MARKET SHARE ANALYSIS BY END USER (2024)
FIGURE 140 MEXICO MARKET SHARE ANALYSIS BY TYPE (2024)
FIGURE 141 MEXICO MARKET SHARE ANALYSIS BY END USER (2024)
FIGURE 142 CHINA MARKET SHARE ANALYSIS BY TYPE (2024)
FIGURE 143 CHINA MARKET SHARE ANALYSIS BY END USER (2024)
FIGURE 144 JAPAN MARKET SHARE ANALYSIS BY TYPE (2024)
FIGURE 145 JAPAN MARKET SHARE ANALYSIS BY END USER (2024)
FIGURE 146 INDIA MARKET SHARE ANALYSIS BY TYPE (2024)
FIGURE 147 INDIA MARKET SHARE ANALYSIS BY END USER (2024)
FIGURE 148 SOUTH KOREA MARKET SHARE ANALYSIS BY TYPE (2024)
FIGURE 149 SOUTH KOREA MARKET SHARE ANALYSIS BY END USER (2024)
FIGURE 150 SAUDI ARABIA MARKET SHARE ANALYSIS BY TYPE (2024)
FIGURE 151 SAUDI ARABIA MARKET SHARE ANALYSIS BY END USER (2024)
FIGURE 152 UAE MARKET SHARE ANALYSIS BY TYPE (2024)
FIGURE 153 UAE MARKET SHARE ANALYSIS BY END USER (2024)
FIGURE 154 EGYPT MARKET SHARE ANALYSIS BY TYPE (2024)
FIGURE 155 EGYPT MARKET SHARE ANALYSIS BY END USER (2024)
FIGURE 156 NIGERIA MARKET SHARE ANALYSIS BY TYPE (2024)
FIGURE 157 NIGERIA MARKET SHARE ANALYSIS BY END USER (2024)
FIGURE 158 SOUTH AFRICA MARKET SHARE ANALYSIS BY TYPE (2024)
FIGURE 159 SOUTH AFRICA MARKET SHARE ANALYSIS BY END USER (2024)
FIGURE 160 GERMANY MARKET SHARE ANALYSIS BY TYPE (2024)
FIGURE 161 GERMANY MARKET SHARE ANALYSIS BY END USER (2024)
FIGURE 162 FRANCE MARKET SHARE ANALYSIS BY TYPE (2024)
FIGURE 163 FRANCE MARKET SHARE ANALYSIS BY END USER (2024)
FIGURE 164 UK MARKET SHARE ANALYSIS BY TYPE (2024)
FIGURE 165 UK MARKET SHARE ANALYSIS BY END USER (2024)
FIGURE 166 SPAIN MARKET SHARE ANALYSIS BY TYPE (2024)
FIGURE 167 SPAIN MARKET SHARE ANALYSIS BY END USER (2024)
FIGURE 168 ITALY MARKET SHARE ANALYSIS BY TYPE (2024)
FIGURE 169 ITALY MARKET SHARE ANALYSIS BY END USER (2024)
FIGURE 170 BRAZIL MARKET SHARE ANALYSIS BY TYPE (2024)
FIGURE 171 BRAZIL MARKET SHARE ANALYSIS BY END USER (2024)
FIGURE 172 ARGENTINA MARKET SHARE ANALYSIS BY TYPE (2024)
FIGURE 173 ARGENTINA MARKET SHARE ANALYSIS BY END USER (2024)
FIGURE 174 COLUMBIA MARKET SHARE ANALYSIS BY TYPE (2024)
FIGURE 175 COLUMBIA MARKET SHARE ANALYSIS BY END USER (2024)
FIGURE 176 GLOBAL SELF-STORAGE AND MOVING SERVICES CURRENT AND FUTURE MARKET KEY COUNTRY LEVEL ANALYSIS, 2024–2034, (USD MILLION)
FIGURE 177 FINANCIAL OVERVIEW:
Key Player Analysis
U-Haul International: U-Haul is a leader with an integrated model across self-storage, truck rental, and portable containers. Core offerings include self-storage units, U-Box containers, national truck rental, and packing supplies. In 2025, the company continues to expand self-storage capacity in major MSAs while upgrading facilities with digital bookings, telematics, and smart access. Recent initiatives include portfolio refreshes targeting occupancy stabilization and margin improvements, plus selective acquisitions to strengthen urban footprints. U-Haul’s differentiators are national scale, cross-sell synergies, and high brand recall. The portable container segment is a growth driver, supported by strong demand for flexible, on-demand moving and storage. Management reports stable occupancy in core markets and solid growth in ancillary services, improving unit economics and cash flow resilience.
CubeSmart: CubeSmart positions as a challenger focused on urban density and operational discipline. It offers self-storage units with a strong mix of climate-controlled inventory, digital reservations, and third-party management services. In 2025, CubeSmart invests in data-driven pricing, targeted marketing, and selective acquisitions in top-30 MSAs. The company is rolling out AI-assisted revenue management and dynamic inventory allocation to lift occupancy and rate integrity. Differentiation comes from urban concentration, customer-friendly digital journeys, and measured cost control. Same-store metrics show modest rent growth and stable occupancy, with marketing ROI improving through a higher share of web-driven sales. The portfolio’s emphasis on climate-controlled and secure facilities aligns with rising demand for protected storage categories.
Life Storage: Life Storage operates as a branded portfolio within a consolidated platform and remains a strong performer in premium, climate-controlled assets. The brand focuses on self-storage with digital booking, enhanced security, and value-added services such as tenant insurance and last-mile moving partnerships. In 2025, management prioritizes rate alignment, brand standardization, and tech upgrades that include smart locks and app-based access. The strategy emphasizes pricing power in high-demand corridors and NPS-led retention. Differentiators include a concentration in suburban growth markets, above-average climate-controlled mix, and disciplined yield management. Portfolio performance indicates positive rent lifts post-rebranding and efficiency gains from unified operations and centralized analytics.
Moving APT: Moving APT is a niche player in brokerage-driven moving services with national carrier coverage and digital booking. Core services include full-service and partial-service relocations, long-distance moves, and integrated packing add-ons. In 2025, the company focuses on platform enhancements, partner vetting, and transparent pricing. It expands into corporate relocation packages and subscription-style storage tie-ins with regional operators. Differentiation stems from aggregator scale, route optimization, and customer service transparency. As bookings shift online, Moving APT benefits from higher conversion rates and multi-carrier comparisons that pressure costs. The firm’s asset-light approach enables rapid market entry while maintaining flexibility to adjust capacity across seasonal demand cycles.
Market Key Players
SmartStop Self Storage
Bekins Van Lines
Public Storage
PODS Enterprises
CubeSmart
Rent-A-Space
Extra Space Storage
Moving APT
SpareFoot
U-Haul International
Two Men and a Truck
Life Storage
Driver:
Urbanization and Space Constraints
By 2025, the self-storage and moving services market is growing steadily due to rapid urbanization and increasing consumer demand for convenience. With over 56% of the global population living in cities, smaller living spaces and frequent moves are boosting the need for external storage solutions. Self-storage makes up more than half of total market revenues, showing its importance as a flexible and affordable choice for households and small businesses dealing with space issues.
E-commerce Expansion and Income Growth
The rise of e-commerce is increasing demand, as online retailers and small businesses increasingly rely on storage units for excess inventory. At the same time, growing disposable incomes allow consumers to pay for on-demand moving and storage services that save time and effort. These changes indicate ongoing demand in both residential and commercial sectors, presenting lasting growth opportunities for investors in both established and emerging markets.
Restraint:
High Operating and Real Estate Costs
High operating costs pose a significant challenge, especially in urban areas where real estate and construction expenses can raise rental prices by 15 to 20%. These higher costs make it less affordable for middle- and lower-income customers and limit the market's reach in crowded cities. Operators must balance maintaining profitability while offering competitive prices.
Security Concerns and Demand Volatility
Security issues also impact adoption, particularly for customers storing valuable items. Facilities without good surveillance, climate control, or access management systems often see lower occupancy rates. Additionally, seasonal demand changes—rising during summer and year-end moves—lead to revenue fluctuations. These factors put pressure on profit margins and increase the need for operational efficiency and service differentiation.
Opportunity:
Emerging Market Penetration
Emerging markets present the best growth potential through 2030. The Asia-Pacific region, particularly China and India, is expected to see double-digit growth as urban migration speeds up and middle-class families seek flexible storage options. Low current penetration rates and improving infrastructure create a favorable environment for new facility development and service growth.
Technology-Enabled Service Models
Technology is creating new revenue streams throughout the value chain. Mobile self-storage units, on-demand pickup and delivery, and automated booking platforms are appealing to younger, tech-savvy consumers. Facilities that provide smart locks, remote access, and bundled services like packing and unpacking are enhancing customer loyalty while increasing average revenue per user.
Trend:
Climate-Controlled and Premium Storage
Climate-controlled storage is becoming a key differentiator in 2025, driven by the rising need to protect electronics, antiques, pharmaceuticals, and sensitive documents. This segment is growing faster than standard storage, supported by both residential and commercial customers willing to pay more for security and reliability.
Digitalization and Sustainability Focus
Digital platforms are changing how customers engage, with over 70% of bookings in mature markets now made online or through mobile apps. Subscription-based pricing models are gaining popularity, providing predictable costs for customers and steady revenue for operators. Sustainability is becoming increasingly important, with providers adopting reusable packing materials, electric moving fleets, and energy-efficient facilities to meet changing consumer preferences and regulatory standards.
Recent Developments
Dec 2024 – U-Haul International: Announced a significant investment in its green moving initiative, committing to add over 5,000 electric-powered moving vans to its fleet by the end of 2025. The program, valued at over $300 million, also includes replacing standard cardboard boxes with reusable packing crates across its North American locations. This move strengthens the company’s market position among environmentally conscious consumers and aligns with growing demand for sustainable relocation services.
Feb 2025 – CubeSmart: Rolled out an advanced AI-powered logistics platform for its moving services division, optimizing route planning and vehicle load management. The system uses real-time traffic and weather data to reduce fuel consumption by a projected 15% and improve on-time delivery rates. This technological adoption enhances operational efficiency and provides a more reliable customer experience.
Apr 2025 – Public Storage: Completed its acquisition of "StowAway Solutions," a tech-focused startup specializing in IoT-enabled smart storage units, in a deal valued at approximately $150 million. The acquisition integrates smart locking and remote monitoring features into Public Storage’s existing offerings. This strategic purchase accelerates the company's digital transformation and addresses customer demand for higher security and convenience
Jul 2025 – Extra Space Storage Inc.: Launched a partnership with several major real estate developers to embed on-demand storage and moving services directly into new residential housing communities. The program is being piloted in over 30 high-density urban developments, offering residents preferred access and integrated billing. This collaboration creates a new, direct-to-consumer sales channel and secures a captive customer base in high-growth urban centers.
Sep 2025 – National Storage Affiliates Trust: Announced its expansion into the flexible warehousing market, converting portions of 50 facilities into co-warehousing spaces for small e-commerce businesses. The service provides inventory management, packing stations, and last-mile delivery coordination. This diversification allows the company to tap into the rapidly growing small business and e-commerce sector, creating a new, stable revenue stream.