Global Semi-Trailer Dealership Market Size, Share, Analysis By Product Type (New Semi-Trailers, Used Semi-Trailers), By Application (Freight Transportation, Logistics Services, Construction and Heavy Haul, Specialized Transport), By End-Use (Fleet Operators, Owner-Operators, Leasing Companies) Industry Region & Key Players–Industry Segment Overview, Market Dynamics, Competitive Strategies, Fleet Modernization Trends, Logistics Infrastructure Investments & Forecast 2026–2034
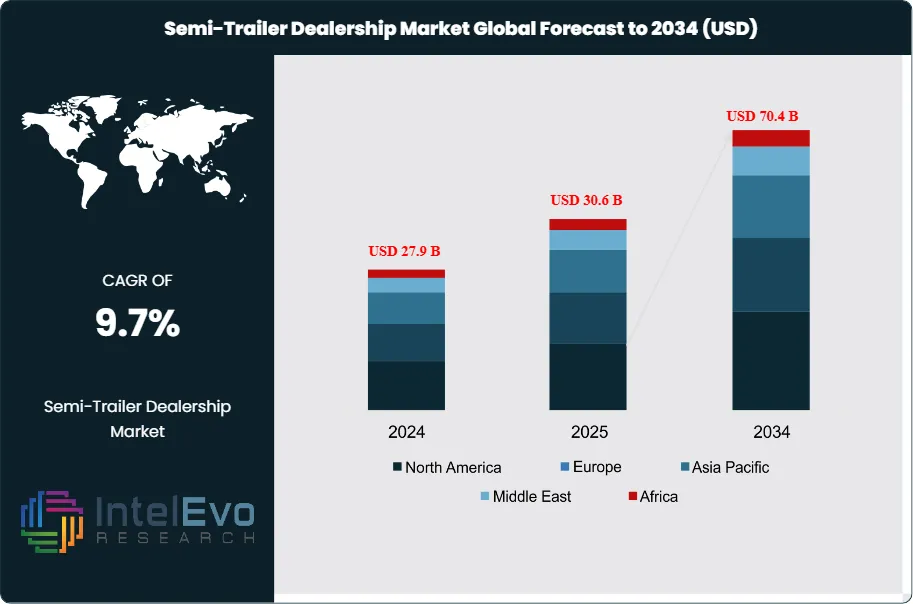
The Semi-Trailer Dealership Market was valued at USD 27.9 billion in 2024 and is projected to reach approximately USD 30.6 billion in 2025. The market is further expected to expand to nearly USD 70.4 billion by 2034, registering a compound annual growth rate (CAGR) of about 9.7% during the forecast period from 2026 to 2034. Growth in the market is driven by the rising demand for freight transportation, expanding e-commerce logistics networks, and increasing cross-border trade activities. Semi-trailer dealerships play a critical role in providing fleets with access to new and used trailers, financing solutions, and aftermarket services.
Additionally, the ongoing modernization of commercial vehicle fleets, adoption of advanced trailer technologies, and growing investments in logistics infrastructure are expected to further support the expansion of semi-trailer dealership networks worldwide.
Dealerships serve as the interface between trailer OEMs and freight operators. They earn from new and used unit sales, leasing and financing facilitation, parts distribution, and workshop labor. The channel is consolidating as multi-location groups standardize inventory and expand service coverage, while independents compete on proximity and faster cycle times. Service and parts contribute an estimated 35%–45% of dealer gross profit, raising emphasis on contract maintenance and parts availability.
Demand growth follows freight volumes and replacement cycles. E-commerce supports dry-van and regional distribution demand, while cold-chain expansion sustains utilization of temperature-controlled equipment. Fleet buyers prioritize payload efficiency, aerodynamic performance, and uptime, and they require advisory support on specifications and total cost of ownership. Dealerships that bundle maintenance, mobile service, and telematics onboarding tend to secure higher share of wallet and steadier revenue.
Supply conditions remain a constraint. OEM allocation discipline, lead times for axles, tires, and refrigeration components, and parts availability influence delivery schedules and used-trailer turnover. Financing also shapes mix. When rates rise, fleets shift toward leasing and deferred replacement, which increases the value of remarketing expertise and residual-value governance.
Regulation shapes inventory and service strategy. Emissions and fuel-efficiency mandates, safety compliance, and evolving weight rules increase demand for lightweight materials, aerodynamic kits, electronic braking diagnostics, and condition monitoring. Dealers also manage technician shortages, warranty complexity, and cybersecurity exposure as connected service tools link to fleet systems.
Technology is moving the model from transactional selling to fleet enablement. AI supports demand forecasting, dynamic pricing for used inventory, and predictive maintenance scheduling from workshop and telematics data. Automation improves parts picking and bay utilization. E-trailer pilots reinforce the efficiency thesis: BMW Group testing reported up to 250 kilometres per day and an average diesel reduction of 46.59% with loads exceeding 16 tonnes, plus CO2 reduction near 120 tonnes annually per unit.
Regionally, North America remains the largest profit pool at roughly 30%–35% share, while Asia-Pacific posts the fastest expansion as India and Southeast Asia scale logistics-park and corridor investment. Mexico nearshoring lanes and Gulf intermodal corridors are emerging growth hotspots.
Key Takeaways
Market Growth: The market expands from 27.9 billion USD, 2024 to 70.4 billion USD, 2034 across 2026-2034. It delivers a 9.7% CAGR, 2026-2034.
Segment Dominance: New Semi-Trailers lead by product type at 67.2%, 2024. Dealer revenue concentrates in new-unit programs worth 18.8 billion USD, 2024.
Segment Dominance: Freight Transportation leads by application at 49.4%, 2024. Freight-linked dealership turnover reaches 13.8 billion USD, 2024.
Driver: Fleet operators accelerate modernization to meet compliance and uptime targets, sustaining 56.8%, 2024 demand share. Replacement-led purchasing cycles support estimated: 2.0% annual unit refresh, 2024.
Restraint: Higher financing costs and rate volatility suppress discretionary upgrades, creating estimated: 9.0% deal deferrals, 2024. Supply lead-times constrain availability and reduce inventory turns to estimate: 3.0 turns per year, 2024.
Opportunity: Electrified e-trailer deployments open attach revenue in charging coordination and technical service, estimated: 0.6 billion USD, 2030. Efficiency gains of 46.6%, 2024 strengthen the value case for advanced trailers.
Trend: Dealerships embed AI and digital tools to raise conversion and optimize service scheduling, estimated: 35.0% dealer adoption, 2024. Digital aftermarket and telematics pull-through lift service revenue to estimate: 40.0% of gross profit, 2024.
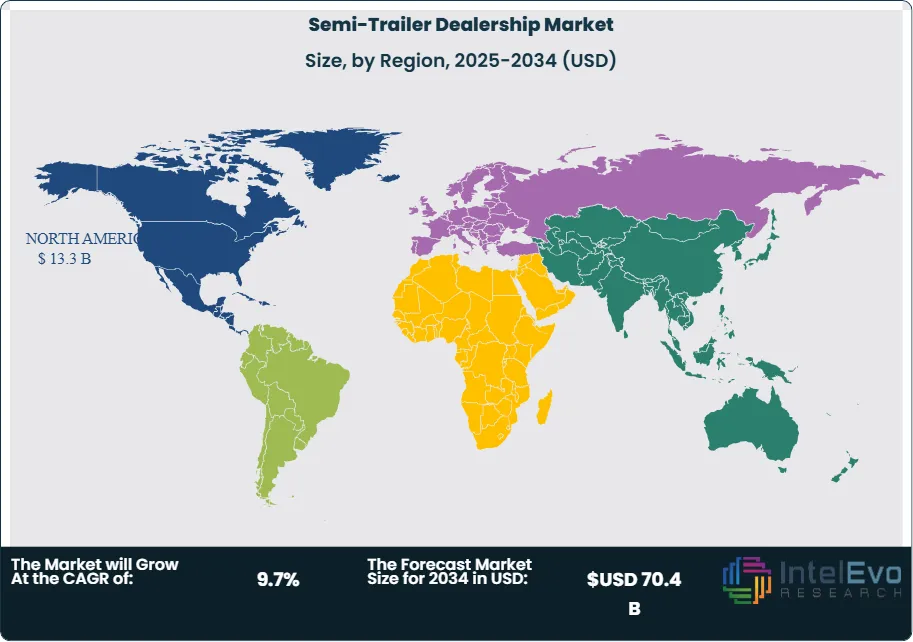
Regional Analysis: North America leads with 47.9%, 2024 share and 13.3 billion USD, 2024 value. Growth shifts to cross-border and intermodal corridors, estimated: 2.5 billion USD, 2034.
By Type
New semi-trailers account for the majority of dealership revenue as fleets prioritize regulatory compliance and operating efficiency. In 2025, new units continue to represent about 67% of total volume, supported by replacement demand across long-haul and regional freight fleets. Buyers favor factory-built trailers equipped with advanced braking systems, aerodynamic features, and telematics-ready architecture to meet tightening safety and emissions requirements in North America and Europe.
Fleet renewal cycles remain a core demand driver. Large operators typically replace trailers every seven to ten years, which sustains baseline dealership volumes even during softer freight cycles. Warranty coverage and predictable lifecycle costs further support preference for new equipment, particularly among fleets managing several thousand assets.
Used semi-trailers serve budget-conscious operators and short-term capacity needs. Demand concentrates on younger assets with documented service history. While compliance concerns limit broader uptake, used units deliver faster inventory turnover and flexible pricing. Small carriers and owner-operators rely on this segment to manage capital constraints, keeping used trailers relevant in dealership portfolios.
By Application
Freight transportation remains the largest application segment, contributing close to 49% of dealership demand in 2025. Long-haul and cross-border trade flows support consistent purchases of dry vans, flatbeds, and refrigerated trailers. Retail distribution, manufacturing output, and agricultural exports anchor baseline volumes across developed markets.
Logistics services continue to expand as third-party providers invest in regional hubs and spoke networks. Rising e-commerce penetration supports demand for standardized trailer configurations designed for high utilization and rapid loading cycles. This segment favors volume orders and service contracts, strengthening dealership recurring revenue.
Construction and heavy haul applications provide steady but cyclical demand tied to infrastructure spending. Specialized transport remains smaller in volume but delivers higher margins through customization for temperature-controlled, hazardous, and oversized cargo.
By End-Use
Fleet operators represent the largest end-use group, accounting for nearly 57% of dealership sales in 2025. Bulk procurement, structured replacement planning, and centralized maintenance strategies reinforce long-term dealership relationships. Financing packages and service agreements remain key differentiators.
Owner-operators form a stable secondary segment. Purchasing decisions emphasize affordability and flexibility. Trade-in programs and deferred payment structures influence dealer selection.
Leasing companies maintain a growing presence as fleets shift toward asset-light models. Their focus on residual value and durability increases demand for standardized trailer specifications.
By Region
North America leads the market with about 48% share, valued near USD 13 billion, driven by dense highway networks and high freight intensity. Europe shows stable demand supported by cross-border trade and regulatory alignment. Asia Pacific posts the fastest growth, led by China and India, as highway investment and organized logistics expand. Latin America and the Middle East and Africa show moderate growth tied to trade corridors, mining, energy logistics, and gradual infrastructure upgrades.
By Product Type (New Semi-Trailers, Used Semi-Trailers), By Application (Freight Transportation, Logistics Services, Construction and Heavy Haul, Specialized Transport), By End-Use (Fleet Operators, Owner-Operators, Leasing Companies)
Research Methodology
Primary Research- 100 Interviews of Stakeholders
Secondary Research
Desk Research
Regional scope
North America (United States, Canada, Mexico)
Latin America (Brazil, Argentina, Columbia)
East Asia And Pacific (China, Japan, South Korea, Australia, Cambodia, Fiji, Indonesia)
Sea And South Asia (India, Singapore, Thailand, Taiwan, Malaysia)
Eastern Europe (Poland, Russia, Czech Republic, Romania)
Western Europe (Germany, U.K., France, Spain, Itlay)
Middle East & Africa (GCC Countries, Egypt, Nigeria, South Africa, Israel)
Customization for segments, region/country-level will be provided. Moreover, additional customization can be done based on the requirements.
Pricing and Purchase Options
Avail customized purchase options to meet your exact research needs. We have three licenses to opt for: Single User License, Multi-User License (Up to 5 Users), Corporate Use License (Unlimited User and Printable PDF).
TABLE OF CONTENTS
1. EXECUTIVE SUMMARY
1.1. MARKET SNAPSHOT
1.2. KEY FINDINGS & INSIGHTS
1.3. ANALYST RECOMMENDATIONS
1.4. FUTURE OUTLOOK
2. RESEARCH METHODOLOGY
2.1. MARKET DEFINITION & SCOPE
2.2. RESEARCH OBJECTIVES: PRIMARY & SECONDARY DATA SOURCES
2.3. DATA COLLECTION SOURCES
2.3.1. COVERAGE OF 100+ PRIMARY RESEARCH/CONSULTATION CALLS WITH INDUSTRY STAKEHOLDERS
FIGURE 17 NORTH AMERICA SEMI-TRAILER DEALERSHIP CURRENT AND FUTURE TYPE ANALYSIS, 2025–2034, (USD MILLION)
FIGURE 18 NORTH AMERICA SEMI-TRAILER DEALERSHIP CURRENT AND FUTURE END USER ANALYSIS, 2025–2034, (USD MILLION)
FIGURE 19 MARKET SHARE BY COUNTRY
FIGURE 20 LATIN AMERICA SEMI-TRAILER DEALERSHIP CURRENT AND FUTURE TYPE ANALYSIS, 2025–2034, (USD MILLION)
FIGURE 21 LATIN AMERICA SEMI-TRAILER DEALERSHIP CURRENT AND FUTURE END USER ANALYSIS, 2025–2034, (USD MILLION)
FIGURE 22 MARKET SHARE BY COUNTRY
FIGURE 23 EASTERN EUROPE SEMI-TRAILER DEALERSHIP CURRENT AND FUTURE TYPE ANALYSIS, 2025–2034, (USD MILLION)
FIGURE 24 EASTERN EUROPE SEMI-TRAILER DEALERSHIP CURRENT AND FUTURE END USER ANALYSIS, 2025–2034, (USD MILLION)
FIGURE 25 MARKET SHARE BY COUNTRY
FIGURE 26 WESTERN EUROPE SEMI-TRAILER DEALERSHIP CURRENT AND FUTURE TYPE ANALYSIS, 2025–2034, (USD MILLION)
FIGURE 27 WESTERN EUROPE SEMI-TRAILER DEALERSHIP CURRENT AND FUTURE END USER ANALYSIS, 2025–2034, (USD MILLION)
FIGURE 28 MARKET SHARE BY COUNTRY
FIGURE 29 EAST ASIA AND PACIFIC SEMI-TRAILER DEALERSHIP CURRENT AND FUTURE TYPE ANALYSIS, 2025–2034, (USD MILLION)
FIGURE 30 EAST ASIA AND PACIFIC SEMI-TRAILER DEALERSHIP CURRENT AND FUTURE END USER ANALYSIS, 2025–2034, (USD MILLION)
FIGURE 31 MARKET SHARE BY COUNTRY
FIGURE 32 SEA AND SOUTH ASIA SEMI-TRAILER DEALERSHIP CURRENT AND FUTURE TYPE ANALYSIS, 2025–2034, (USD MILLION)
FIGURE 33 SEA AND SOUTH ASIA SEMI-TRAILER DEALERSHIP CURRENT AND FUTURE END USER ANALYSIS, 2025–2034, (USD MILLION)
FIGURE 34 MARKET SHARE BY COUNTRY
FIGURE 35 MIDDLE EAST AND AFRICA SEMI-TRAILER DEALERSHIP CURRENT AND FUTURE TYPE ANALYSIS, 2025–2034, (USD MILLION)
FIGURE 36 MIDDLE EAST AND AFRICA SEMI-TRAILER DEALERSHIP CURRENT AND FUTURE END USER ANALYSIS, 2025–2034, (USD MILLION)
FIGURE 37 NORTH AMERICA SEMI-TRAILER DEALERSHIP CURRENT AND FUTURE MARKET VOLUME SHARE REGIONAL ANALYSIS, 2025–2034, (USD MILLION)
FIGURE 38 U.S. SEMI-TRAILER DEALERSHIP CURRENT AND FUTURE TYPE ANALYSIS, 2025–2034, (USD MILLION)
FIGURE 39 U.S. SEMI-TRAILER DEALERSHIP CURRENT AND FUTURE END USER ANALYSIS, 2025–2034, (USD MILLION)
FIGURE 40 CANADA SEMI-TRAILER DEALERSHIP CURRENT AND FUTURE TYPE ANALYSIS, 2025–2034, (USD MILLION)
FIGURE 41 CANADA SEMI-TRAILER DEALERSHIP CURRENT AND FUTURE END USER ANALYSIS, 2025–2034, (USD MILLION)
FIGURE 42 LATIN AMERICA SEMI-TRAILER DEALERSHIP CURRENT AND FUTURE MARKET VOLUME SHARE REGIONAL ANALYSIS, 2025–2034, (USD MILLION)
FIGURE 43 MEXICO SEMI-TRAILER DEALERSHIP CURRENT AND FUTURE TYPE ANALYSIS, 2025–2034, (USD MILLION)
FIGURE 44 MEXICO SEMI-TRAILER DEALERSHIP CURRENT AND FUTURE END USER ANALYSIS, 2025–2034, (USD MILLION)
FIGURE 45 BRAZIL SEMI-TRAILER DEALERSHIP CURRENT AND FUTURE TYPE ANALYSIS, 2025–2034, (USD MILLION)
FIGURE 46 BRAZIL SEMI-TRAILER DEALERSHIP CURRENT AND FUTURE END USER ANALYSIS, 2025–2034, (USD MILLION)
FIGURE 47 ARGENTINA SEMI-TRAILER DEALERSHIP CURRENT AND FUTURE TYPE ANALYSIS, 2025–2034, (USD MILLION)
FIGURE 48 ARGENTINA SEMI-TRAILER DEALERSHIP CURRENT AND FUTURE END USER ANALYSIS, 2025–2034, (USD MILLION)
FIGURE 49 COLUMBIA SEMI-TRAILER DEALERSHIP CURRENT AND FUTURE TYPE ANALYSIS, 2025–2034, (USD MILLION)
FIGURE 50 COLUMBIA SEMI-TRAILER DEALERSHIP CURRENT AND FUTURE END USER ANALYSIS, 2025–2034, (USD MILLION)
FIGURE 51 REST OF LATIN AMERICA SEMI-TRAILER DEALERSHIP CURRENT AND FUTURE TYPE ANALYSIS, 2025–2034, (USD MILLION)
FIGURE 52 REST OF LATIN AMERICA SEMI-TRAILER DEALERSHIP CURRENT AND FUTURE END USER ANALYSIS, 2025–2034, (USD MILLION)
FIGURE 53 EASTERN EUROPE SEMI-TRAILER DEALERSHIP CURRENT AND FUTURE MARKET VOLUME SHARE REGIONAL ANALYSIS, 2025–2034, (USD MILLION)
FIGURE 54 POLAND SEMI-TRAILER DEALERSHIP CURRENT AND FUTURE TYPE ANALYSIS, 2025–2034, (USD MILLION)
FIGURE 55 POLAND SEMI-TRAILER DEALERSHIP CURRENT AND FUTURE END USER ANALYSIS, 2025–2034, (USD MILLION)
FIGURE 56 RUSSIA SEMI-TRAILER DEALERSHIP CURRENT AND FUTURE TYPE ANALYSIS, 2025–2034, (USD MILLION)
FIGURE 57 RUSSIA SEMI-TRAILER DEALERSHIP CURRENT AND FUTURE END USER ANALYSIS, 2025–2034, (USD MILLION)
FIGURE 58 CZECH REPUBLIC SEMI-TRAILER DEALERSHIP CURRENT AND FUTURE TYPE ANALYSIS, 2025–2034, (USD MILLION)
FIGURE 59 CZECH REPUBLIC SEMI-TRAILER DEALERSHIP CURRENT AND FUTURE END USER ANALYSIS, 2025–2034, (USD MILLION)
FIGURE 60 ROMANIA SEMI-TRAILER DEALERSHIP CURRENT AND FUTURE TYPE ANALYSIS, 2025–2034, (USD MILLION)
FIGURE 61 ROMANIA SEMI-TRAILER DEALERSHIP CURRENT AND FUTURE END USER ANALYSIS, 2025–2034, (USD MILLION)
FIGURE 62 REST OF EASTERN EUROPE SEMI-TRAILER DEALERSHIP CURRENT AND FUTURE TYPE ANALYSIS, 2025–2034, (USD MILLION)
FIGURE 63 REST OF EASTERN EUROPE SEMI-TRAILER DEALERSHIP CURRENT AND FUTURE END USER ANALYSIS, 2025–2034, (USD MILLION)
FIGURE 64 WESTERN EUROPE SEMI-TRAILER DEALERSHIP CURRENT AND FUTURE MARKET VOLUME SHARE REGIONAL ANALYSIS, 2025–2034, (USD MILLION)
FIGURE 65 GERMANY SEMI-TRAILER DEALERSHIP CURRENT AND FUTURE TYPE ANALYSIS, 2025–2034, (USD MILLION)
FIGURE 66 GERMANY SEMI-TRAILER DEALERSHIP CURRENT AND FUTURE END USER ANALYSIS, 2025–2034, (USD MILLION)
FIGURE 67 FRANCE SEMI-TRAILER DEALERSHIP CURRENT AND FUTURE TYPE ANALYSIS, 2025–2034, (USD MILLION)
FIGURE 68 FRANCE SEMI-TRAILER DEALERSHIP CURRENT AND FUTURE END USER ANALYSIS, 2025–2034, (USD MILLION)
FIGURE 69 UK SEMI-TRAILER DEALERSHIP CURRENT AND FUTURE TYPE ANALYSIS, 2025–2034, (USD MILLION)
FIGURE 70 UK SEMI-TRAILER DEALERSHIP CURRENT AND FUTURE END USER ANALYSIS, 2025–2034, (USD MILLION)
FIGURE 71 SPAIN SEMI-TRAILER DEALERSHIP CURRENT AND FUTURE TYPE ANALYSIS, 2025–2034, (USD MILLION)
FIGURE 72 SPAIN SEMI-TRAILER DEALERSHIP CURRENT AND FUTURE END USER ANALYSIS, 2025–2034, (USD MILLION)
FIGURE 73 ITALY SEMI-TRAILER DEALERSHIP CURRENT AND FUTURE TYPE ANALYSIS, 2025–2034, (USD MILLION)
FIGURE 74 ITALY SEMI-TRAILER DEALERSHIP CURRENT AND FUTURE END USER ANALYSIS, 2025–2034, (USD MILLION)
FIGURE 75 REST OF WESTERN EUROPE SEMI-TRAILER DEALERSHIP CURRENT AND FUTURE TYPE ANALYSIS, 2025–2034, (USD MILLION)
FIGURE 76 REST OF WESTERN EUROPE SEMI-TRAILER DEALERSHIP CURRENT AND FUTURE END USER ANALYSIS, 2025–2034, (USD MILLION)
FIGURE 77 EAST ASIA AND PACIFIC SEMI-TRAILER DEALERSHIP CURRENT AND FUTURE MARKET VOLUME SHARE REGIONAL ANALYSIS, 2025–2034, (USD MILLION)
FIGURE 78 CHINA SEMI-TRAILER DEALERSHIP CURRENT AND FUTURE TYPE ANALYSIS, 2025–2034, (USD MILLION)
FIGURE 79 CHINA SEMI-TRAILER DEALERSHIP CURRENT AND FUTURE END USER ANALYSIS, 2025–2034, (USD MILLION)
FIGURE 80 JAPAN SEMI-TRAILER DEALERSHIP CURRENT AND FUTURE TYPE ANALYSIS, 2025–2034, (USD MILLION)
FIGURE 81 JAPAN SEMI-TRAILER DEALERSHIP CURRENT AND FUTURE END USER ANALYSIS, 2025–2034, (USD MILLION)
FIGURE 82 AUSTRALIA SEMI-TRAILER DEALERSHIP CURRENT AND FUTURE TYPE ANALYSIS, 2025–2034, (USD MILLION)
FIGURE 83 AUSTRALIA SEMI-TRAILER DEALERSHIP CURRENT AND FUTURE END USER ANALYSIS, 2025–2034, (USD MILLION)
FIGURE 84 CAMBODIA SEMI-TRAILER DEALERSHIP CURRENT AND FUTURE TYPE ANALYSIS, 2025–2034, (USD MILLION)
FIGURE 85 CAMBODIA SEMI-TRAILER DEALERSHIP CURRENT AND FUTURE END USER ANALYSIS, 2025–2034, (USD MILLION)
FIGURE 86 FIJI SEMI-TRAILER DEALERSHIP CURRENT AND FUTURE TYPE ANALYSIS, 2025–2034, (USD MILLION)
FIGURE 87 FIJI SEMI-TRAILER DEALERSHIP CURRENT AND FUTURE END USER ANALYSIS, 2025–2034, (USD MILLION)
FIGURE 88 INDONESIA SEMI-TRAILER DEALERSHIP CURRENT AND FUTURE TYPE ANALYSIS, 2025–2034, (USD MILLION)
FIGURE 89 INDONESIA SEMI-TRAILER DEALERSHIP CURRENT AND FUTURE END USER ANALYSIS, 2025–2034, (USD MILLION)
FIGURE 90 SOUTH KOREA SEMI-TRAILER DEALERSHIP CURRENT AND FUTURE TYPE ANALYSIS, 2025–2034, (USD MILLION)
FIGURE 91 SOUTH KOREA SEMI-TRAILER DEALERSHIP CURRENT AND FUTURE END USER ANALYSIS, 2025–2034, (USD MILLION)
FIGURE 92 REST OF EAST ASIA AND PACIFIC SEMI-TRAILER DEALERSHIP CURRENT AND FUTURE TYPE ANALYSIS, 2025–2034, (USD MILLION)
FIGURE 93 REST OF EAST ASIA AND PACIFIC SEMI-TRAILER DEALERSHIP CURRENT AND FUTURE END USER ANALYSIS, 2025–2034, (USD MILLION)
FIGURE 94 SEA AND SOUTH ASIA SEMI-TRAILER DEALERSHIP CURRENT AND FUTURE MARKET VOLUME SHARE REGIONAL ANALYSIS, 2025–2034, (USD MILLION)
FIGURE 95 BANGLADESH SEMI-TRAILER DEALERSHIP CURRENT AND FUTURE TYPE ANALYSIS, 2025–2034, (USD MILLION)
FIGURE 96 BANGLADESH SEMI-TRAILER DEALERSHIP CURRENT AND FUTURE END USER ANALYSIS, 2025–2034, (USD MILLION)
FIGURE 97 NEW ZEALAND SEMI-TRAILER DEALERSHIP CURRENT AND FUTURE TYPE ANALYSIS, 2025–2034, (USD MILLION)
FIGURE 98 NEW ZEALAND SEMI-TRAILER DEALERSHIP CURRENT AND FUTURE END USER ANALYSIS, 2025–2034, (USD MILLION)
FIGURE 99 INDIA SEMI-TRAILER DEALERSHIP CURRENT AND FUTURE TYPE ANALYSIS, 2025–2034, (USD MILLION)
FIGURE 100 INDIA SEMI-TRAILER DEALERSHIP CURRENT AND FUTURE END USER ANALYSIS, 2025–2034, (USD MILLION)
FIGURE 101 SINGAPORE SEMI-TRAILER DEALERSHIP CURRENT AND FUTURE TYPE ANALYSIS, 2025–2034, (USD MILLION)
FIGURE 102 SINGAPORE SEMI-TRAILER DEALERSHIP CURRENT AND FUTURE END USER ANALYSIS, 2025–2034, (USD MILLION)
FIGURE 103 THAILAND SEMI-TRAILER DEALERSHIP CURRENT AND FUTURE TYPE ANALYSIS, 2025–2034, (USD MILLION)
FIGURE 104 THAILAND SEMI-TRAILER DEALERSHIP CURRENT AND FUTURE END USER ANALYSIS, 2025–2034, (USD MILLION)
FIGURE 105 TAIWAN SEMI-TRAILER DEALERSHIP CURRENT AND FUTURE TYPE ANALYSIS, 2025–2034, (USD MILLION)
FIGURE 106 TAIWAN SEMI-TRAILER DEALERSHIP CURRENT AND FUTURE END USER ANALYSIS, 2025–2034, (USD MILLION)
FIGURE 107 MALAYSIA SEMI-TRAILER DEALERSHIP CURRENT AND FUTURE TYPE ANALYSIS, 2025–2034, (USD MILLION)
FIGURE 108 MALAYSIA SEMI-TRAILER DEALERSHIP CURRENT AND FUTURE END USER ANALYSIS, 2025–2034, (USD MILLION)
FIGURE 109 REST OF SEA AND SOUTH ASIA SEMI-TRAILER DEALERSHIP CURRENT AND FUTURE TYPE ANALYSIS, 2025–2034, (USD MILLION)
FIGURE 110 REST OF SEA AND SOUTH ASIA SEMI-TRAILER DEALERSHIP CURRENT AND FUTURE END USER ANALYSIS, 2025–2034, (USD MILLION)
FIGURE 111 MIDDLE EAST AND AFRICA SEMI-TRAILER DEALERSHIP CURRENT AND FUTURE MARKET VOLUME SHARE REGIONAL ANALYSIS, 2025–2034, (USD MILLION)
FIGURE 112 GCC COUNTRIES SEMI-TRAILER DEALERSHIP CURRENT AND FUTURE TYPE ANALYSIS, 2025–2034, (USD MILLION)
FIGURE 113 GCC COUNTRIES SEMI-TRAILER DEALERSHIP CURRENT AND FUTURE END USER ANALYSIS, 2025–2034, (USD MILLION)
FIGURE 114 SAUDI ARABIA SEMI-TRAILER DEALERSHIP CURRENT AND FUTURE TYPE ANALYSIS, 2025–2034, (USD MILLION)
FIGURE 115 SAUDI ARABIA SEMI-TRAILER DEALERSHIP CURRENT AND FUTURE END USER ANALYSIS, 2025–2034, (USD MILLION)
FIGURE 116 UAE SEMI-TRAILER DEALERSHIP CURRENT AND FUTURE TYPE ANALYSIS, 2025–2034, (USD MILLION)
FIGURE 117 UAE SEMI-TRAILER DEALERSHIP CURRENT AND FUTURE END USER ANALYSIS, 2025–2034, (USD MILLION)
FIGURE 118 BAHRAIN SEMI-TRAILER DEALERSHIP CURRENT AND FUTURE TYPE ANALYSIS, 2025–2034, (USD MILLION)
FIGURE 119 BAHRAIN SEMI-TRAILER DEALERSHIP CURRENT AND FUTURE END USER ANALYSIS, 2025–2034, (USD MILLION)
FIGURE 120 KUWAIT SEMI-TRAILER DEALERSHIP CURRENT AND FUTURE TYPE ANALYSIS, 2025–2034, (USD MILLION)
FIGURE 121 KUWAIT SEMI-TRAILER DEALERSHIP CURRENT AND FUTURE END USER ANALYSIS, 2025–2034, (USD MILLION)
FIGURE 122 OMAN SEMI-TRAILER DEALERSHIP CURRENT AND FUTURE TYPE ANALYSIS, 2025–2034, (USD MILLION)
FIGURE 123 OMAN SEMI-TRAILER DEALERSHIP CURRENT AND FUTURE END USER ANALYSIS, 2025–2034, (USD MILLION)
FIGURE 124 QATAR SEMI-TRAILER DEALERSHIP CURRENT AND FUTURE TYPE ANALYSIS, 2025–2034, (USD MILLION)
FIGURE 125 QATAR SEMI-TRAILER DEALERSHIP CURRENT AND FUTURE END USER ANALYSIS, 2025–2034, (USD MILLION)
FIGURE 126 EGYPT SEMI-TRAILER DEALERSHIP CURRENT AND FUTURE TYPE ANALYSIS, 2025–2034, (USD MILLION)
FIGURE 127 EGYPT SEMI-TRAILER DEALERSHIP CURRENT AND FUTURE END USER ANALYSIS, 2025–2034, (USD MILLION)
FIGURE 128 NIGERIA SEMI-TRAILER DEALERSHIP CURRENT AND FUTURE TYPE ANALYSIS, 2025–2034, (USD MILLION)
FIGURE 129 NIGERIA SEMI-TRAILER DEALERSHIP CURRENT AND FUTURE END USER ANALYSIS, 2025–2034, (USD MILLION)
FIGURE 130 SOUTH AFRICA SEMI-TRAILER DEALERSHIP CURRENT AND FUTURE TYPE ANALYSIS, 2025–2034, (USD MILLION)
FIGURE 131 SOUTH AFRICA SEMI-TRAILER DEALERSHIP CURRENT AND FUTURE END USER ANALYSIS, 2025–2034, (USD MILLION)
FIGURE 132 ISRAEL SEMI-TRAILER DEALERSHIP CURRENT AND FUTURE TYPE ANALYSIS, 2025–2034, (USD MILLION)
FIGURE 133 ISRAEL SEMI-TRAILER DEALERSHIP CURRENT AND FUTURE END USER ANALYSIS, 2025–2034, (USD MILLION)
FIGURE 134 REST OF MEA SEMI-TRAILER DEALERSHIP CURRENT AND FUTURE TYPE ANALYSIS, 2025–2034, (USD MILLION)
FIGURE 135 REST OF MEA SEMI-TRAILER DEALERSHIP CURRENT AND FUTURE END USER ANALYSIS, 2025–2034, (USD MILLION)
FIGURE 136 U. S. MARKET SHARE ANALYSIS BY TYPE (2025)
FIGURE 137 U. S. MARKET SHARE ANALYSIS BY END USER (2025)
FIGURE 138 CANADA MARKET SHARE ANALYSIS BY TYPE (2025)
FIGURE 139 CANADA MARKET SHARE ANALYSIS BY END USER (2025)
FIGURE 140 MEXICO MARKET SHARE ANALYSIS BY TYPE (2025)
FIGURE 141 MEXICO MARKET SHARE ANALYSIS BY END USER (2025)
FIGURE 142 CHINA MARKET SHARE ANALYSIS BY TYPE (2025)
FIGURE 143 CHINA MARKET SHARE ANALYSIS BY END USER (2025)
FIGURE 144 JAPAN MARKET SHARE ANALYSIS BY TYPE (2025)
FIGURE 145 JAPAN MARKET SHARE ANALYSIS BY END USER (2025)
FIGURE 146 INDIA MARKET SHARE ANALYSIS BY TYPE (2025)
FIGURE 147 INDIA MARKET SHARE ANALYSIS BY END USER (2025)
FIGURE 148 SOUTH KOREA MARKET SHARE ANALYSIS BY TYPE (2025)
FIGURE 149 SOUTH KOREA MARKET SHARE ANALYSIS BY END USER (2025)
FIGURE 150 SAUDI ARABIA MARKET SHARE ANALYSIS BY TYPE (2025)
FIGURE 151 SAUDI ARABIA MARKET SHARE ANALYSIS BY END USER (2025)
FIGURE 152 UAE MARKET SHARE ANALYSIS BY TYPE (2025)
FIGURE 153 UAE MARKET SHARE ANALYSIS BY END USER (2025)
FIGURE 154 EGYPT MARKET SHARE ANALYSIS BY TYPE (2025)
FIGURE 155 EGYPT MARKET SHARE ANALYSIS BY END USER (2025)
FIGURE 156 NIGERIA MARKET SHARE ANALYSIS BY TYPE (2025)
FIGURE 157 NIGERIA MARKET SHARE ANALYSIS BY END USER (2025)
FIGURE 158 SOUTH AFRICA MARKET SHARE ANALYSIS BY TYPE (2025)
FIGURE 159 SOUTH AFRICA MARKET SHARE ANALYSIS BY END USER (2025)
FIGURE 160 GERMANY MARKET SHARE ANALYSIS BY TYPE (2025)
FIGURE 161 GERMANY MARKET SHARE ANALYSIS BY END USER (2025)
FIGURE 162 FRANCE MARKET SHARE ANALYSIS BY TYPE (2025)
FIGURE 163 FRANCE MARKET SHARE ANALYSIS BY END USER (2025)
FIGURE 164 UK MARKET SHARE ANALYSIS BY TYPE (2025)
FIGURE 165 UK MARKET SHARE ANALYSIS BY END USER (2025)
FIGURE 166 SPAIN MARKET SHARE ANALYSIS BY TYPE (2025)
FIGURE 167 SPAIN MARKET SHARE ANALYSIS BY END USER (2025)
FIGURE 168 ITALY MARKET SHARE ANALYSIS BY TYPE (2025)
FIGURE 169 ITALY MARKET SHARE ANALYSIS BY END USER (2025)
FIGURE 170 BRAZIL MARKET SHARE ANALYSIS BY TYPE (2025)
FIGURE 171 BRAZIL MARKET SHARE ANALYSIS BY END USER (2025)
FIGURE 172 ARGENTINA MARKET SHARE ANALYSIS BY TYPE (2025)
FIGURE 173 ARGENTINA MARKET SHARE ANALYSIS BY END USER (2025)
FIGURE 174 COLUMBIA MARKET SHARE ANALYSIS BY TYPE (2025)
FIGURE 175 COLUMBIA MARKET SHARE ANALYSIS BY END USER (2025)
FIGURE 176 GLOBAL SEMI-TRAILER DEALERSHIP CURRENT AND FUTURE MARKET KEY COUNTRY LEVEL ANALYSIS, 2025–2034, (USD MILLION)
FIGURE 177 FINANCIAL OVERVIEW:
Key Player Analysis
Penske Truck Leasing: Penske Truck Leasing holds a leadership position in the semi-trailer dealership market through scale, fleet depth, and integrated service coverage. As of 2025, Penske manages more than 430,000 vehicles and trailers globally, with a significant share tied to long-haul and dedicated contract carriage fleets. Its dealership activity centers on new and used trailer sales, full-service leasing, contract maintenance, and fleet lifecycle management for large enterprise customers across North America. Trailer-related services contribute a material portion of Penske’s transportation services revenue, which exceeded USD 10 billion in its latest fiscal year.
Strategically, Penske continues to expand digital fleet management platforms and predictive maintenance capabilities to improve asset uptime and cost transparency. The company invests heavily in technician training and service network density, operating over 3,000 service locations. Its differentiators include strong OEM relationships, disciplined asset rotation, and a customer base anchored by Fortune 500 shippers. Sustainability initiatives, including lightweight trailers and emissions-compliant equipment, support fleet replacement demand and long-term customer retention.
Rush Enterprises, Inc.: Rush Enterprises operates as a leading dealer network and challenger in the semi-trailer dealership segment, with strength in retail-oriented sales and aftermarket services. The company manages more than 150 commercial vehicle dealerships across the United States, with trailer sales, parts, and service forming a growing revenue stream alongside truck distribution. In 2025, aftermarket services account for over 60% of Rush’s gross profit, reinforcing resilience during freight cycle fluctuations.
Rush focuses on expanding used trailer programs, refurbishment services, and financing solutions for small and mid-sized fleets. Strategic investments target inventory analytics, service bay utilization, and regional dealership expansion in high-freight corridors such as Texas and the Southeast. Its competitive advantage lies in rapid inventory turnover, strong parts availability, and localized customer relationships. This model positions Rush to capture replacement demand from owner-operators and regional carriers.
Ryder System, Inc.: Ryder System acts as an integrated mobility and supply chain services provider with a strong presence in semi-trailer leasing and dealership-related services. In 2025, Ryder manages approximately 260,000 commercial vehicles and trailers, supporting logistics, transportation, and dedicated fleet customers. Trailer leasing, rental, and remarketing play a central role in Ryder’s asset-light strategy, with transportation and fleet management revenues exceeding USD 12 billion annually.
Ryder prioritizes flexible ownership models and digital fleet visibility tools to support customer cost control. The company expands its used trailer resale channels and contract maintenance offerings to extend asset life and improve residual values. Ryder’s differentiators include deep penetration among contract logistics customers, standardized fleet specifications, and strong capital discipline. Its focus on emissions-compliant equipment and electric-ready trailer configurations aligns with tightening regulatory and sustainability requirements across major freight markets.
Long-haul freight expansion continues to anchor demand for semi-trailer dealerships in 2025. Cross-border trade growth, regional manufacturing dispersion, and rising consumer goods flows increase trailer utilization across North America, Europe, and Asia Pacific. Road freight volumes are expanding at an estimated 3.0% to 4.0% annually through 2030, sustaining baseline demand for dry vans, reefers, and flatbeds. As supply chains stretch across longer distances, fleet reliability and uptime become priority investment criteria, reinforcing dealership relevance.
Fleet Renewal and Cold-Chain Logistics Expansion
Fleet renewal strengthens this demand cycle. Large logistics operators replace trailers every seven to ten years to meet safety mandates, emissions standards, and insurance requirements. Regulatory pressure around braking systems, electronic logging compatibility, and weight compliance accelerates replacement activity. Demand for specialized equipment also rises. Cold-chain logistics for food and pharmaceuticals grows at an estimated 6.0% CAGR post-2025, driving dealership sales of temperature-controlled and certified hazardous cargo units. Infrastructure investment further supports trailer purchases by improving route efficiency and asset productivity.
Restraint:
High Inventory Financing and Operational Costs
Capital intensity remains a structural constraint for dealership operators. Maintaining diversified inventory requires significant floor-plan financing, with average inventory carrying costs estimated at 7.0% to 9.0% annually in high-rate environments. Slower turnover during freight downturns extends cash conversion cycles and compresses margins, particularly for mid-sized dealerships with limited balance-sheet flexibility.
Freight Market Cyclicality and Supply Chain Disruptions
Market exposure to freight cyclicality compounds this pressure. Economic slowdowns delay fleet expansion and replacement decisions, leading to longer sales cycles and reduced showroom traffic. OEM production variability also restricts dealership planning. Component shortages and manufacturing delays disrupt delivery schedules, weakening customer confidence. Volatility in steel pricing and logistics costs further complicates inventory valuation and pricing discipline, creating short-term earnings risk.
Opportunity:
Growing Adoption of Trailer Leasing and Rental Models
Leasing and rental adoption opens a durable growth path for dealerships beyond unit sales. In 2025, leased trailers account for an estimated 28.0% of active fleet assets globally, up from 22.0% in 2021. Small and mid-sized carriers increasingly prefer operating expenditure models to manage balance-sheet exposure. Dealerships that structure leasing programs secure predictable monthly revenue and higher customer retention.
Expansion of Aftermarket Services and Certified Resale Programs
Aftermarket services add incremental upside. Maintenance, refurbishment, and certified resale programs extend trailer lifecycles and improve residual values. Service-related revenue can contribute 35.0% to 45.0% of dealership gross profit. Certified used trailer programs also broaden reach among cost-sensitive buyers while improving inventory velocity and margin stability.
Trend:
Increasing Adoption of Lightweight and Fuel-Efficient Trailers
Lightweight trailer adoption accelerates as fleets pursue fuel savings and payload efficiency. Weight reduction of 800 to 1,200 kilograms can improve fuel efficiency by up to 5.0%, influencing purchasing decisions across long-haul applications. Dealership portfolios increasingly reflect aluminum frames, composite panels, and aerodynamic enhancements.
Integration of Telematics and Digital Trailer Technologies
Digital feature integration also reshapes buying behavior. Telematics-enabled trailers support real-time tracking, load monitoring, and predictive maintenance. Adoption exceeds 40.0% among large fleets in 2025. Sustainability considerations reinforce this trend. Demand rises for recyclable materials and low-drag designs to meet emissions targets and operating cost objectives. Dealerships aligned with these specifications strengthen competitiveness in regulated markets.
Recent Developments
Dec 2024 – The CBB Group (sale advisory) and Utility Trailer Sales of Central California: TNT Sales of Oregon, LLC (semi-trailer dealership, parts, and service) changed ownership to Utility Trailer Sales of Central California, strengthening Utility’s dealer footprint in the Pacific Northwest; valued at over USD 25 million (estimated) based on comparable dealership transactions. This move tightens OEM-aligned channel control and increases parts-and-service capture across high-throughput freight corridors.
Jan 2025 – Utility Trailer Manufacturing Company and Utility Trailer of California: Utility Trailer of California acquired TNT Trailer Sales in Troutdale, Oregon and rebranded the location as Pacific Coast Utility Trailer, retaining local leadership and expanding field service coverage. The site reported 12 certified technicians and initiated expansion of its mobile repair fleet to support on-site trailer and TRU service. This acquisition expands Utility’s service density and accelerates recurring aftermarket revenue in the Portland freight market.
Mar 2025 – Utility Trailer Manufacturing Company and Cargobull North America: Utility introduced major enhancements to UTILITY TrailerConnect, adding a new UTC-BASIC offering and a retrofit program designed to connect existing trailers; the company cited a 15-minute dealership install for fleet connectivity. UTC-BASIC adds functions such as geo-location and tire monitoring, while UTC-PRO supports cold-chain needs via TRU integration, enabling visibility across dry vans, flatbeds, and reefers. This positions OEM-aligned dealerships as digital service providers and increases attachment rates for telematics, TRU service, and compliance workflows.
Apr 2025 – Cox Automotive and Great Dane dealer network: Trudell Trailer Sales (acquired by Cox Automotive in 2022) rebranded to Midwest Great Dane, extending the Great Dane identity deeper into the Midwest and aligning branding across dealer operations. The consolidation aims to standardize go-to-market execution and accelerate cross-territory account coverage; estimated: 8% parts-and-service revenue lift, 2026 from improved procurement and service process consistency. This strengthens dealer network cohesion and improves customer retention through unified service standards.
Feb 2025 – Rush Enterprises, Inc.: Rush reported that it expanded its network during 2024 by adding two Rush Truck Centers in Nebraska, plus new parts and mobile service locations in California and Texas, and added a Custom Vehicle Solutions upfitting site in Arizona. The update accompanied full-year financial disclosure, including USD 1.85 billion in quarterly revenue and USD 60.3 million in quarterly net income (Q1 2025 reporting context), reinforcing the scale and cash generation that funds continued footprint expansion. This strengthens Rush’s ability to bundle trailer-adjacent services, upfitting, and maintenance into multi-site fleet contracts.
Oct 2025 – Utility Trailer Manufacturing Company and Utility Trailer dealer network: Utility Trailer Sales Southeast Texas and Utility Trailer of Dallas combined to form Utility Trailer of Texas, Inc., creating a unified statewide platform with 11 locations and 140+ service bays and stated plans to add new stores in Fort Worth and Austin. The consolidation also tightened statewide 24/7 service coverage for TRU operations and expanded sales focus on Cargobull TRU and telematics offerings. This reshapes competitive intensity in a top U.S. freight state by concentrating service capacity and improving response-time performance for large fleets.
Frequently Asked Questions
How big is the Semi-Trailer Dealership Market?
Global Semi-Trailer Dealership Market was valued at USD 27.9 billion in 2024 and is projected to reach USD 70.4 billion by 2034, growing at a CAGR of 9.7%. Explore market trends, logistics demand, and growth opportunities.
Who are the major players in the Semi-Trailer Dealership Market?
Which segments covered the Semi-Trailer Dealership Market?
By Product Type (New Semi-Trailers, Used Semi-Trailers), By Application (Freight Transportation, Logistics Services, Construction and Heavy Haul, Specialized Transport), By End-Use (Fleet Operators, Owner-Operators, Leasing Companies)
How can this market research report help my business make strategic decisions?
Our market research reports provide actionable intelligence, including verified market size data, CAGR projections, competitive benchmarking, and segment-level opportunity analysis. These insights support strategic planning, investment decisions, product development, and market entry strategies for enterprises and startups alike.
How frequently is the data updated?
We continuously monitor industry developments and update our reports to reflect regulatory changes, technological advancements, and macroeconomic shifts. Updated editions ensure you receive the latest market intelligence.