
- Home
- Industries
 Aerospace And Defence
 Agriculture
 Automotive And Transportation
 Banking And Finance
 Business
 Chemicals And Materials
 Consumer And Retail
 Electronics And Semiconductors
 Food And Beverages
 Machinery & Equipments
 Manufacturing And Construction
 Medical Devices
 Others
 Pharmaceuticals And Healthcare
 Power And Energy
 Sports
 Technology
- Services
- News Room
- About us
- Contact Us
-
Semiochemicals Market Size, Growth Outlook & Forecast | CAGR of 13.5%
Global Semiochemicals Market Size, Share & Sustainable Agriculture Analysis By Type (Pheromones, Allelochemicals, By Source, Animal, Plant, Chemically Synthesized), By Function (Detection & Monitoring, Mass Trapping, Mating Disruption), By Mode of Application (Traps, Sprays, Dispensers, Others), By Crop Type (Orchard Crops, Vegetables, Field Crops, Others), Organic Farming Trends, Regulatory Landscape, Key Innovators & Forecast 2025–2034

Report Overview
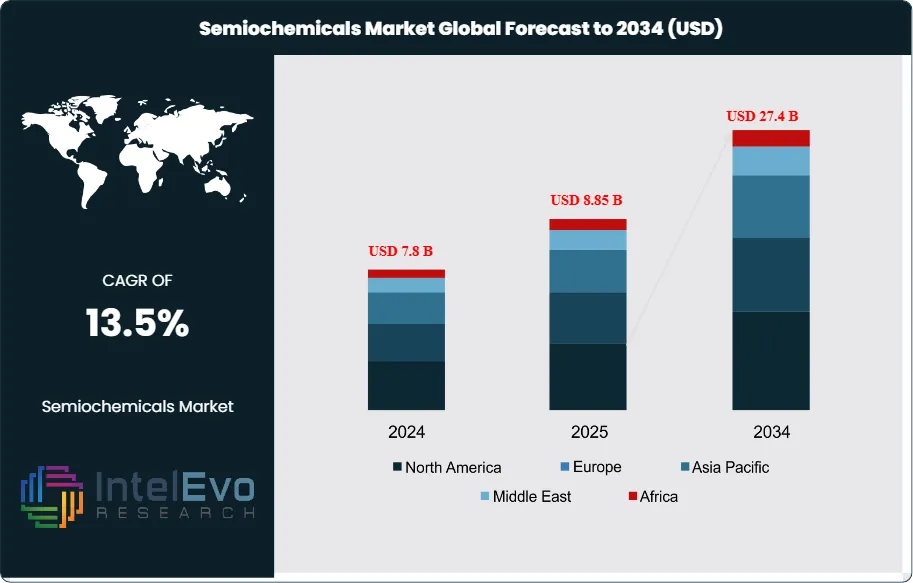
The Semiochemicals Market is estimated at USD 7.8 billion in 2024 and is projected to reach approximately USD 27.4 billion by 2034, registering a compound annual growth rate (CAGR) of about 13.5% during 2025–2034. This sustained expansion is driven by the accelerating adoption of pheromones and allelochemicals in integrated pest management (IPM), as agriculture shifts toward residue-free and environmentally sustainable crop protection solutions. Rising regulatory pressure on synthetic pesticides, combined with growing organic farming acreage and advances in controlled-release formulations, is further strengthening market momentum. In addition, expanding applications in forestry, stored-grain protection, and specialty crops are broadening the commercial scope of semiochemicals, supporting long-term demand across both developed and emerging agricultural markets.
Get More Information about this report -
Request Free Sample ReportThis sharp expansion reflects a structural shift in agricultural inputs as producers, regulators, and consumers move toward safer and more sustainable pest management solutions. Semiochemicals, which include pheromones and allelochemicals, have gained prominence as precise tools for integrated pest management. Their ability to influence insect behavior without harming non-target species positions them as a viable alternative to conventional pesticides, which face mounting scrutiny due to environmental and health risks.
The market has evolved from a niche segment into a fast-growing category within the broader agrochemicals industry. Historically, adoption was limited by high production costs and limited awareness. Over the past decade, however, advances in synthesis techniques and formulation technologies have reduced costs and improved field performance. As a result, semiochemicals are now being deployed across large-scale agricultural systems, particularly in fruit, vegetable, and plantation crops where pest pressure is high and export standards demand residue-free produce.
Several demand-side drivers are accelerating uptake. Rising consumer preference for organic and residue-free food is reshaping procurement strategies across global supply chains. Regulatory restrictions on synthetic pesticides, particularly in the European Union and North America, are creating a favorable policy environment. On the supply side, companies are investing in automated production facilities and digital monitoring systems that integrate semiochemicals with precision agriculture platforms. The use of AI-enabled traps and remote sensing to track pest populations is further enhancing the efficiency of semiochemical-based programs.
Regional dynamics are also shaping investment priorities. Europe currently leads the market, supported by stringent pesticide regulations and strong adoption of sustainable farming practices. North America follows closely, with significant research activity and commercial deployment in high-value crops. Asia-Pacific is emerging as the fastest-growing region, driven by rising food demand, government-backed integrated pest management programs, and increasing awareness among smallholder farmers. Latin America, with its large-scale fruit and plantation crop exports, represents another growth hotspot where adoption is expected to accelerate.
For investors and industry participants, the market presents a compelling growth story. High regulatory alignment, strong consumer demand for sustainable agriculture, and rapid technological integration are creating a clear pathway for semiochemicals to expand from niche applications into mainstream crop protection strategies worldwide.
, By Function (Detection & Monitoring, Mass Trapping, Mating Disruption), By Mode of Application (Traps, Sprays, Dispensers, Others), By Crop Type (Orchard Crops, Vegetables, Field Crops, Others), Organic Farming Trends, Regulatory Landscape, Key Innovators & Forecast 2025–2034")
Key Takeaways
- Market Growth: The global Semiochemicals Market is valued at USD 7.8 billion in 2024 and is projected to reach USD 27.4 billion by 2034, expanding at a CAGR of 13.5%. Growth is driven by rising demand for sustainable pest control, regulatory restrictions on synthetic pesticides, and increasing adoption of integrated pest management (IPM) practices.
- Product Type: Pheromones accounted for 78.3% of total revenue in 2023, reflecting their effectiveness in targeted pest control and broad acceptance in commercial agriculture. Allelochemicals remain a smaller segment but are gaining traction in organic farming systems.
- Application: Traps represented 50.6% of global demand in 2023, supported by their cost efficiency and compatibility with large-scale monitoring programs. Mating disruption and mass trapping are expected to expand further as residue-free crop production becomes a priority.
- Driver: Regulatory pressure is accelerating adoption. The European Union has banned or restricted over 200 synthetic pesticide active ingredients since 2010, creating strong incentives for semiochemical-based alternatives.
- Restraint: High production and formulation costs remain a barrier. Semiochemical-based solutions can be 20–30% more expensive than conventional pesticides, limiting adoption among smallholder farmers in cost-sensitive markets.
- Opportunity: Marine and aquaculture applications represent an untapped growth area. More than 200 semiochemicals have been identified in marine ecosystems, with potential to support reef conservation and sustainable fish farming.
- Trend: Product development is expanding rapidly. By 2024, over 30 semiochemical-based products were registered for conservation and agricultural use worldwide. Advances in automated monitoring systems and AI-enabled traps are further enhancing adoption.
- Regional Analysis: North America led the market with a 36.4% share in 2023, supported by strong awareness of sustainable pest control and favorable regulatory frameworks. Europe follows closely, while Asia-Pacific is projected to record the fastest CAGR through 2033, driven by rising food demand and government-backed IPM programs.
Type Analysis
As of 2025, pheromones remain the dominant category in the semiochemicals market, accounting for more than 77% of global revenue. Their widespread use in integrated pest management (IPM) programs reflects their effectiveness in controlling insect populations without harming beneficial species. Pheromone-based solutions are now deployed extensively in orchards, vineyards, and plantation crops, where residue-free production is critical for export compliance. The segment continues to expand as regulatory agencies tighten restrictions on synthetic pesticides and as growers seek targeted, environmentally safe alternatives.
Allelochemicals, while representing a smaller share, are emerging as one of the fastest-growing categories. These compounds, which regulate interactions between plants and surrounding organisms, are increasingly applied in weed suppression and pest deterrence. Research pipelines are expanding, with several companies developing allelochemical-based formulations aimed at organic farming systems. Between 2025 and 2030, this segment is projected to grow at a CAGR above 16%, supported by rising demand for natural crop protection inputs and government-backed sustainable agriculture initiatives.
The overall type-based segmentation reflects a dual trajectory: pheromones driving scale and adoption in mainstream agriculture, while allelochemicals open new opportunities in organic and specialty farming. Both categories benefit from strong R&D investment, ensuring that semiochemical-based solutions remain cost-effective and commercially viable across diverse cropping systems.
Application Analysis
Mass trapping continues to hold a leading position in 2025, representing more than 42% of global applications. Its appeal lies in its direct removal of pest populations, reducing the need for chemical sprays and lowering the risk of resistance development. Adoption is particularly strong in fruit and nut orchards, where pest pressure is high and export markets demand strict compliance with residue limits.
Mating disruption is gaining momentum, especially in vineyards and high-value horticultural crops. By interfering with insect mating cycles, this method reduces future pest generations and provides long-term control. Its species-specific nature makes it highly compatible with IPM programs. The segment is expected to expand steadily, supported by technological advances in controlled-release dispensers and automated monitoring systems.
Detection and monitoring, while smaller in revenue share, are becoming increasingly important as agriculture shifts toward data-driven decision-making. Semiochemical-based monitoring traps provide early warnings of pest outbreaks, enabling growers to apply interventions more precisely. With the rise of AI-enabled pest detection platforms, this segment is expected to record double-digit growth through 2030, reinforcing its role as a critical enabler of precision agriculture.
End-Use Analysis
The residential sector accounts for a modest but growing share of semiochemical adoption, particularly in urban pest control and home gardening. Demand is supported by consumer preference for non-toxic solutions in domestic environments.
Commercial agriculture remains the largest end-use segment, driven by large-scale adoption in orchards, vineyards, and plantation crops. Export-oriented producers are leading adopters, as semiochemicals help them meet stringent residue standards in Europe and North America. This segment is expected to maintain its dominance, supported by rising global food demand and the need for sustainable pest management practices.
Industrial applications, including forestry and stored product protection, are also expanding. Semiochemicals are increasingly used to manage pests in timber production and grain storage facilities, where chemical residues pose significant risks. With global forestry output projected to grow steadily, this segment is expected to see consistent adoption over the next decade.
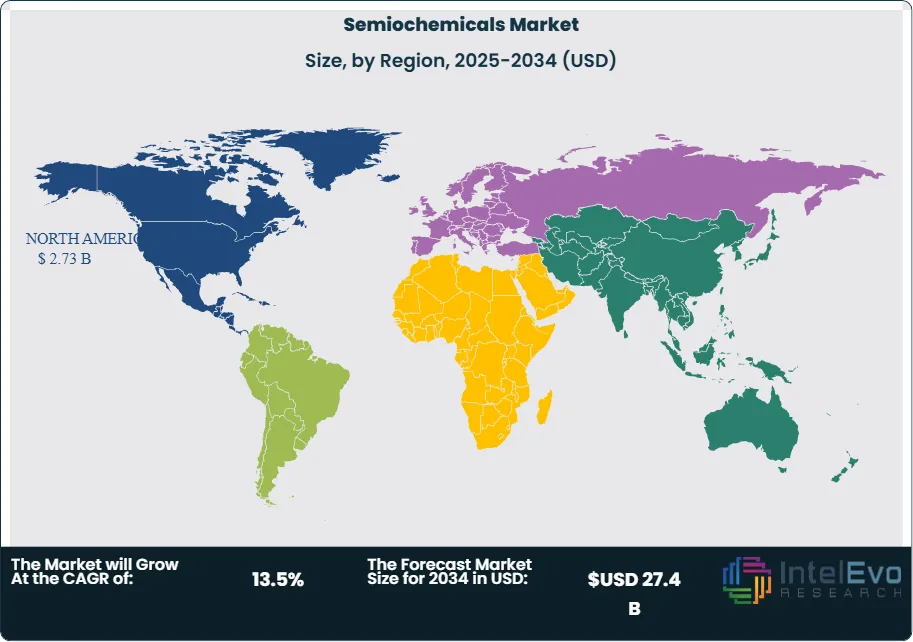
Regional Analysis
North America continues to lead the global semiochemicals market in 2025, holding more than 35% of total revenue. The United States remains the largest contributor, supported by strong regulatory frameworks, advanced R&D infrastructure, and widespread adoption of IPM practices. Canada is also expanding its use of semiochemicals, particularly in fruit and vegetable production.
Europe follows closely, with adoption driven by strict pesticide regulations and strong consumer demand for organic produce. Countries such as Spain, France, and Italy are at the forefront of pheromone-based pest management in vineyards and orchards. The European Union’s Green Deal and Farm-to-Fork strategy are expected to further accelerate adoption through 2030.
Asia Pacific is the fastest-growing regional market, projected to expand at a CAGR above 17% through 2030. Rising food demand, government-backed IPM programs, and increasing awareness among smallholder farmers are fueling adoption in China, India, and Southeast Asia. Latin America, led by Brazil and Chile, is also emerging as a key growth hub, particularly in fruit exports. Meanwhile, the Middle East and Africa are gradually adopting semiochemicals, with opportunities concentrated in horticulture and plantation crops.
Get More Information about this report -
Request Free Sample ReportMarket Key Segments
By Type
- Pheromones
- Allelochemicals
By Source
- Animal
- Plant
- Chemically Synthesized
By Function
- Detection & Monitoring
- Mass Trapping
- Mating Disruption
By Mode of Application
- Traps
- Sprays
- Dispensers
- Others
By Crop Type
- Orchard Crops
- Vegetables
- Field Crops
- Others
Regions
- North America
- Latin America
- East Asia And Pacific
- Sea And South Asia
- Eastern Europe
- Western Europe
- Middle East & Africa
| Report Attribute | Details |
| Market size (2024) | USD 7.8 B |
| Forecast Revenue (2034) | USD 27.4 B |
| CAGR (2024-2034) | 13.5% |
| Historical data | 2020-2023 |
| Base Year For Estimation | 2024 |
| Forecast Period | 2025-2034 |
| Report coverage | Revenue Forecast, Competitive Landscape, Market Dynamics, Growth Factors, Trends and Recent Developments |
| Segments covered | By Type (Pheromones, Allelochemicals, By Source, Animal, Plant, Chemically Synthesized), By Function (Detection & Monitoring, Mass Trapping, Mating Disruption), By Mode of Application (Traps, Sprays, Dispensers, Others), By Crop Type (Orchard Crops, Vegetables, Field Crops, Others) |
| Research Methodology |
|
| Regional scope |
|
| Competitive Landscape | ISCA Technologies, Inc., Agrisense BCS Ltd., Koppert Biological System, Bedoukian Research, Inc., Biobest Group NV, SEDQ Healthy Crops SL, Shin-Etsu, Russell IPM Ltd., Pacific Biocontrol Corporation, ISAGRO S.p.A., International Pheromone Systems, Suterra LLC, Troy Biosciences, Inc., Pherobank B.V., Corteva Agriscience |
| Customization Scope | Customization for segments, region/country-level will be provided. Moreover, additional customization can be done based on the requirements. |
| Pricing and Purchase Options | Avail customized purchase options to meet your exact research needs. We have three licenses to opt for: Single User License, Multi-User License (Up to 5 Users), Corporate Use License (Unlimited User and Printable PDF). |
, By Function (Detection & Monitoring, Mass Trapping, Mating Disruption), By Mode of Application (Traps, Sprays, Dispensers, Others), By Crop Type (Orchard Crops, Vegetables, Field Crops, Others), Organic Farming Trends, Regulatory Landscape, Key Innovators & Forecast 2025–2034")
, By Function (Detection & Monitoring, Mass Trapping, Mating Disruption), By Mode of Application (Traps, Sprays, Dispensers, Others), By Crop Type (Orchard Crops, Vegetables, Field Crops, Others), Organic Farming Trends, Regulatory Landscape, Key Innovators & Forecast 2025–2034")
, By Function (Detection & Monitoring, Mass Trapping, Mating Disruption), By Mode of Application (Traps, Sprays, Dispensers, Others), By Crop Type (Orchard Crops, Vegetables, Field Crops, Others), Organic Farming Trends, Regulatory Landscape, Key Innovators & Forecast 2025–2034")
Frequently Asked Questions
How big is the Semiochemicals Market?
The global semiochemicals market is projected to grow from USD 7.8 billion in 2024 to USD 27.4 billion by 2034 at a 13.5% CAGR. Growth is driven by rising adoption of pheromones in integrated pest management, stricter pesticide regulations, and expanding organic farming worldwide.
Who are the major players in the Semiochemicals Market?
ISCA Technologies, Inc., Agrisense BCS Ltd., Koppert Biological System, Bedoukian Research, Inc., Biobest Group NV, SEDQ Healthy Crops SL, Shin-Etsu, Russell IPM Ltd., Pacific Biocontrol Corporation, ISAGRO S.p.A., International Pheromone Systems, Suterra LLC, Troy Biosciences, Inc., Pherobank B.V., Corteva Agriscience
Which segments covered the Semiochemicals Market?
By Type (Pheromones, Allelochemicals, By Source, Animal, Plant, Chemically Synthesized), By Function (Detection & Monitoring, Mass Trapping, Mating Disruption), By Mode of Application (Traps, Sprays, Dispensers, Others), By Crop Type (Orchard Crops, Vegetables, Field Crops, Others)
How can this market research report help my business make strategic decisions?
Our market research reports provide actionable intelligence, including verified market size data, CAGR projections, competitive benchmarking, and segment-level opportunity analysis. These insights support strategic planning, investment decisions, product development, and market entry strategies for enterprises and startups alike.
How frequently is the data updated?
We continuously monitor industry developments and update our reports to reflect regulatory changes, technological advancements, and macroeconomic shifts. Updated editions ensure you receive the latest market intelligence.

Select Licence Type
Connect with our sales team
Why IntelEvoResearch
100%
Customer
Satisfaction
24x7+
Availability - we are always
there when you need us
200+
Fortune 50 Companies trust
IntelEvoResearch
80%
of our reports are exclusive
and first in the industry
100%
more data
and analysis
1000+
reports published
till date
