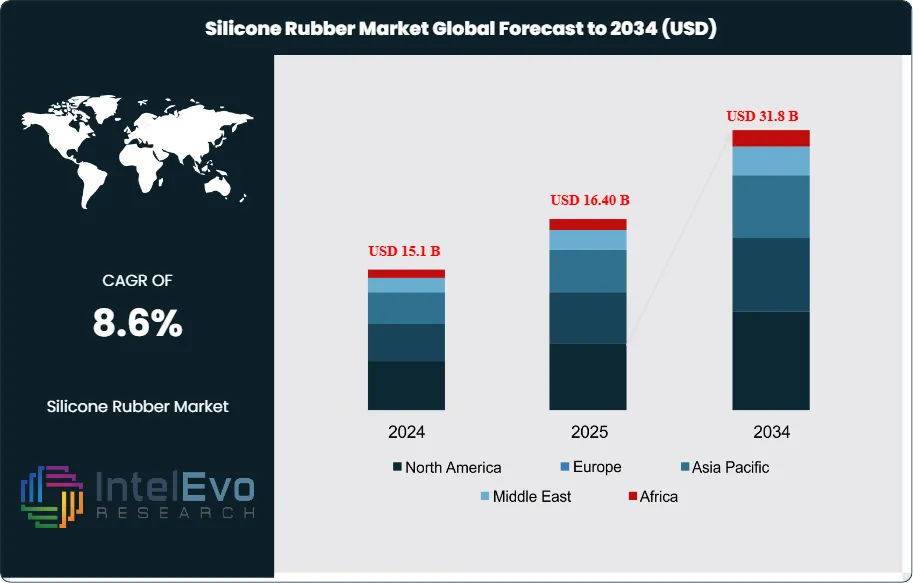
The Silicone Rubber Market is valued at USD 15.1 billion in 2024 and is projected to reach approximately USD 31.8 billion by 2034, expanding at a CAGR of around 8.6% during 2025–2034. Continuous demand from automotive, electronics, healthcare, and renewable energy applications is accelerating global adoption of high-performance silicone elastomers. As industries shift toward heat-resistant, durable, and biocompatible materials, silicone rubber is becoming a cornerstone for next-generation manufacturing. With rising EV production, medical device innovation, and industrial automation, the market is expected to witness strong momentum across all major regions through the next decade.
This steady expansion reflects silicone rubber’s differentiated performance profile—thermal stability from −50°C to >200°C, electrical insulation, UV/weathering resistance, and biocompatibility—that entrenches demand across automotive, electronics, construction, healthcare, and consumer goods. After a pandemic-era dip, volumes rebounded through 2021–2023 alongside vehicle production and electronics output; value growth outpaced volume on premiumization toward liquid silicone rubber (LSR), high-consistency rubber (HCR), and specialty grades. The decade ahead adds an incremental c. USD 9.8 billion, underpinned by three structural themes: electrification, miniaturization, and medical device penetration.
On the demand side, EV adoption accelerates usage in thermal interface materials, high-voltage cable insulation, gasketing, and sensor encapsulation; in many platforms, silicone rubber content per vehicle is rising mid-single digits annually. Electronics requires heat-resistant, low-outgassing elastomers for 5G infrastructure, wearables, and power modules. Healthcare continues to mix-shift toward implantables and drug-delivery components, where medical-grade silicone’s regulatory pedigree (USP Class VI, ISO 10993) supports above-market growth. Supply-side dynamics remain shaped by upstream siloxane/MDM availability and energy costs—particularly in China, which dominates monomer capacity—creating margin cyclicality and pricing pass-through risk. Tighter environmental regulations (e.g., VOC limits, REACH-related scrutiny of cyclic siloxanes in adjacent chemistries) and end-of-life considerations require investment in cleaner curing systems and take-back/regrind programs.
Technology is a clear catalyst. Advancements in LSR micro-molding and multi-shot over-molding shorten cycle times and reduce scrap; AI-enabled process controls and machine-vision inspection improve first-pass yield in high-precision parts. Formulation innovation is broadening addressable use cases: halogen-free flame-retardant grades for rail/building, high-thermal-conductivity compounds (~1–4 W/m·K) for power electronics, and low-volatile, low-compression-set elastomers for autonomy-ready sensors. Early additive manufacturing pathways for silicone elastomers are emerging for rapid prototypes and patient-specific medical devices.
Regionally, Asia–Pacific accounts for an estimated >45% of revenue, led by China’s integrated supply chains and expanding Southeast Asian manufacturing. North America benefits from onshoring in medical devices and grid/EV infrastructure, while Europe’s renovation wave and rail standards favor premium, compliant grades. Investment hot spots include EV battery plants, advanced packaging and power-semiconductor hubs, and medtech clusters in the United States, Germany, Ireland, China’s coastal provinces, India, and Vietnam—locations where demand density, regulatory clarity, and skilled labor tilt the risk-reward balance toward capacity additions and specialty product lines.
Key Takeaways
Market Growth: The global Silicone Rubber market was USD 15.1 billion in 2024 and is projected to reach USD 31.8 billion by 2034, reflecting a 8.6% CAGR driven by electrification (EV/charging), miniaturized electronics, and medical devices requiring biocompatible elastomers.
Product Type: HTV/HCR led in 2023 with ~48.5% share, favored for superior heat/chemical resistance in under-hood, wire & cable, and industrial sealing; LSR is the fastest-growing sub-segment (~7–8% CAGR) on the back of injection molding for precision medical and electronics parts.
Application: Automotive & Transportation accounted for ~36.7% of demand in 2023 as OEMs adopt silicone gaskets, thermal interface compounds, and sensor encapsulants; EV platforms are lifting per-vehicle silicone content and mix-shifting toward higher-value thermal and high-voltage insulation grades.
Driver: Rapid EV and power-electronics penetration is expanding use in thermal management (1–4 W/m·K compounds), HV cable insulation, and ADAS sensor sealing; alongside 5G/IoT, this is sustaining mid-single-digit volume growth with above-inflation pricing in specialty grades.
Restraint: Upstream siloxane/MDM price volatility and energy-linked costs (notably in China) can swing input prices ±20–30% YoY, compressing converter margins by 150–250 bps and complicating long-term supply contracts.
Opportunity: Medical-grade silicone (ISO 10993/USP Class VI) for implants, wound care, and drug-delivery components is poised to outpace the market (~8–9% CAGR), potentially exceeding USD 5–6 billion by 2033 as OEMs reshore sterile, LSR micro-molded production.
Trend: Process intensification—multi-shot over-molding, LSR micro-molding, and AI-enabled vision/closed-loop controls—is raising first-pass yield and shortening cycle times; additive manufacturing of silicones is emerging for patient-specific devices and rapid prototyping.
Regional Analysis: Asia–Pacific commands ~45–50% of revenue, anchored by China’s integrated monomer-to-compounding footprint and rising ASEAN manufacturing; North America benefits from EV/battery and medtech investments (CAGR ~6–7%), while Europe grows ~5–6% supported by rail/building fire-safety standards and renovation demand.
Competitive Landscape: Leading players—Dow, Wacker Chemie, Shin-Etsu, Momentive, Elkem, and KCC—are reallocating capacity toward high-purity LSR, flame-retardant, and high-thermal-conductivity lines; differentiated application support and security of MDM supply are key to share gains.
Type Analysis
In 2025, High-Temperature Vulcanized (HTV/HCR) grades remain the anchor of the silicone rubber portfolio, sustaining an estimated 47–49% revenue share on the strength of superior heat, tear, and chemical resistance. Demand concentrates in under-hood components, high-voltage wire & cable, and industrial sealing where peroxide- and platinum-cured HTV maintains performance from −50°C to >200°C. Growth is steady rather than breakaway (≈4–5% CAGR to 2033) as customers prioritize durability, flame-retardancy, and compliance for rail/building applications.
Room Temperature Vulcanized (RTV) systems—both one-part moisture-cure and two-part addition-cure—hold a solid mid-20s share, benefitting from ease of use at ambient conditions and broad compatibility with substrates. Uptake in construction glazing, façade sealing, and electronics potting tracks retrofit cycles and infrastructure programs, with low-VOC, low-migrating formulations gaining share in regulated markets.
Liquid Silicone Rubber (LSR) is the clear out-performer, expanding at ~7–9% CAGR through 2033 as precision injection-molding, multi-shot over-molding, and micro-molding enable tight-tolerance parts. LSR’s biocompatibility (ISO 10993/USP Class VI) and low compression set underpin rapid adoption in medical devices, infant care, and wearables; by 2030, LSR’s mix could approach a quarter of sector revenues as suppliers (e.g., Wacker, Shin-Etsu, Dow, Momentive, Elkem) scale high-purity lines and high-thermal-conductivity variants.
Application Analysis
Sealing & gasketing remains the largest functional use, representing roughly 35–40% of 2025 demand as OEMs specify long-life elastomers for dynamic seals, profiles, and O-rings exposed to fuels, oils, and thermal cycling. Cycle-time reductions from cold-runner and hot-deck LSR systems enhance cost competitiveness versus alternative elastomers.
Electrical insulation & encapsulation accounts for ~25–28% of consumption, lifted by power electronics, 5G infrastructure, and sensor packaging that require low-outgassing, arc-resistant materials. Potting and conformal coatings using RTV/LSR are displacing epoxies in high-reliability modules due to improved flexibility and thermal shock resistance.
Thermal management is the fastest-rising niche, with gap fillers, pads, and adhesives delivering 1–4 W/m·K conductivity for EV batteries, inverters, and data-center power supplies. This slice is poised to climb toward 10–12% of the market by 2030 (from high-single-digits in 2024), supported by increasing watt densities and stricter reliability standards.
End-Use Analysis
Automotive & Transportation leads with ~35–37% of 2025 volume; EV platforms lift per-vehicle silicone content by ~8–12% versus ICE due to battery sealing, HV insulation, and thermal interface materials. Content growth offsets cyclical builds, supporting ~6–7% value CAGR through 2033.
Electrical & Electronics represents ~22–24% share, propelled by power semiconductors, wearables, and smart-home devices that require low-volatile, high-purity elastomers. Industrial machinery holds ~12–14%, leveraging HTV’s resilience for compressors, pumps, and processing equipment.
Consumer goods (~9–11%) continue migrating to food-contact-safe LSR for bakeware and infant care; Construction (~10–12%) benefits from glazing and weatherproofing in renovation-heavy markets. Healthcare is the fastest-growing end-use (~8–9% CAGR), with implantables, wound-care, and drug-delivery devices positioning medical-grade silicone to exceed USD 5–6 billion by 2033; others remain niche but strategic in aerospace and energy.
Regional Analysis
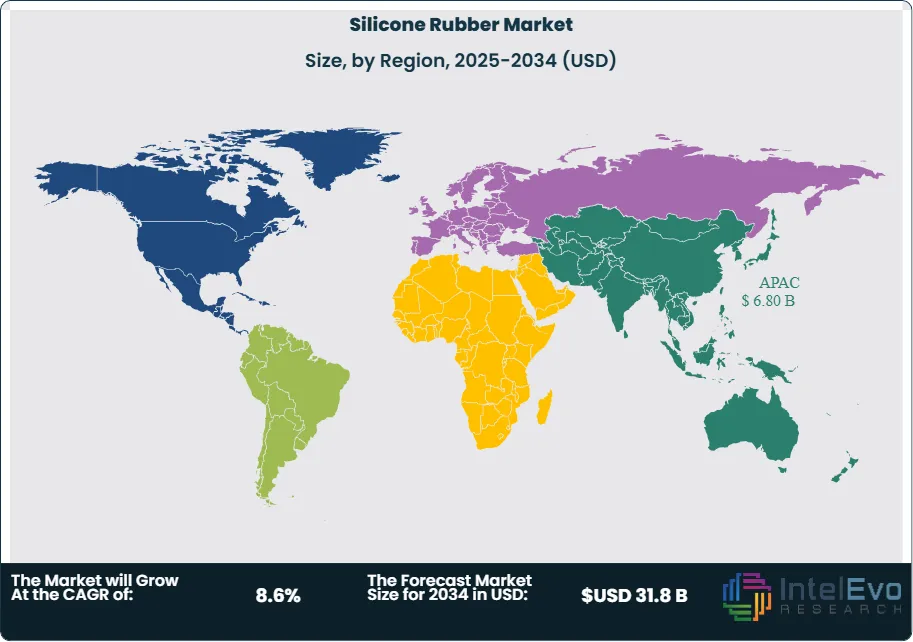
Asia Pacific remains the demand and supply fulcrum with >45% of 2025 revenues, expanding at ~6.5–7% CAGR as China sustains monomer-to-compounding integration and ASEAN/India scale automotive, electronics, and medical manufacturing. Policy-driven localization and rising mid-income consumption accelerate adoption across transportation and consumer health.
North America benefits from EV/battery and medtech capex, onshoring of precision molding, and grid modernization, supporting ~6–7% CAGR. Europe grows at ~5–6% amid higher energy costs but strong pull for premium, low-VOC, and flame-retardant grades aligned with REACH and building/rail safety standards.
Smaller in absolute terms but accelerating, Latin America and the Middle East & Africa post ~7–8% CAGR through 2033 on industrialization, infrastructure, and energy investments. Nearshoring (Mexico, Brazil) and petrochemical integration (GCC) are creating localized opportunities in wire & cable, construction sealants, and industrial components.
Customization for segments, region/country-level will be provided. Moreover, additional customization can be done based on the requirements.
Pricing and Purchase Options
Avail customized purchase options to meet your exact research needs. We have three licenses to opt for: Single User License, Multi-User License (Up to 5 Users), Corporate Use License (Unlimited User and Printable PDF).
TABLE OF CONTENTS
1. EXECUTIVE SUMMARY
1.1. MARKET SNAPSHOT
1.2. KEY FINDINGS & INSIGHTS
1.3. ANALYST RECOMMENDATIONS
1.4. FUTURE OUTLOOK
2. RESEARCH METHODOLOGY
2.1. MARKET DEFINITION & SCOPE
2.2. RESEARCH OBJECTIVES: PRIMARY & SECONDARY DATA SOURCES
2.3. DATA COLLECTION SOURCES
2.3.1. COVERAGE OF 100+ PRIMARY RESEARCH/CONSULTATION CALLS WITH INDUSTRY STAKEHOLDERS
FIGURE 17 NORTH AMERICA SILICONE RUBBER CURRENT AND FUTURE TYPE ANALYSIS, 2025–2034, (USD MILLION)
FIGURE 18 NORTH AMERICA SILICONE RUBBER CURRENT AND FUTURE END USER ANALYSIS, 2025–2034, (USD MILLION)
FIGURE 19 MARKET SHARE BY COUNTRY
FIGURE 20 LATIN AMERICA SILICONE RUBBER CURRENT AND FUTURE TYPE ANALYSIS, 2025–2034, (USD MILLION)
FIGURE 21 LATIN AMERICA SILICONE RUBBER CURRENT AND FUTURE END USER ANALYSIS, 2025–2034, (USD MILLION)
FIGURE 22 MARKET SHARE BY COUNTRY
FIGURE 23 EASTERN EUROPE SILICONE RUBBER CURRENT AND FUTURE TYPE ANALYSIS, 2025–2034, (USD MILLION)
FIGURE 24 EASTERN EUROPE SILICONE RUBBER CURRENT AND FUTURE END USER ANALYSIS, 2025–2034, (USD MILLION)
FIGURE 25 MARKET SHARE BY COUNTRY
FIGURE 26 WESTERN EUROPE SILICONE RUBBER CURRENT AND FUTURE TYPE ANALYSIS, 2025–2034, (USD MILLION)
FIGURE 27 WESTERN EUROPE SILICONE RUBBER CURRENT AND FUTURE END USER ANALYSIS, 2025–2034, (USD MILLION)
FIGURE 28 MARKET SHARE BY COUNTRY
FIGURE 29 EAST ASIA AND PACIFIC SILICONE RUBBER CURRENT AND FUTURE TYPE ANALYSIS, 2025–2034, (USD MILLION)
FIGURE 30 EAST ASIA AND PACIFIC SILICONE RUBBER CURRENT AND FUTURE END USER ANALYSIS, 2025–2034, (USD MILLION)
FIGURE 31 MARKET SHARE BY COUNTRY
FIGURE 32 SEA AND SOUTH ASIA SILICONE RUBBER CURRENT AND FUTURE TYPE ANALYSIS, 2025–2034, (USD MILLION)
FIGURE 33 SEA AND SOUTH ASIA SILICONE RUBBER CURRENT AND FUTURE END USER ANALYSIS, 2025–2034, (USD MILLION)
FIGURE 34 MARKET SHARE BY COUNTRY
FIGURE 35 MIDDLE EAST AND AFRICA SILICONE RUBBER CURRENT AND FUTURE TYPE ANALYSIS, 2025–2034, (USD MILLION)
FIGURE 36 MIDDLE EAST AND AFRICA SILICONE RUBBER CURRENT AND FUTURE END USER ANALYSIS, 2025–2034, (USD MILLION)
FIGURE 37 NORTH AMERICA SILICONE RUBBER CURRENT AND FUTURE MARKET VOLUME SHARE REGIONAL ANALYSIS, 2025–2034, (USD MILLION)
FIGURE 38 U.S. SILICONE RUBBER CURRENT AND FUTURE TYPE ANALYSIS, 2025–2034, (USD MILLION)
FIGURE 39 U.S. SILICONE RUBBER CURRENT AND FUTURE END USER ANALYSIS, 2025–2034, (USD MILLION)
FIGURE 40 CANADA SILICONE RUBBER CURRENT AND FUTURE TYPE ANALYSIS, 2025–2034, (USD MILLION)
FIGURE 41 CANADA SILICONE RUBBER CURRENT AND FUTURE END USER ANALYSIS, 2025–2034, (USD MILLION)
FIGURE 42 LATIN AMERICA SILICONE RUBBER CURRENT AND FUTURE MARKET VOLUME SHARE REGIONAL ANALYSIS, 2025–2034, (USD MILLION)
FIGURE 43 MEXICO SILICONE RUBBER CURRENT AND FUTURE TYPE ANALYSIS, 2025–2034, (USD MILLION)
FIGURE 44 MEXICO SILICONE RUBBER CURRENT AND FUTURE END USER ANALYSIS, 2025–2034, (USD MILLION)
FIGURE 45 BRAZIL SILICONE RUBBER CURRENT AND FUTURE TYPE ANALYSIS, 2025–2034, (USD MILLION)
FIGURE 46 BRAZIL SILICONE RUBBER CURRENT AND FUTURE END USER ANALYSIS, 2025–2034, (USD MILLION)
FIGURE 47 ARGENTINA SILICONE RUBBER CURRENT AND FUTURE TYPE ANALYSIS, 2025–2034, (USD MILLION)
FIGURE 48 ARGENTINA SILICONE RUBBER CURRENT AND FUTURE END USER ANALYSIS, 2025–2034, (USD MILLION)
FIGURE 49 COLUMBIA SILICONE RUBBER CURRENT AND FUTURE TYPE ANALYSIS, 2025–2034, (USD MILLION)
FIGURE 50 COLUMBIA SILICONE RUBBER CURRENT AND FUTURE END USER ANALYSIS, 2025–2034, (USD MILLION)
FIGURE 51 REST OF LATIN AMERICA SILICONE RUBBER CURRENT AND FUTURE TYPE ANALYSIS, 2025–2034, (USD MILLION)
FIGURE 52 REST OF LATIN AMERICA SILICONE RUBBER CURRENT AND FUTURE END USER ANALYSIS, 2025–2034, (USD MILLION)
FIGURE 53 EASTERN EUROPE SILICONE RUBBER CURRENT AND FUTURE MARKET VOLUME SHARE REGIONAL ANALYSIS, 2025–2034, (USD MILLION)
FIGURE 54 POLAND SILICONE RUBBER CURRENT AND FUTURE TYPE ANALYSIS, 2025–2034, (USD MILLION)
FIGURE 55 POLAND SILICONE RUBBER CURRENT AND FUTURE END USER ANALYSIS, 2025–2034, (USD MILLION)
FIGURE 56 RUSSIA SILICONE RUBBER CURRENT AND FUTURE TYPE ANALYSIS, 2025–2034, (USD MILLION)
FIGURE 57 RUSSIA SILICONE RUBBER CURRENT AND FUTURE END USER ANALYSIS, 2025–2034, (USD MILLION)
FIGURE 58 CZECH REPUBLIC SILICONE RUBBER CURRENT AND FUTURE TYPE ANALYSIS, 2025–2034, (USD MILLION)
FIGURE 59 CZECH REPUBLIC SILICONE RUBBER CURRENT AND FUTURE END USER ANALYSIS, 2025–2034, (USD MILLION)
FIGURE 60 ROMANIA SILICONE RUBBER CURRENT AND FUTURE TYPE ANALYSIS, 2025–2034, (USD MILLION)
FIGURE 61 ROMANIA SILICONE RUBBER CURRENT AND FUTURE END USER ANALYSIS, 2025–2034, (USD MILLION)
FIGURE 62 REST OF EASTERN EUROPE SILICONE RUBBER CURRENT AND FUTURE TYPE ANALYSIS, 2025–2034, (USD MILLION)
FIGURE 63 REST OF EASTERN EUROPE SILICONE RUBBER CURRENT AND FUTURE END USER ANALYSIS, 2025–2034, (USD MILLION)
FIGURE 64 WESTERN EUROPE SILICONE RUBBER CURRENT AND FUTURE MARKET VOLUME SHARE REGIONAL ANALYSIS, 2025–2034, (USD MILLION)
FIGURE 65 GERMANY SILICONE RUBBER CURRENT AND FUTURE TYPE ANALYSIS, 2025–2034, (USD MILLION)
FIGURE 66 GERMANY SILICONE RUBBER CURRENT AND FUTURE END USER ANALYSIS, 2025–2034, (USD MILLION)
FIGURE 67 FRANCE SILICONE RUBBER CURRENT AND FUTURE TYPE ANALYSIS, 2025–2034, (USD MILLION)
FIGURE 68 FRANCE SILICONE RUBBER CURRENT AND FUTURE END USER ANALYSIS, 2025–2034, (USD MILLION)
FIGURE 69 UK SILICONE RUBBER CURRENT AND FUTURE TYPE ANALYSIS, 2025–2034, (USD MILLION)
FIGURE 70 UK SILICONE RUBBER CURRENT AND FUTURE END USER ANALYSIS, 2025–2034, (USD MILLION)
FIGURE 71 SPAIN SILICONE RUBBER CURRENT AND FUTURE TYPE ANALYSIS, 2025–2034, (USD MILLION)
FIGURE 72 SPAIN SILICONE RUBBER CURRENT AND FUTURE END USER ANALYSIS, 2025–2034, (USD MILLION)
FIGURE 73 ITALY SILICONE RUBBER CURRENT AND FUTURE TYPE ANALYSIS, 2025–2034, (USD MILLION)
FIGURE 74 ITALY SILICONE RUBBER CURRENT AND FUTURE END USER ANALYSIS, 2025–2034, (USD MILLION)
FIGURE 75 REST OF WESTERN EUROPE SILICONE RUBBER CURRENT AND FUTURE TYPE ANALYSIS, 2025–2034, (USD MILLION)
FIGURE 76 REST OF WESTERN EUROPE SILICONE RUBBER CURRENT AND FUTURE END USER ANALYSIS, 2025–2034, (USD MILLION)
FIGURE 77 EAST ASIA AND PACIFIC SILICONE RUBBER CURRENT AND FUTURE MARKET VOLUME SHARE REGIONAL ANALYSIS, 2025–2034, (USD MILLION)
FIGURE 78 CHINA SILICONE RUBBER CURRENT AND FUTURE TYPE ANALYSIS, 2025–2034, (USD MILLION)
FIGURE 79 CHINA SILICONE RUBBER CURRENT AND FUTURE END USER ANALYSIS, 2025–2034, (USD MILLION)
FIGURE 80 JAPAN SILICONE RUBBER CURRENT AND FUTURE TYPE ANALYSIS, 2025–2034, (USD MILLION)
FIGURE 81 JAPAN SILICONE RUBBER CURRENT AND FUTURE END USER ANALYSIS, 2025–2034, (USD MILLION)
FIGURE 82 AUSTRALIA SILICONE RUBBER CURRENT AND FUTURE TYPE ANALYSIS, 2025–2034, (USD MILLION)
FIGURE 83 AUSTRALIA SILICONE RUBBER CURRENT AND FUTURE END USER ANALYSIS, 2025–2034, (USD MILLION)
FIGURE 84 CAMBODIA SILICONE RUBBER CURRENT AND FUTURE TYPE ANALYSIS, 2025–2034, (USD MILLION)
FIGURE 85 CAMBODIA SILICONE RUBBER CURRENT AND FUTURE END USER ANALYSIS, 2025–2034, (USD MILLION)
FIGURE 86 FIJI SILICONE RUBBER CURRENT AND FUTURE TYPE ANALYSIS, 2025–2034, (USD MILLION)
FIGURE 87 FIJI SILICONE RUBBER CURRENT AND FUTURE END USER ANALYSIS, 2025–2034, (USD MILLION)
FIGURE 88 INDONESIA SILICONE RUBBER CURRENT AND FUTURE TYPE ANALYSIS, 2025–2034, (USD MILLION)
FIGURE 89 INDONESIA SILICONE RUBBER CURRENT AND FUTURE END USER ANALYSIS, 2025–2034, (USD MILLION)
FIGURE 90 SOUTH KOREA SILICONE RUBBER CURRENT AND FUTURE TYPE ANALYSIS, 2025–2034, (USD MILLION)
FIGURE 91 SOUTH KOREA SILICONE RUBBER CURRENT AND FUTURE END USER ANALYSIS, 2025–2034, (USD MILLION)
FIGURE 92 REST OF EAST ASIA AND PACIFIC SILICONE RUBBER CURRENT AND FUTURE TYPE ANALYSIS, 2025–2034, (USD MILLION)
FIGURE 93 REST OF EAST ASIA AND PACIFIC SILICONE RUBBER CURRENT AND FUTURE END USER ANALYSIS, 2025–2034, (USD MILLION)
FIGURE 94 SEA AND SOUTH ASIA SILICONE RUBBER CURRENT AND FUTURE MARKET VOLUME SHARE REGIONAL ANALYSIS, 2025–2034, (USD MILLION)
FIGURE 95 BANGLADESH SILICONE RUBBER CURRENT AND FUTURE TYPE ANALYSIS, 2025–2034, (USD MILLION)
FIGURE 96 BANGLADESH SILICONE RUBBER CURRENT AND FUTURE END USER ANALYSIS, 2025–2034, (USD MILLION)
FIGURE 97 NEW ZEALAND SILICONE RUBBER CURRENT AND FUTURE TYPE ANALYSIS, 2025–2034, (USD MILLION)
FIGURE 98 NEW ZEALAND SILICONE RUBBER CURRENT AND FUTURE END USER ANALYSIS, 2025–2034, (USD MILLION)
FIGURE 99 INDIA SILICONE RUBBER CURRENT AND FUTURE TYPE ANALYSIS, 2025–2034, (USD MILLION)
FIGURE 100 INDIA SILICONE RUBBER CURRENT AND FUTURE END USER ANALYSIS, 2025–2034, (USD MILLION)
FIGURE 101 SINGAPORE SILICONE RUBBER CURRENT AND FUTURE TYPE ANALYSIS, 2025–2034, (USD MILLION)
FIGURE 102 SINGAPORE SILICONE RUBBER CURRENT AND FUTURE END USER ANALYSIS, 2025–2034, (USD MILLION)
FIGURE 103 THAILAND SILICONE RUBBER CURRENT AND FUTURE TYPE ANALYSIS, 2025–2034, (USD MILLION)
FIGURE 104 THAILAND SILICONE RUBBER CURRENT AND FUTURE END USER ANALYSIS, 2025–2034, (USD MILLION)
FIGURE 105 TAIWAN SILICONE RUBBER CURRENT AND FUTURE TYPE ANALYSIS, 2025–2034, (USD MILLION)
FIGURE 106 TAIWAN SILICONE RUBBER CURRENT AND FUTURE END USER ANALYSIS, 2025–2034, (USD MILLION)
FIGURE 107 MALAYSIA SILICONE RUBBER CURRENT AND FUTURE TYPE ANALYSIS, 2025–2034, (USD MILLION)
FIGURE 108 MALAYSIA SILICONE RUBBER CURRENT AND FUTURE END USER ANALYSIS, 2025–2034, (USD MILLION)
FIGURE 109 REST OF SEA AND SOUTH ASIA SILICONE RUBBER CURRENT AND FUTURE TYPE ANALYSIS, 2025–2034, (USD MILLION)
FIGURE 110 REST OF SEA AND SOUTH ASIA SILICONE RUBBER CURRENT AND FUTURE END USER ANALYSIS, 2025–2034, (USD MILLION)
FIGURE 111 MIDDLE EAST AND AFRICA SILICONE RUBBER CURRENT AND FUTURE MARKET VOLUME SHARE REGIONAL ANALYSIS, 2025–2034, (USD MILLION)
FIGURE 112 GCC COUNTRIES SILICONE RUBBER CURRENT AND FUTURE TYPE ANALYSIS, 2025–2034, (USD MILLION)
FIGURE 113 GCC COUNTRIES SILICONE RUBBER CURRENT AND FUTURE END USER ANALYSIS, 2025–2034, (USD MILLION)
FIGURE 114 SAUDI ARABIA SILICONE RUBBER CURRENT AND FUTURE TYPE ANALYSIS, 2025–2034, (USD MILLION)
FIGURE 115 SAUDI ARABIA SILICONE RUBBER CURRENT AND FUTURE END USER ANALYSIS, 2025–2034, (USD MILLION)
FIGURE 116 UAE SILICONE RUBBER CURRENT AND FUTURE TYPE ANALYSIS, 2025–2034, (USD MILLION)
FIGURE 117 UAE SILICONE RUBBER CURRENT AND FUTURE END USER ANALYSIS, 2025–2034, (USD MILLION)
FIGURE 118 BAHRAIN SILICONE RUBBER CURRENT AND FUTURE TYPE ANALYSIS, 2025–2034, (USD MILLION)
FIGURE 119 BAHRAIN SILICONE RUBBER CURRENT AND FUTURE END USER ANALYSIS, 2025–2034, (USD MILLION)
FIGURE 120 KUWAIT SILICONE RUBBER CURRENT AND FUTURE TYPE ANALYSIS, 2025–2034, (USD MILLION)
FIGURE 121 KUWAIT SILICONE RUBBER CURRENT AND FUTURE END USER ANALYSIS, 2025–2034, (USD MILLION)
FIGURE 122 OMAN SILICONE RUBBER CURRENT AND FUTURE TYPE ANALYSIS, 2025–2034, (USD MILLION)
FIGURE 123 OMAN SILICONE RUBBER CURRENT AND FUTURE END USER ANALYSIS, 2025–2034, (USD MILLION)
FIGURE 124 QATAR SILICONE RUBBER CURRENT AND FUTURE TYPE ANALYSIS, 2025–2034, (USD MILLION)
FIGURE 125 QATAR SILICONE RUBBER CURRENT AND FUTURE END USER ANALYSIS, 2025–2034, (USD MILLION)
FIGURE 126 EGYPT SILICONE RUBBER CURRENT AND FUTURE TYPE ANALYSIS, 2025–2034, (USD MILLION)
FIGURE 127 EGYPT SILICONE RUBBER CURRENT AND FUTURE END USER ANALYSIS, 2025–2034, (USD MILLION)
FIGURE 128 NIGERIA SILICONE RUBBER CURRENT AND FUTURE TYPE ANALYSIS, 2025–2034, (USD MILLION)
FIGURE 129 NIGERIA SILICONE RUBBER CURRENT AND FUTURE END USER ANALYSIS, 2025–2034, (USD MILLION)
FIGURE 130 SOUTH AFRICA SILICONE RUBBER CURRENT AND FUTURE TYPE ANALYSIS, 2025–2034, (USD MILLION)
FIGURE 131 SOUTH AFRICA SILICONE RUBBER CURRENT AND FUTURE END USER ANALYSIS, 2025–2034, (USD MILLION)
FIGURE 132 ISRAEL SILICONE RUBBER CURRENT AND FUTURE TYPE ANALYSIS, 2025–2034, (USD MILLION)
FIGURE 133 ISRAEL SILICONE RUBBER CURRENT AND FUTURE END USER ANALYSIS, 2025–2034, (USD MILLION)
FIGURE 134 REST OF MEA SILICONE RUBBER CURRENT AND FUTURE TYPE ANALYSIS, 2025–2034, (USD MILLION)
FIGURE 135 REST OF MEA SILICONE RUBBER CURRENT AND FUTURE END USER ANALYSIS, 2025–2034, (USD MILLION)
FIGURE 136 U. S. MARKET SHARE ANALYSIS BY TYPE (2024)
FIGURE 137 U. S. MARKET SHARE ANALYSIS BY END USER (2024)
FIGURE 138 CANADA MARKET SHARE ANALYSIS BY TYPE (2024)
FIGURE 139 CANADA MARKET SHARE ANALYSIS BY END USER (2024)
FIGURE 140 MEXICO MARKET SHARE ANALYSIS BY TYPE (2024)
FIGURE 141 MEXICO MARKET SHARE ANALYSIS BY END USER (2024)
FIGURE 142 CHINA MARKET SHARE ANALYSIS BY TYPE (2024)
FIGURE 143 CHINA MARKET SHARE ANALYSIS BY END USER (2024)
FIGURE 144 JAPAN MARKET SHARE ANALYSIS BY TYPE (2024)
FIGURE 145 JAPAN MARKET SHARE ANALYSIS BY END USER (2024)
FIGURE 146 INDIA MARKET SHARE ANALYSIS BY TYPE (2024)
FIGURE 147 INDIA MARKET SHARE ANALYSIS BY END USER (2024)
FIGURE 148 SOUTH KOREA MARKET SHARE ANALYSIS BY TYPE (2024)
FIGURE 149 SOUTH KOREA MARKET SHARE ANALYSIS BY END USER (2024)
FIGURE 150 SAUDI ARABIA MARKET SHARE ANALYSIS BY TYPE (2024)
FIGURE 151 SAUDI ARABIA MARKET SHARE ANALYSIS BY END USER (2024)
FIGURE 152 UAE MARKET SHARE ANALYSIS BY TYPE (2024)
FIGURE 153 UAE MARKET SHARE ANALYSIS BY END USER (2024)
FIGURE 154 EGYPT MARKET SHARE ANALYSIS BY TYPE (2024)
FIGURE 155 EGYPT MARKET SHARE ANALYSIS BY END USER (2024)
FIGURE 156 NIGERIA MARKET SHARE ANALYSIS BY TYPE (2024)
FIGURE 157 NIGERIA MARKET SHARE ANALYSIS BY END USER (2024)
FIGURE 158 SOUTH AFRICA MARKET SHARE ANALYSIS BY TYPE (2024)
FIGURE 159 SOUTH AFRICA MARKET SHARE ANALYSIS BY END USER (2024)
FIGURE 160 GERMANY MARKET SHARE ANALYSIS BY TYPE (2024)
FIGURE 161 GERMANY MARKET SHARE ANALYSIS BY END USER (2024)
FIGURE 162 FRANCE MARKET SHARE ANALYSIS BY TYPE (2024)
FIGURE 163 FRANCE MARKET SHARE ANALYSIS BY END USER (2024)
FIGURE 164 UK MARKET SHARE ANALYSIS BY TYPE (2024)
FIGURE 165 UK MARKET SHARE ANALYSIS BY END USER (2024)
FIGURE 166 SPAIN MARKET SHARE ANALYSIS BY TYPE (2024)
FIGURE 167 SPAIN MARKET SHARE ANALYSIS BY END USER (2024)
FIGURE 168 ITALY MARKET SHARE ANALYSIS BY TYPE (2024)
FIGURE 169 ITALY MARKET SHARE ANALYSIS BY END USER (2024)
FIGURE 170 BRAZIL MARKET SHARE ANALYSIS BY TYPE (2024)
FIGURE 171 BRAZIL MARKET SHARE ANALYSIS BY END USER (2024)
FIGURE 172 ARGENTINA MARKET SHARE ANALYSIS BY TYPE (2024)
FIGURE 173 ARGENTINA MARKET SHARE ANALYSIS BY END USER (2024)
FIGURE 174 COLUMBIA MARKET SHARE ANALYSIS BY TYPE (2024)
FIGURE 175 COLUMBIA MARKET SHARE ANALYSIS BY END USER (2024)
FIGURE 176 GLOBAL SILICONE RUBBER CURRENT AND FUTURE MARKET KEY COUNTRY LEVEL ANALYSIS, 2024–2034, (USD MILLION)
FIGURE 177 FINANCIAL OVERVIEW:
Key Player Analysis
Wacker Chemie AG: A clear leader in silicone elastomers, Wacker’s Silicones division generated ~€2.81 billion revenue in 2024, up ~2% year over year as the mix shifted toward higher-value specialties (e.g., LSR, HCR, sealants). The company is scaling application-led growth in e-mobility, grid, and construction, and has guided for stronger silicones volumes through 2025 on the back of new grades and better utilization. Wacker’s recent capacity actions reinforce its premium positioning: new specialty-silicones units came online in Japan (Tsukuba) and South Korea (Jincheon) in January 2025, while a new European silicones site in Karlovy Vary, Czech Republic is slated to start up by late 2025—improving regional responsiveness and security of supply for automotive and construction customers. Product innovation (e.g., POWERSIL® 1900 HCR for composite insulators) further differentiates the platform by targeting performance and processing efficiency in grid infrastructure.
Elkem ASA: Positioned as a leader/strategic reshaper, Elkem remains one of the most vertically integrated silicone suppliers globally. In 2024 the group reported NOK 33 billion operating income and improved Silicones profitability in 4Q24, even as the company reclassified the Silicones division as assets held for sale following a strategic review—signaling potential realignment of ownership and future investment focus. Operationally, Elkem has been executing multi-year debottlenecking and expansions—most notably the Xinghuo (China) build-out and upgrades across EMEA—aimed at specialty products, energy efficiency, and lower emissions. A 2024–2025 cadence of sustainability-linked initiatives (including recycled silicone ranges and strong CDP scores) positions the portfolio toward higher-margin, low-carbon demand in transportation, electronics, and construction.
Momentive Silicone (Momentive Performance Materials): Now integrated under KCC Corporation as a scale innovator, Momentive completed full acquisition by KCC in May 2024, followed by further integration steps in Korea in early 2025. The combined platform enhances upstream-to-downstream coordination, access to Asian growth markets, and balance sheet flexibility; S&P also cited lower interest expense and leverage expectations in its 2025 rating update. Momentive’s core plays span LSRs, RTVs, specialty elastomers, adhesives/sealants, and advanced electronic materials. Strategically, the firm is leaning into sustainability (renewable electricity usage, Scope 1–3 reductions) and application engineering for medical devices, EV electronics, and coatings—areas aligned with 2025+ mix upgrades across the silicone value chain. The enhanced KCC-Momentive footprint should accelerate time-to-market for medical-grade LSRs and electronic encapsulants where qualification cycles reward reliability and scale.
CHT Group: A niche player/fast follower with growing global reach, CHT posted €614–619 million sales in 2024 and reports that 84% of revenue now comes from “sustainable chemical solutions,” signaling a deliberate pivot to eco-aligned portfolios. CHT’s silicone offering spans 1- and 2-part RTVs, addition/condensation-cure systems, and emerging LSR lines for automated LIMS processing—targeting electronics, e-mobility, and construction sealing. The company is strengthening North American channel reach (e.g., distributor awards and trade-show presence) and upgrading management to support operational excellence and the sustainability roadmap. For investors, CHT’s differentiation rests on specialty formulations, pragmatic pricing, and an ESG-forward stance that is increasingly valued by OEMs in regulated end-markets.
Market Key Players
Evonik Industries AG
Wacker Chemie AG
Shin-Etsu Chemical Co. Ltd.
CHT Group
BRB International
Jiangsu Mingzhu Silicone Rubber Material Co. Ltd
Wynca Group
Elkem ASA
Hoshine Silicon Industry Co. Ltd
DyStar Singapore Pte Ltd
Dow
Kaneka Corporation
Mitsubishi Chemical Holdings Corporation
Momentive Silicone
Driver:
Rising EV & Electronics Demand Accelerates Silicone Rubber Adoption
As of 2025, demand inflection from electrified transport and power-dense electronics is materially lifting silicone rubber consumption. OEMs are specifying high-temperature vulcanized (HTV) and LSR grades for battery sealing, high-voltage cable insulation, sensor encapsulation, and thermal interface materials in EVs; silicone content per vehicle is estimated to be 8–12% higher than in ICE platforms. Coupled with expanding use in 5G infrastructure and wearables, these applications are sustaining a 6%+ market CAGR to 2033 and shifting the mix toward premium, high-purity formulations—supporting pricing power and margin resilience for integrated suppliers.
Restraint:
Margin Pressure from Raw Material Volatility and Compliance Costs
Input-cost volatility remains the principal governor on profitability. Upstream monomer (MDM/siloxane) and energy swings—concentrated in China’s supply base—have historically moved ±20–30% year over year, compressing converter margins by 150–250 bps when pricing pass-through lags by one to two quarters. Heightened environmental scrutiny (e.g., VOC limits and process emissions) adds capex/opex for cleaner curing and abatement, lengthening payback periods and raising the bar for Greenfield expansions.
Opportunity:
High-Growth Potential in Medical and Life-Sciences Applications
Medical and life-sciences applications offer outsized, defensible growth for LSR and medical-grade HTV. Biocompatible, sterilization-resistant elastomers are scaling rapidly in minimally invasive devices, drug-delivery components, wound care, and infant care; this segment is projected to expand at ~8–10% CAGR and could exceed USD 5–6 billion by 2033 as contract manufacturers onshore precision micro-molding and OEMs tighten supplier qualification. Strategic moves that pair high-purity compounding with application engineering (e.g., multi-shot over-molding, cleanroom LSR cells) can lock in multi-year supply agreements and premium ASPs.
Trend:
Advanced Manufacturing & New Formulations Reshape Market Innovation
Process intensification and digitalized manufacturing are redefining silicone rubber productivity and quality. LSR micro-molding, cold-runner/hot-deck systems, and multi-shot over-molding are cutting cycle times by 10–20% while AI-enabled vision and closed-loop controls raise first-pass yield by 3–5 points—critical for miniaturized medical and electronics parts. In parallel, formulation innovation is broadening the addressable market: halogen-free flame-retardant grades for rail/building, low-volatile elastomers for autonomy-ready sensors, and high-thermal-conductivity compounds (≈1–4 W/m·K) for EV inverters and data-center power modules, positioning leaders for mix-led growth over volume cycles.
Recent Developments
Dec 2024 – Momentive Performance Materials: Momentive expanded its European channel by appointing TER Chemicals as distributor for beauty and personal care silicones in Germany and Austria, effective March 1, 2025; the move broadens access to specialty silicone ingredients for formulators across the DACH region. Strategically, the partnership improves market coverage and speeds time-to-customer for higher-margin personal care grades.
Jan 2025 – Wacker Chemie AG: Wacker started up two specialty-silicones facilities in Tsukuba (Japan) and Jincheon (South Korea), citing investment in the “double-digit million-euro” range to meet demand from automotive and construction customers in Asia. The added capacity de-risks regional supply and positions Wacker to capture mix-led growth in premium elastomers.
Feb 2025 – Elkem ASA: Following a January strategic review, Elkem reclassified its Silicones division as “assets held for sale,” reporting improved profitability into Q4 2024 and a stronger balance sheet to support the process. The potential divestment could reshape competitive dynamics, with buyers seeking integrated access to specialty silicone platforms.
May 2025 – Shin-Etsu Chemical: Shin-Etsu introduced new silicone materials for personal-care applications designed to enhance texture and functionality, reinforcing its formulation leadership in high-value consumer segments. The launch supports portfolio premiumization and expands addressable demand beyond core industrial elastomers.
Sep 2025 – Dow: Dow unveiled DOWSIL™ EG-4175, a high-temperature silicone gel engineered for 800-V EV power electronics and high-density power systems, with resistance reported up to ~180 °C and self-healing properties to protect modules. This targeted innovation strengthens Dow’s position in e-mobility thermal management and insulation solutions.
Sep 2025 – Elkem ASA: Elkem entered an exclusive sales process with a counterparty for its Silicones division, marking a key milestone in the company’s portfolio realignment that began earlier in 2025. A successful transaction would sharpen Elkem’s focus on core silicon products and carbon solutions while potentially creating a scaled, specialty-focused silicone competitor under new ownership.