Global Smart Card Market Size, Share & Analysis By Type (Contact Smart Cards, Contactless Smart Cards, Dual Interface Smart Cards), By Application (Banking and Financial Services, Telecommunications, Healthcare, Transportation, Government and Public Sector, Retail and Loyalty Programs), By End-User Industry Regions & Key Players – Secure Authentication Trends & Forecast 2025–2034
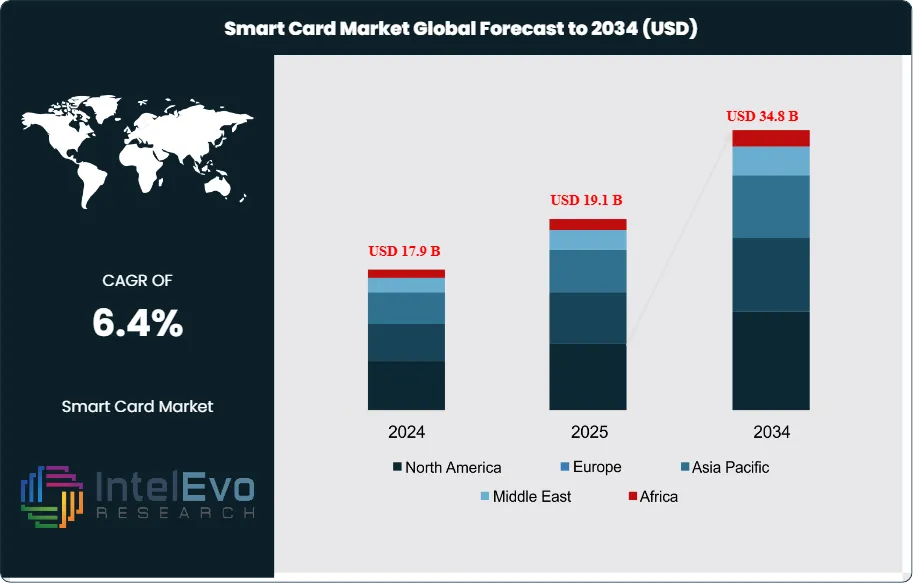
The Smart Card Market is expected to grow from USD 17.9 Billion in 2024 to approximately USD 34.8 Billion by 2034, expanding at a CAGR of around 6.4% during 2025–2034. Growing adoption of digital payments and secure authentication is driving the demand for smart card technology in banking, telecom, and public-sector services. Advancements in contactless and biometric smart cards are enhancing security and user experience across global transactions. Government-led digital identity programs and rising fintech penetration are accelerating market expansion worldwide. It driven by accelerating contactless payment adoption and enhanced security demands across digital ecosystems, offering strategic opportunities for financial institutions, governments, and technology integrators seeking secure identification solutions.
The global smart card market landscape is experiencing robust transformation as enterprises and consumers increasingly embrace digital-first payment methodologies and secure authentication frameworks. Market evolution reflects a fundamental shift from traditional magnetic stripe systems toward sophisticated embedded integrated circuit architectures, with smart card technology now serving critical functions across banking, telecommunications, healthcare, transportation, and government sectors. The market's expansion trajectory demonstrates resilience despite economic uncertainties, supported by substantial transaction volume growth exceeding 2.6 billion units globally in 2022.
Growth drivers encompass multiple convergent forces reshaping payment infrastructure and identity management paradigms. Contactless payment systems have emerged as primary catalysts, with adoption rates reaching 36% of card transactions in the United States and 50% in Canada by 2023. The COVID-19 pandemic accelerated this transition, establishing hygiene-conscious payment preferences that continue driving market momentum. Enhanced security requirements against escalating cyber threats have positioned EMV-compliant smart cards as essential protective mechanisms, while government digitalization initiatives across emerging economies create substantial deployment opportunities.
Technological innovations are fundamentally reshaping smart card capabilities through advanced integration frameworks. Biometric authentication technology has achieved commercial viability, with fingerprint and facial recognition features providing sophisticated multi-factor security layers. Artificial Intelligence integration enables adaptive threat detection and predictive maintenance capabilities, enhancing operational reliability while reducing system downtime. Blockchain technology integration represents a paradigmatic advancement, enabling decentralized identity management and secure transaction authentication that addresses contemporary data sovereignty concerns.
Regional market dynamics reveal distinct investment hotspots with varying adoption trajectories. Asia-Pacific maintains market leadership through concentrated manufacturing presence and favorable regulatory environments, particularly in China and India where smart card penetration in transportation sectors is projected to reach 78% by 2025. European markets demonstrate steady growth driven by eIDAS-2.0 wallet adoption initiatives and comprehensive e-governance programs, while North America exhibits accelerating contactless migration supported by robust financial infrastructure investments. Emerging markets in Latin America and Africa present significant expansion opportunities through mobile payment integration and smart city infrastructure development initiatives.
Key Takeaways
Market Growth: The Smart Card Market is valued at USD 17.9 Billion in 2024 and projected to reach USD 34.8 Billion by 2034, registering a robust CAGR of 6.4% during the forecast period, primarily driven by accelerating contactless payment adoption and enhanced security requirements across digital payment ecosystems.
Interface Type: Contactless smart cards dominate the market with 54% share in 2024, while dual-interface cards are experiencing rapid growth at 8.7% CAGR as issuers prioritize backward compatibility with legacy contact terminals without compromising tap-to-pay functionality.
End-Use Application: The telecommunications sector maintains market leadership with over 41% share, driven by extensive SIM card demand from escalating global mobile phone users, while BFSI segment accounts for 32.5% revenue share through EMV-compliant card adoption and multi-factor authentication systems.
Driver: Rising contactless payment adoption serves as the primary growth catalyst, with contactless transactions reaching 36% of card payments in the United States and 50% in Canada by 2023, accelerated by COVID-19 pandemic hygiene concerns and enhanced NFC/RFID security protocols.
Restraint: High implementation costs and complex infrastructure requirements pose significant barriers, particularly affecting small businesses where 60% of European SMEs cite cost as the primary deterrent, while cybersecurity vulnerabilities and data privacy concerns create additional adoption hesitancy.
Opportunity: Post-quantum cryptography integration represents a transformative growth opportunity as current public-key cryptography faces quantum computing vulnerabilities, with hybrid smart cards supporting both traditional and PQC algorithms facilitating smooth transition for finance, healthcare, and government sectors.
Trend: Biometric authentication integration is revolutionizing smart card capabilities, with biometric-enabled cards expected to reach 20 million users by 2024 and the biometric card market growing at 80.1% CAGR, driven by fingerprint sensors, AI-powered fraud detection, and enhanced multi-factor security layers.
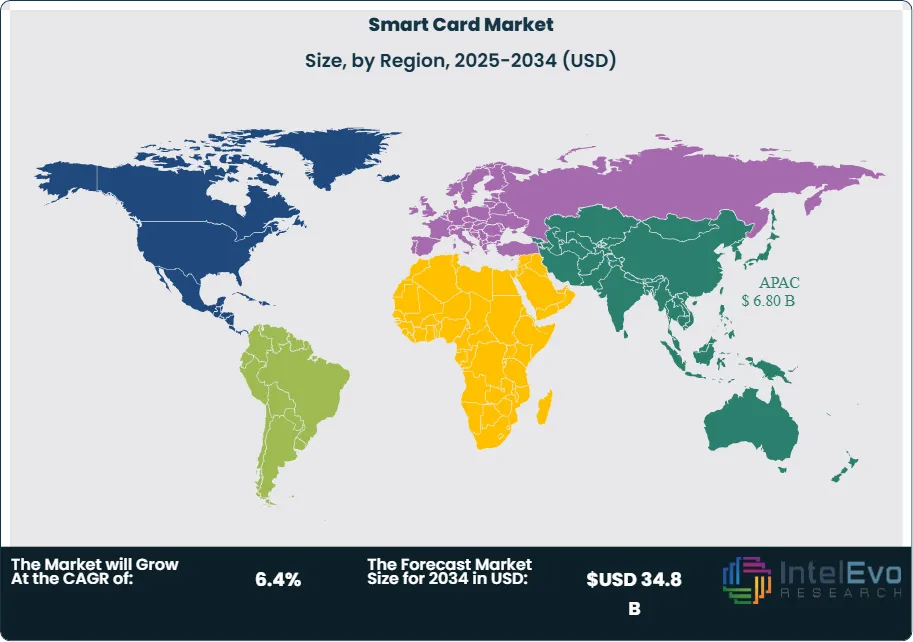
Regional Analysis: Asia-Pacific dominates with 38% market share in 2023 through concentrated manufacturing presence and favorable regulatory environments, while North America holds 25% share driven by advanced financial infrastructure and government standardization initiatives, with Europe maintaining steady growth through EMV standards and e-governance programs.
Type Analysis
The smart card market demonstrates distinct segmentation patterns across interface technologies, with dual-interface solutions emerging as the fastest-growing category in 2025. Contactless smart cards maintain their leadership position, capturing 54% of global market share through widespread adoption in retail payment systems, public transportation networks, and access control applications. These cards leverage Near Field Communication (NFC) and Radio Frequency Identification (RFID) protocols to facilitate instantaneous data transmission, eliminating physical contact requirements while delivering enhanced transaction speeds and hygiene benefits that became particularly valued during the post-pandemic era.
Dual-interface smart cards are experiencing exceptional market momentum with a 15.8% compound annual growth rate, driven by enterprise demand for backward compatibility solutions. These hybrid systems integrate both contact and contactless functionalities within a single card architecture, enabling seamless interoperability across legacy terminal infrastructure while supporting modern tap-to-pay capabilities. Financial institutions and government agencies increasingly prefer dual-interface configurations for their versatility in multi-application deployments, from secure facility access to integrated payment processing systems.
Contact-based smart cards, while representing a smaller market segment, retain strategic importance in high-security environments where physical interface requirements provide additional protection against relay attacks and unauthorized access attempts. These cards remain prevalent in government identification programs, defense applications, and enterprise security systems where controlled access protocols and enhanced authentication measures are mandatory operational requirements.
Application Analysis
The telecommunications sector maintains its dominant position with 41% market share, supported by the universal deployment of Subscriber Identity Module (SIM) cards across global mobile communication networks. This dominance reflects the essential role of smart cards in subscriber authentication, network connectivity, and secure data storage for billions of mobile device users worldwide. The sector's growth trajectory is further accelerated by 5G network expansion, embedded SIM (eSIM) technology adoption, and increasing integration of smart cards with Internet of Things (IoT) devices requiring secure connectivity solutions.
Banking and Financial Services represents the second-largest application segment, accounting for 32.5% of market revenue through extensive EMV (Europay, Mastercard, and Visa) chip card deployment and contactless payment system adoption. Financial institutions are driving demand through enhanced security mandates, fraud reduction initiatives, and consumer preference shifts toward contactless transaction methods. The segment benefits from regulatory compliance requirements, particularly EMV migration mandates and PCI-DSS (Payment Card Industry Data Security Standard) implementation across global payment networks.
Healthcare applications are experiencing rapid expansion as medical institutions implement smart cards for patient identification, electronic health record access, and secure billing transactions. Smart card integration in healthcare environments addresses critical data privacy requirements while enabling efficient patient authentication, prescription management, and insurance verification processes. Government and public sector deployments continue growing through national identification programs, e-passport initiatives, and social benefit distribution systems that leverage smart card technology for secure citizen identity verification.
Regional Analysis
Asia-Pacific commands the largest market share at 38% in 2025, driven by concentrated manufacturing capabilities and favorable government digitalization policies across major economies including China, India, and Japan. China leads regional growth through extensive smart city initiatives, digital yuan central bank digital currency (CBDC) implementations, and consolidated banking sector smart card adoption programs. The country's strategic focus on contactless payment infrastructure and biometric authentication systems positions it as a global innovation hub for advanced smart card technologies.
India contributes significantly to regional expansion through large-scale government programs including the Aadhaar biometric identification system and Digital India initiatives that mandate smart card deployment across public services. The nation's rapidly growing mobile user base, estimated at over 1.2 billion subscribers, creates substantial demand for telecommunications-based smart cards while expanding digital payment ecosystems drive financial sector adoption.
North America maintains a 25% market share, supported by mature financial infrastructure and comprehensive government standardization initiatives. The region benefits from established EMV migration programs, advanced point-of-sale terminal deployments, and robust regulatory frameworks that promote secure payment technologies. European markets demonstrate steady growth through stringent data protection regulations, eIDAS-2.0 digital wallet adoption, and comprehensive e-governance programs that integrate smart card authentication across public and private sector applications.
By Type (Contact Smart Cards, Contactless Smart Cards, Dual Interface Smart Cards), By Application (Banking and Financial Services, Telecommunications, Healthcare, Transportation, Government and Public Sector, Retail and Loyalty Programs, Other Applications)
Research Methodology
Primary Research- 100 Interviews of Stakeholders
Secondary Research
Desk Research
Regional scope
North America (United States, Canada, Mexico)
Latin America (Brazil, Argentina, Columbia)
East Asia And Pacific (China, Japan, South Korea, Australia, Cambodia, Fiji, Indonesia)
Sea And South Asia (India, Singapore, Thailand, Taiwan, Malaysia)
Eastern Europe (Poland, Russia, Czech Republic, Romania)
Western Europe (Germany, U.K., France, Spain, Itlay)
Middle East & Africa (GCC Countries, Egypt, Nigeria, South Africa, Israel)
Customization for segments, region/country-level will be provided. Moreover, additional customization can be done based on the requirements.
Pricing and Purchase Options
Avail customized purchase options to meet your exact research needs. We have three licenses to opt for: Single User License, Multi-User License (Up to 5 Users), Corporate Use License (Unlimited User and Printable PDF).
TABLE OF CONTENTS
1. EXECUTIVE SUMMARY
1.1. MARKET SNAPSHOT
1.2. KEY FINDINGS & INSIGHTS
1.3. ANALYST RECOMMENDATIONS
1.4. FUTURE OUTLOOK
2. RESEARCH METHODOLOGY
2.1. MARKET DEFINITION & SCOPE
2.2. RESEARCH OBJECTIVES: PRIMARY & SECONDARY DATA SOURCES
2.3. DATA COLLECTION SOURCES
2.3.1. COVERAGE OF 100+ PRIMARY RESEARCH/CONSULTATION CALLS WITH INDUSTRY STAKEHOLDERS
FIGURE 17 NORTH AMERICA SMART CARD CURRENT AND FUTURE TYPE ANALYSIS, 2025–2034, (USD MILLION)
FIGURE 18 NORTH AMERICA SMART CARD CURRENT AND FUTURE END USER ANALYSIS, 2025–2034, (USD MILLION)
FIGURE 19 MARKET SHARE BY COUNTRY
FIGURE 20 LATIN AMERICA SMART CARD CURRENT AND FUTURE TYPE ANALYSIS, 2025–2034, (USD MILLION)
FIGURE 21 LATIN AMERICA SMART CARD CURRENT AND FUTURE END USER ANALYSIS, 2025–2034, (USD MILLION)
FIGURE 22 MARKET SHARE BY COUNTRY
FIGURE 23 EASTERN EUROPE SMART CARD CURRENT AND FUTURE TYPE ANALYSIS, 2025–2034, (USD MILLION)
FIGURE 24 EASTERN EUROPE SMART CARD CURRENT AND FUTURE END USER ANALYSIS, 2025–2034, (USD MILLION)
FIGURE 25 MARKET SHARE BY COUNTRY
FIGURE 26 WESTERN EUROPE SMART CARD CURRENT AND FUTURE TYPE ANALYSIS, 2025–2034, (USD MILLION)
FIGURE 27 WESTERN EUROPE SMART CARD CURRENT AND FUTURE END USER ANALYSIS, 2025–2034, (USD MILLION)
FIGURE 28 MARKET SHARE BY COUNTRY
FIGURE 29 EAST ASIA AND PACIFIC SMART CARD CURRENT AND FUTURE TYPE ANALYSIS, 2025–2034, (USD MILLION)
FIGURE 30 EAST ASIA AND PACIFIC SMART CARD CURRENT AND FUTURE END USER ANALYSIS, 2025–2034, (USD MILLION)
FIGURE 31 MARKET SHARE BY COUNTRY
FIGURE 32 SEA AND SOUTH ASIA SMART CARD CURRENT AND FUTURE TYPE ANALYSIS, 2025–2034, (USD MILLION)
FIGURE 33 SEA AND SOUTH ASIA SMART CARD CURRENT AND FUTURE END USER ANALYSIS, 2025–2034, (USD MILLION)
FIGURE 34 MARKET SHARE BY COUNTRY
FIGURE 35 MIDDLE EAST AND AFRICA SMART CARD CURRENT AND FUTURE TYPE ANALYSIS, 2025–2034, (USD MILLION)
FIGURE 36 MIDDLE EAST AND AFRICA SMART CARD CURRENT AND FUTURE END USER ANALYSIS, 2025–2034, (USD MILLION)
FIGURE 37 NORTH AMERICA SMART CARD CURRENT AND FUTURE MARKET VOLUME SHARE REGIONAL ANALYSIS, 2025–2034, (USD MILLION)
FIGURE 38 U.S. SMART CARD CURRENT AND FUTURE TYPE ANALYSIS, 2025–2034, (USD MILLION)
FIGURE 39 U.S. SMART CARD CURRENT AND FUTURE END USER ANALYSIS, 2025–2034, (USD MILLION)
FIGURE 40 CANADA SMART CARD CURRENT AND FUTURE TYPE ANALYSIS, 2025–2034, (USD MILLION)
FIGURE 41 CANADA SMART CARD CURRENT AND FUTURE END USER ANALYSIS, 2025–2034, (USD MILLION)
FIGURE 42 LATIN AMERICA SMART CARD CURRENT AND FUTURE MARKET VOLUME SHARE REGIONAL ANALYSIS, 2025–2034, (USD MILLION)
FIGURE 43 MEXICO SMART CARD CURRENT AND FUTURE TYPE ANALYSIS, 2025–2034, (USD MILLION)
FIGURE 44 MEXICO SMART CARD CURRENT AND FUTURE END USER ANALYSIS, 2025–2034, (USD MILLION)
FIGURE 45 BRAZIL SMART CARD CURRENT AND FUTURE TYPE ANALYSIS, 2025–2034, (USD MILLION)
FIGURE 46 BRAZIL SMART CARD CURRENT AND FUTURE END USER ANALYSIS, 2025–2034, (USD MILLION)
FIGURE 47 ARGENTINA SMART CARD CURRENT AND FUTURE TYPE ANALYSIS, 2025–2034, (USD MILLION)
FIGURE 48 ARGENTINA SMART CARD CURRENT AND FUTURE END USER ANALYSIS, 2025–2034, (USD MILLION)
FIGURE 49 COLUMBIA SMART CARD CURRENT AND FUTURE TYPE ANALYSIS, 2025–2034, (USD MILLION)
FIGURE 50 COLUMBIA SMART CARD CURRENT AND FUTURE END USER ANALYSIS, 2025–2034, (USD MILLION)
FIGURE 51 REST OF LATIN AMERICA SMART CARD CURRENT AND FUTURE TYPE ANALYSIS, 2025–2034, (USD MILLION)
FIGURE 52 REST OF LATIN AMERICA SMART CARD CURRENT AND FUTURE END USER ANALYSIS, 2025–2034, (USD MILLION)
FIGURE 53 EASTERN EUROPE SMART CARD CURRENT AND FUTURE MARKET VOLUME SHARE REGIONAL ANALYSIS, 2025–2034, (USD MILLION)
FIGURE 54 POLAND SMART CARD CURRENT AND FUTURE TYPE ANALYSIS, 2025–2034, (USD MILLION)
FIGURE 55 POLAND SMART CARD CURRENT AND FUTURE END USER ANALYSIS, 2025–2034, (USD MILLION)
FIGURE 56 RUSSIA SMART CARD CURRENT AND FUTURE TYPE ANALYSIS, 2025–2034, (USD MILLION)
FIGURE 57 RUSSIA SMART CARD CURRENT AND FUTURE END USER ANALYSIS, 2025–2034, (USD MILLION)
FIGURE 58 CZECH REPUBLIC SMART CARD CURRENT AND FUTURE TYPE ANALYSIS, 2025–2034, (USD MILLION)
FIGURE 59 CZECH REPUBLIC SMART CARD CURRENT AND FUTURE END USER ANALYSIS, 2025–2034, (USD MILLION)
FIGURE 60 ROMANIA SMART CARD CURRENT AND FUTURE TYPE ANALYSIS, 2025–2034, (USD MILLION)
FIGURE 61 ROMANIA SMART CARD CURRENT AND FUTURE END USER ANALYSIS, 2025–2034, (USD MILLION)
FIGURE 62 REST OF EASTERN EUROPE SMART CARD CURRENT AND FUTURE TYPE ANALYSIS, 2025–2034, (USD MILLION)
FIGURE 63 REST OF EASTERN EUROPE SMART CARD CURRENT AND FUTURE END USER ANALYSIS, 2025–2034, (USD MILLION)
FIGURE 64 WESTERN EUROPE SMART CARD CURRENT AND FUTURE MARKET VOLUME SHARE REGIONAL ANALYSIS, 2025–2034, (USD MILLION)
FIGURE 65 GERMANY SMART CARD CURRENT AND FUTURE TYPE ANALYSIS, 2025–2034, (USD MILLION)
FIGURE 66 GERMANY SMART CARD CURRENT AND FUTURE END USER ANALYSIS, 2025–2034, (USD MILLION)
FIGURE 67 FRANCE SMART CARD CURRENT AND FUTURE TYPE ANALYSIS, 2025–2034, (USD MILLION)
FIGURE 68 FRANCE SMART CARD CURRENT AND FUTURE END USER ANALYSIS, 2025–2034, (USD MILLION)
FIGURE 69 UK SMART CARD CURRENT AND FUTURE TYPE ANALYSIS, 2025–2034, (USD MILLION)
FIGURE 70 UK SMART CARD CURRENT AND FUTURE END USER ANALYSIS, 2025–2034, (USD MILLION)
FIGURE 71 SPAIN SMART CARD CURRENT AND FUTURE TYPE ANALYSIS, 2025–2034, (USD MILLION)
FIGURE 72 SPAIN SMART CARD CURRENT AND FUTURE END USER ANALYSIS, 2025–2034, (USD MILLION)
FIGURE 73 ITALY SMART CARD CURRENT AND FUTURE TYPE ANALYSIS, 2025–2034, (USD MILLION)
FIGURE 74 ITALY SMART CARD CURRENT AND FUTURE END USER ANALYSIS, 2025–2034, (USD MILLION)
FIGURE 75 REST OF WESTERN EUROPE SMART CARD CURRENT AND FUTURE TYPE ANALYSIS, 2025–2034, (USD MILLION)
FIGURE 76 REST OF WESTERN EUROPE SMART CARD CURRENT AND FUTURE END USER ANALYSIS, 2025–2034, (USD MILLION)
FIGURE 77 EAST ASIA AND PACIFIC SMART CARD CURRENT AND FUTURE MARKET VOLUME SHARE REGIONAL ANALYSIS, 2025–2034, (USD MILLION)
FIGURE 78 CHINA SMART CARD CURRENT AND FUTURE TYPE ANALYSIS, 2025–2034, (USD MILLION)
FIGURE 79 CHINA SMART CARD CURRENT AND FUTURE END USER ANALYSIS, 2025–2034, (USD MILLION)
FIGURE 80 JAPAN SMART CARD CURRENT AND FUTURE TYPE ANALYSIS, 2025–2034, (USD MILLION)
FIGURE 81 JAPAN SMART CARD CURRENT AND FUTURE END USER ANALYSIS, 2025–2034, (USD MILLION)
FIGURE 82 AUSTRALIA SMART CARD CURRENT AND FUTURE TYPE ANALYSIS, 2025–2034, (USD MILLION)
FIGURE 83 AUSTRALIA SMART CARD CURRENT AND FUTURE END USER ANALYSIS, 2025–2034, (USD MILLION)
FIGURE 84 CAMBODIA SMART CARD CURRENT AND FUTURE TYPE ANALYSIS, 2025–2034, (USD MILLION)
FIGURE 85 CAMBODIA SMART CARD CURRENT AND FUTURE END USER ANALYSIS, 2025–2034, (USD MILLION)
FIGURE 86 FIJI SMART CARD CURRENT AND FUTURE TYPE ANALYSIS, 2025–2034, (USD MILLION)
FIGURE 87 FIJI SMART CARD CURRENT AND FUTURE END USER ANALYSIS, 2025–2034, (USD MILLION)
FIGURE 88 INDONESIA SMART CARD CURRENT AND FUTURE TYPE ANALYSIS, 2025–2034, (USD MILLION)
FIGURE 89 INDONESIA SMART CARD CURRENT AND FUTURE END USER ANALYSIS, 2025–2034, (USD MILLION)
FIGURE 90 SOUTH KOREA SMART CARD CURRENT AND FUTURE TYPE ANALYSIS, 2025–2034, (USD MILLION)
FIGURE 91 SOUTH KOREA SMART CARD CURRENT AND FUTURE END USER ANALYSIS, 2025–2034, (USD MILLION)
FIGURE 92 REST OF EAST ASIA AND PACIFIC SMART CARD CURRENT AND FUTURE TYPE ANALYSIS, 2025–2034, (USD MILLION)
FIGURE 93 REST OF EAST ASIA AND PACIFIC SMART CARD CURRENT AND FUTURE END USER ANALYSIS, 2025–2034, (USD MILLION)
FIGURE 94 SEA AND SOUTH ASIA SMART CARD CURRENT AND FUTURE MARKET VOLUME SHARE REGIONAL ANALYSIS, 2025–2034, (USD MILLION)
FIGURE 95 BANGLADESH SMART CARD CURRENT AND FUTURE TYPE ANALYSIS, 2025–2034, (USD MILLION)
FIGURE 96 BANGLADESH SMART CARD CURRENT AND FUTURE END USER ANALYSIS, 2025–2034, (USD MILLION)
FIGURE 97 NEW ZEALAND SMART CARD CURRENT AND FUTURE TYPE ANALYSIS, 2025–2034, (USD MILLION)
FIGURE 98 NEW ZEALAND SMART CARD CURRENT AND FUTURE END USER ANALYSIS, 2025–2034, (USD MILLION)
FIGURE 99 INDIA SMART CARD CURRENT AND FUTURE TYPE ANALYSIS, 2025–2034, (USD MILLION)
FIGURE 100 INDIA SMART CARD CURRENT AND FUTURE END USER ANALYSIS, 2025–2034, (USD MILLION)
FIGURE 101 SINGAPORE SMART CARD CURRENT AND FUTURE TYPE ANALYSIS, 2025–2034, (USD MILLION)
FIGURE 102 SINGAPORE SMART CARD CURRENT AND FUTURE END USER ANALYSIS, 2025–2034, (USD MILLION)
FIGURE 103 THAILAND SMART CARD CURRENT AND FUTURE TYPE ANALYSIS, 2025–2034, (USD MILLION)
FIGURE 104 THAILAND SMART CARD CURRENT AND FUTURE END USER ANALYSIS, 2025–2034, (USD MILLION)
FIGURE 105 TAIWAN SMART CARD CURRENT AND FUTURE TYPE ANALYSIS, 2025–2034, (USD MILLION)
FIGURE 106 TAIWAN SMART CARD CURRENT AND FUTURE END USER ANALYSIS, 2025–2034, (USD MILLION)
FIGURE 107 MALAYSIA SMART CARD CURRENT AND FUTURE TYPE ANALYSIS, 2025–2034, (USD MILLION)
FIGURE 108 MALAYSIA SMART CARD CURRENT AND FUTURE END USER ANALYSIS, 2025–2034, (USD MILLION)
FIGURE 109 REST OF SEA AND SOUTH ASIA SMART CARD CURRENT AND FUTURE TYPE ANALYSIS, 2025–2034, (USD MILLION)
FIGURE 110 REST OF SEA AND SOUTH ASIA SMART CARD CURRENT AND FUTURE END USER ANALYSIS, 2025–2034, (USD MILLION)
FIGURE 111 MIDDLE EAST AND AFRICA SMART CARD CURRENT AND FUTURE MARKET VOLUME SHARE REGIONAL ANALYSIS, 2025–2034, (USD MILLION)
FIGURE 112 GCC COUNTRIES SMART CARD CURRENT AND FUTURE TYPE ANALYSIS, 2025–2034, (USD MILLION)
FIGURE 113 GCC COUNTRIES SMART CARD CURRENT AND FUTURE END USER ANALYSIS, 2025–2034, (USD MILLION)
FIGURE 114 SAUDI ARABIA SMART CARD CURRENT AND FUTURE TYPE ANALYSIS, 2025–2034, (USD MILLION)
FIGURE 115 SAUDI ARABIA SMART CARD CURRENT AND FUTURE END USER ANALYSIS, 2025–2034, (USD MILLION)
FIGURE 116 UAE SMART CARD CURRENT AND FUTURE TYPE ANALYSIS, 2025–2034, (USD MILLION)
FIGURE 117 UAE SMART CARD CURRENT AND FUTURE END USER ANALYSIS, 2025–2034, (USD MILLION)
FIGURE 118 BAHRAIN SMART CARD CURRENT AND FUTURE TYPE ANALYSIS, 2025–2034, (USD MILLION)
FIGURE 119 BAHRAIN SMART CARD CURRENT AND FUTURE END USER ANALYSIS, 2025–2034, (USD MILLION)
FIGURE 120 KUWAIT SMART CARD CURRENT AND FUTURE TYPE ANALYSIS, 2025–2034, (USD MILLION)
FIGURE 121 KUWAIT SMART CARD CURRENT AND FUTURE END USER ANALYSIS, 2025–2034, (USD MILLION)
FIGURE 122 OMAN SMART CARD CURRENT AND FUTURE TYPE ANALYSIS, 2025–2034, (USD MILLION)
FIGURE 123 OMAN SMART CARD CURRENT AND FUTURE END USER ANALYSIS, 2025–2034, (USD MILLION)
FIGURE 124 QATAR SMART CARD CURRENT AND FUTURE TYPE ANALYSIS, 2025–2034, (USD MILLION)
FIGURE 125 QATAR SMART CARD CURRENT AND FUTURE END USER ANALYSIS, 2025–2034, (USD MILLION)
FIGURE 126 EGYPT SMART CARD CURRENT AND FUTURE TYPE ANALYSIS, 2025–2034, (USD MILLION)
FIGURE 127 EGYPT SMART CARD CURRENT AND FUTURE END USER ANALYSIS, 2025–2034, (USD MILLION)
FIGURE 128 NIGERIA SMART CARD CURRENT AND FUTURE TYPE ANALYSIS, 2025–2034, (USD MILLION)
FIGURE 129 NIGERIA SMART CARD CURRENT AND FUTURE END USER ANALYSIS, 2025–2034, (USD MILLION)
FIGURE 130 SOUTH AFRICA SMART CARD CURRENT AND FUTURE TYPE ANALYSIS, 2025–2034, (USD MILLION)
FIGURE 131 SOUTH AFRICA SMART CARD CURRENT AND FUTURE END USER ANALYSIS, 2025–2034, (USD MILLION)
FIGURE 132 ISRAEL SMART CARD CURRENT AND FUTURE TYPE ANALYSIS, 2025–2034, (USD MILLION)
FIGURE 133 ISRAEL SMART CARD CURRENT AND FUTURE END USER ANALYSIS, 2025–2034, (USD MILLION)
FIGURE 134 REST OF MEA SMART CARD CURRENT AND FUTURE TYPE ANALYSIS, 2025–2034, (USD MILLION)
FIGURE 135 REST OF MEA SMART CARD CURRENT AND FUTURE END USER ANALYSIS, 2025–2034, (USD MILLION)
FIGURE 136 U. S. MARKET SHARE ANALYSIS BY TYPE (2024)
FIGURE 137 U. S. MARKET SHARE ANALYSIS BY END USER (2024)
FIGURE 138 CANADA MARKET SHARE ANALYSIS BY TYPE (2024)
FIGURE 139 CANADA MARKET SHARE ANALYSIS BY END USER (2024)
FIGURE 140 MEXICO MARKET SHARE ANALYSIS BY TYPE (2024)
FIGURE 141 MEXICO MARKET SHARE ANALYSIS BY END USER (2024)
FIGURE 142 CHINA MARKET SHARE ANALYSIS BY TYPE (2024)
FIGURE 143 CHINA MARKET SHARE ANALYSIS BY END USER (2024)
FIGURE 144 JAPAN MARKET SHARE ANALYSIS BY TYPE (2024)
FIGURE 145 JAPAN MARKET SHARE ANALYSIS BY END USER (2024)
FIGURE 146 INDIA MARKET SHARE ANALYSIS BY TYPE (2024)
FIGURE 147 INDIA MARKET SHARE ANALYSIS BY END USER (2024)
FIGURE 148 SOUTH KOREA MARKET SHARE ANALYSIS BY TYPE (2024)
FIGURE 149 SOUTH KOREA MARKET SHARE ANALYSIS BY END USER (2024)
FIGURE 150 SAUDI ARABIA MARKET SHARE ANALYSIS BY TYPE (2024)
FIGURE 151 SAUDI ARABIA MARKET SHARE ANALYSIS BY END USER (2024)
FIGURE 152 UAE MARKET SHARE ANALYSIS BY TYPE (2024)
FIGURE 153 UAE MARKET SHARE ANALYSIS BY END USER (2024)
FIGURE 154 EGYPT MARKET SHARE ANALYSIS BY TYPE (2024)
FIGURE 155 EGYPT MARKET SHARE ANALYSIS BY END USER (2024)
FIGURE 156 NIGERIA MARKET SHARE ANALYSIS BY TYPE (2024)
FIGURE 157 NIGERIA MARKET SHARE ANALYSIS BY END USER (2024)
FIGURE 158 SOUTH AFRICA MARKET SHARE ANALYSIS BY TYPE (2024)
FIGURE 159 SOUTH AFRICA MARKET SHARE ANALYSIS BY END USER (2024)
FIGURE 160 GERMANY MARKET SHARE ANALYSIS BY TYPE (2024)
FIGURE 161 GERMANY MARKET SHARE ANALYSIS BY END USER (2024)
FIGURE 162 FRANCE MARKET SHARE ANALYSIS BY TYPE (2024)
FIGURE 163 FRANCE MARKET SHARE ANALYSIS BY END USER (2024)
FIGURE 164 UK MARKET SHARE ANALYSIS BY TYPE (2024)
FIGURE 165 UK MARKET SHARE ANALYSIS BY END USER (2024)
FIGURE 166 SPAIN MARKET SHARE ANALYSIS BY TYPE (2024)
FIGURE 167 SPAIN MARKET SHARE ANALYSIS BY END USER (2024)
FIGURE 168 ITALY MARKET SHARE ANALYSIS BY TYPE (2024)
FIGURE 169 ITALY MARKET SHARE ANALYSIS BY END USER (2024)
FIGURE 170 BRAZIL MARKET SHARE ANALYSIS BY TYPE (2024)
FIGURE 171 BRAZIL MARKET SHARE ANALYSIS BY END USER (2024)
FIGURE 172 ARGENTINA MARKET SHARE ANALYSIS BY TYPE (2024)
FIGURE 173 ARGENTINA MARKET SHARE ANALYSIS BY END USER (2024)
FIGURE 174 COLUMBIA MARKET SHARE ANALYSIS BY TYPE (2024)
FIGURE 175 COLUMBIA MARKET SHARE ANALYSIS BY END USER (2024)
FIGURE 176 GLOBAL SMART CARD CURRENT AND FUTURE MARKET KEY COUNTRY LEVEL ANALYSIS, 2024–2034, (USD MILLION)
FIGURE 177 FINANCIAL OVERVIEW:
Key Player Analysis
Gemalto (Thales Group): Gemalto, operating under the Thales Group since its acquisition, has solidified its leadership in secure digital identity and smart card technologies for construction sector transformation. In 2025, the company distinguishes itself through the Thales D1 digital-first card issuance platform, enabling seamless, cloud-driven deployment of virtual, digital, and physical credentials suited for mobile and modular construction environments. Thales also leads in the integration of biometric authentication directly into EMV cards, aligning with automation and real-time access requirements across large job sites. Its advanced payment and access solutions allow construction and infrastructure clients to digitize workforce management, site entry, and procurement, enhancing transparency and operational efficiency. Thales’ persistent investment in sustainable card materials directly supports construction firms seeking to meet ESG targets as part of digital transformation strategies.
Giesecke+Devrient (G+D): Giesecke+Devrient stands out as an innovation-focused player, leveraging robust funding to scale up security and smart card production for rapidly digitizing industries, including construction. By incorporating advanced cryptographic modules and AI-augmented access management, G+D enables secure, automated worker identification and compliance tracking on construction projects—a growing necessity for both regulatory and safety management in modular and multi-site builds. Their ongoing partnerships with construction technology firms foster integration with building information modeling (BIM) tools and cloud-based project management workflows, supporting more automated, data-driven construction processes and improved project lifecycle tracking.
IDEMIA: IDEMIA is emerging as a disruptor by combining augmented identity platforms and smart credentials tailored for complex, multi-user environments such as large infrastructure and modular construction projects. As of 2025, the company’s latest PIV-compliant smart cards and digital identity solutions—now validated on stringent U.S. federal standards—enable secure, role-based authentication, crucial for sensitive project zones and dynamic workforce mobility. IDEMIA’s expansion into strategic partnerships, especially in the Gulf and smart city initiatives, strengthens its market position in providing scalable, AI-enhanced identity management and site access solutions that integrate with digital twins and IoT-enabled construction sites. Emphasis on scalable biometrics and GDPR-compliant privacy drives adoption among contractors prioritizing security and regulatory compliance.
NXP Semiconductors: NXP Semiconductors excels in powering the edge computing and AI transformation within the construction sector. Its processors and microcontrollers, equipped with neural processing units (NPUs), make real-time data analytics and automation possible at the construction site edge. By supporting decentralized decision-making—whether through automated machinery, on-site access control, or sensor-driven project monitoring—NXP’s platforms fuel modular construction, digital twins, and predictive maintenance workflows central to Construction 4.0. The company’s strategic moves, including recent funding rounds aimed at scaling IoT and secure payment applications, demonstrate a commitment to delivering secure, energy-efficient, and scalable solutions for every phase of digitally enabled construction project delivery.
Market key players
IDEMIA
HID Global
STMicroelectronics
Sony Corporation
CPI Card Group
Giesecke+Devrient
Infineon Technologies
Samsung Electronics Co., Ltd.
Gemalto (Thales Group)
Oberthur Technologies (OT-Morpho)
NXP Semiconductors
Other Key Players
Driver
Accelerating Digital Infrastructure Modernization and Biometric Authentication Integration
As of 2025, the smart card market experiences unprecedented momentum driven by comprehensive digital infrastructure overhauls across financial institutions and government agencies worldwide. Banking sectors are implementing next-generation EMV migration programs that mandate dual-interface capabilities, with contactless transaction volumes reaching 42% growth annually in emerging markets including India and Southeast Asia. This transformation extends beyond basic payment processing, as financial organizations integrate advanced biometric authentication features including fingerprint sensors and facial recognition technology directly onto smart card substrates, creating multi-factor security architectures that address escalating cyber threat landscapes.
The convergence of artificial intelligence algorithms with smart card processors has fundamentally enhanced fraud detection capabilities, enabling real-time transaction analysis and adaptive security responses that reduce false positive rates by over 35% compared to traditional authentication methods. Government digitalization initiatives across Asia-Pacific and European Union markets are simultaneously driving large-scale deployments of national identification systems, e-passport programs, and digital health credentials that require sophisticated smart card technologies capable of storing encrypted biometric data and supporting interoperable authentication protocols across multiple service platforms.
Restraint
Infrastructure Complexity and Post-Quantum Cryptography Transition Costs
The smart card market faces significant deployment barriers in 2025 stemming from the substantial infrastructure investments required for comprehensive system modernization and the imperative transition to post-quantum cryptographic standards. Organizations encounter implementation costs exceeding $2.5 million for enterprise-scale smart card deployments, particularly affecting small and medium enterprises where 65% cite financial constraints as primary adoption deterrents. The complexity intensifies as legacy terminal infrastructure requires extensive upgrades to support advanced authentication protocols, creating operational disruptions during transition periods that can extend 18-24 months for large-scale implementations.
The emerging threat from quantum computing capabilities necessitates immediate migration to post-quantum cryptography (PQC) algorithms, compelling smart card manufacturers to develop hybrid solutions that maintain backward compatibility while incorporating quantum-resistant security features. This dual-algorithm approach increases manufacturing costs by approximately 25-30% and requires extensive certification processes across multiple regulatory frameworks, creating supply chain bottlenecks that constrain market expansion velocity and limit accessibility for cost-sensitive market segments.
Opportunity
Sustainable Smart Card Manufacturing and Circular Economy Integration
The global sustainability imperative presents transformative opportunities for smart card manufacturers to capture emerging market segments through eco-friendly production methodologies and circular economy business models. Environmental regulations across European Union and North American markets are mandating renewable material content exceeding 60% by 2027, creating demand for biodegradable smart card substrates and recycled semiconductor components. Forward-thinking manufacturers are developing innovative production processes utilizing ocean plastic waste and bio-based polymers that reduce carbon footprints by up to 45% while maintaining security standards and durability requirements for multi-year deployment cycles.
The integration of smart cards with Internet of Things (IoT) ecosystems and smart city infrastructure represents a $12 billion addressable market opportunity through 2030, as municipal governments implement comprehensive digital identity platforms that consolidate transportation, healthcare, and citizen services onto unified smart card architectures. This convergence enables new revenue streams through value-added services including predictive maintenance analytics, carbon footprint tracking, and personalized sustainability recommendations that align with corporate environmental, social, and governance (ESG) objectives while delivering measurable operational efficiencies for end-user organizations.
Trend
AI-Powered Personalization and Autonomous Smart Card Management Systems
The smart card industry is experiencing a paradigmatic shift toward artificial intelligence-driven personalization engines that dynamically optimize user experiences and security protocols based on behavioral analytics and contextual usage patterns. Advanced machine learning algorithms integrated within smart card processors now enable predictive fraud prevention, automatic spending category recognition, and personalized loyalty program optimization that adapts in real-time to individual consumer preferences and risk profiles. These AI-enhanced systems reduce transaction processing times by 40% while simultaneously improving security accuracy through continuous behavioral modeling that detects anomalous activities with precision rates exceeding 99.2%.
Autonomous smart card management platforms are revolutionizing enterprise deployments through self-healing security protocols, predictive maintenance scheduling, and automated compliance monitoring that eliminates manual oversight requirements. These systems leverage distributed ledger technology and edge computing capabilities to enable decentralized identity verification, cross-border transaction processing, and interoperable authentication across diverse service ecosystems without compromising data sovereignty or privacy protection standards, positioning smart cards as fundamental infrastructure components for the emerging autonomous digital economy.
Recent Developments
August 2025 – Infineon Technologies: Successfully completed the acquisition of Marvell Technology's Automotive Ethernet business for US$2.5 billion, securing a design-win pipeline of approximately US$4 billion by 2030. This strategic acquisition strengthens Infineon's leadership position in automotive semiconductors and expands capabilities for software-defined vehicles, while creating new opportunities in physical AI applications such as humanoid robots.
September 2025 – IDEMIA Secure Transactions: Launched an innovative light-up payment card with Banca Transilvania for UNTOLD music festival, featuring the company's Starlight technology that illuminates during contactless payments without requiring batteries. This collaboration demonstrates IDEMIA's commitment to transforming physical card experiences in an increasingly digital age, with over 10,000 digital card activations achieved in under two days during the 2024 festival.
November 2024 – IDEMIA Secure Transactions & Serenity: Announced the launch of the sAxess biometric card, combining blockchain technology with biometric smart card capabilities to provide enhanced digital security and data recovery solutions. This hybrid approach integrates IDEMIA's F.CODE biometric platform with blockchain-based backup mechanisms, addressing critical needs for secure data access and immutable transaction records in financial and enterprise applications.
May 2025 – Saudi Awwal Bank & IDEMIA: Launched the Kingdom's first "Tap to Activate" smart card solution, enabling customers to activate new payment cards by simply tapping their smartphones without requiring ATM visits or phone banking. This deployment represents IDEMIA's expansion into the Middle Eastern market and demonstrates the company's focus on seamless digital-physical payment integration that supports Saudi Arabia's broader digital transformation initiatives.
Frequently Asked Questions
How big is the Smart Card Market ?
The Smart Card Market is expected to grow from USD 17.9 Billion in 2024 to USD 34.8 Billion by 2034, at a CAGR of 6.4%. Rising digital payments, biometric authentication, and government-led identity programs are driving global smart card adoption across banking, telecom, and public services.
Who are the major players in the Smart Card Market ?
By Type (Contact Smart Cards, Contactless Smart Cards, Dual Interface Smart Cards), By Application (Banking and Financial Services, Telecommunications, Healthcare, Transportation, Government and Public Sector, Retail and Loyalty Programs, Other Applications)
How can this market research report help my business make strategic decisions?
Our market research reports provide actionable intelligence, including verified market size data, CAGR projections, competitive benchmarking, and segment-level opportunity analysis. These insights support strategic planning, investment decisions, product development, and market entry strategies for enterprises and startups alike.
How frequently is the data updated?
We continuously monitor industry developments and update our reports to reflect regulatory changes, technological advancements, and macroeconomic shifts. Updated editions ensure you receive the latest market intelligence.