
- Home
- Industries
 Aerospace And Defence
 Agriculture
 Automotive And Transportation
 Banking And Finance
 Business
 Chemicals And Materials
 Consumer And Retail
 Electronics And Semiconductors
 Food And Beverages
 Machinery & Equipments
 Manufacturing And Construction
 Medical Devices
 Others
 Pharmaceuticals And Healthcare
 Power And Energy
 Sports
 Technology
- Services
- News Room
- About us
- Contact Us
-
Smart Cities Infrastructure Market Size, Trends & Forecast 2034
Global Smart Cities Infrastructure Market Size, Share, Analysis Report By Component (Smart Transportation, Intelligent traffic management, Public transportation management), Smart Utilities (Smart water management, Smart waste management, Smart energy management), Smart Buildings (Energy management systems, Building automation systems), Smart Infrastructure (Smart street lighting, Smart parking solutions), Smart Governance (E-governance solutions, Citizen engagement platforms), Smart Healthcare (Telehealth services, Health monitoring systems), Smart Security (Surveillance systems, Access control systems), Region and Key Players - Industry Segment Overview, Market Dynamics, Competitive Strategies, Trends and Forecast 2025-2034

Report Overview:
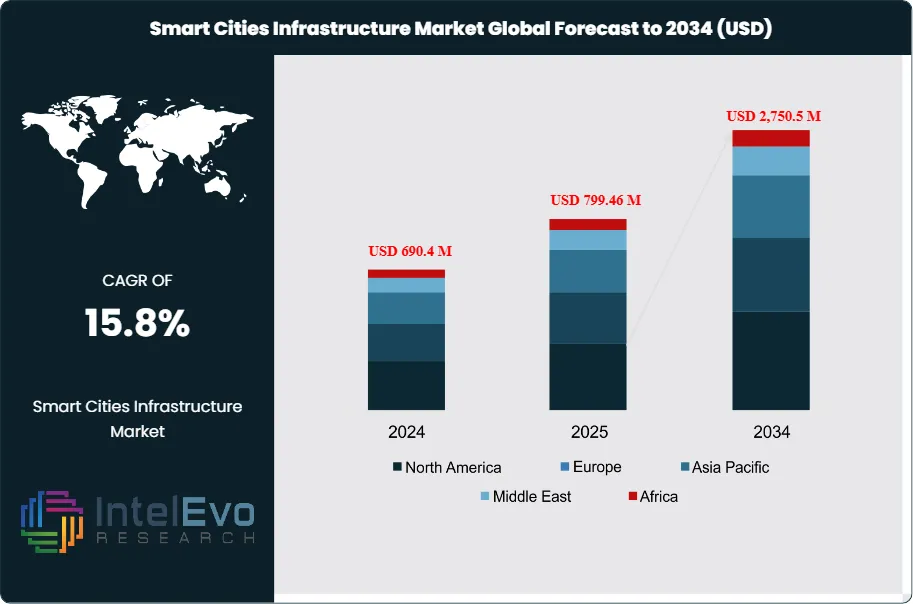
The Global Smart Cities Infrastructure Market size is projected to be worth around USD 2,750.5 million by 2034, up from USD 690.4 million in 2024, growing at a CAGR of 15.8% during the forecast period from 2024 to 2034. This growth is driven by rapid urbanization, rising adoption of IoT, AI, and 5G technologies, and strong government initiatives to build sustainable and connected cities. With smart mobility, energy-efficient buildings, and advanced public safety solutions at the core, smart city infrastructure is set to redefine urban living and attract large-scale investments from both public and private sectors.
Get More Information about this report -
Request Free Sample ReportThe Global Smart Cities Infrastructure Market includes an enormous variety of technologies and services aimed at the upgrade of urban life through intelligent solutions. This market is comprised of smart lighting, traffic management systems, waste management, and smart buildings, amongst others, all working toward better sustainability and efficiency in the urban domain. The dynamics within the market based on current conditions will be related to urban population growth, with regard to the speed at which technology advances, and the demand for smart city solutions. The valuation of approximately USD 690.4 million in 2024 will be witnessing a growth in the market up to approximately USD 2,750.5 million by the end of 2034, with tremendous growth opportunities presented by innovative infrastructure integration.
The dynamics of the Smart Cities Infrastructure Market are highly influenced by enhanced urban management, increased investments in technology, and related government initiatives for smart city developments. However, critical factors that sustain the market's growth are urbanization, as large areas per unit with high population require efficient management and infrastructure; development in IoT technologies that really empower connectivity; and increasing environmental concerns that push cities toward sustainable practices. Moreover, artificial intelligence advancements and massive data analytics allow cities to utilize the data in their decision-making process. This will further enhance the overall operational effectiveness. Therefore, these will include an exceptional compound annual growth rate (CAGR) of almost 15.8% between 2024 and 2034.
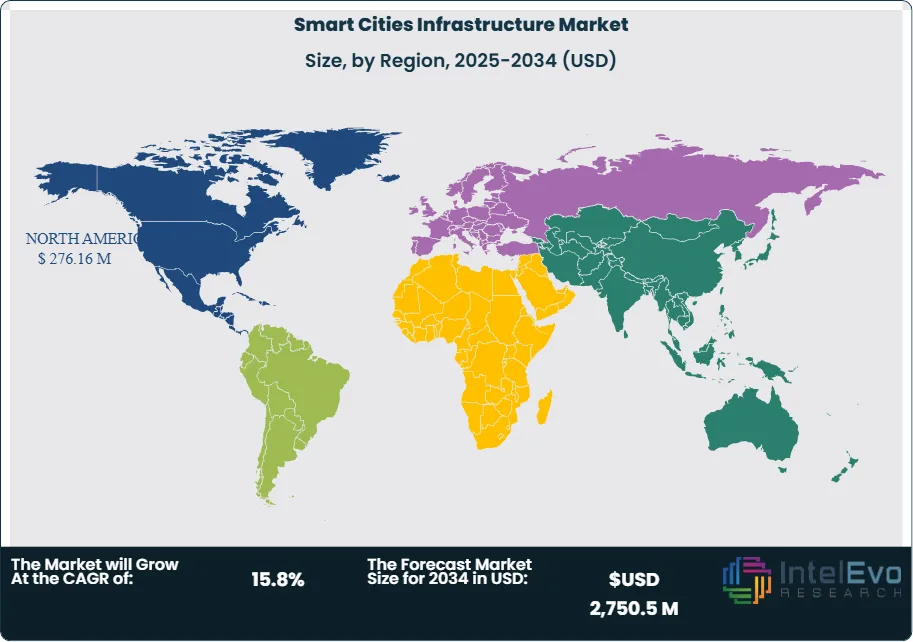
North America currently holds the largest market share of about 31.2% of the Smart Cities Infrastructure Market, with heavy investments in smart technologies and upbeat government policies visualized. Europe and the Asia-Pacific region are expected to grow at a healthy pace for the foreseeable future primarily due to the increasing pace of urbanization every day, with initiatives for sustainable cities on the rise. China and India are the others who are rapidly advancing countries in smart city projects where technology is used to address city problems. But then again, the Middle East and Africa seem to open promising growth opportunities because governments seek smart solutions in upgrading infrastructure and improving living standards.
The COVID-19 epidemic had a profound impact on the Smart Cities Infrastructure Market. On one hand, the initial impact of the outbreak came in terms of delaying projects and investment due to economic uncertainty. It also heightened demand for smart solutions as cities tried to strengthen public health and safety systems. The growing need for digital infrastructure and remote services was ever more clearly recognized during the period, compelling a trend of smart technologies in the urban planning and management of cities. Cities are recovering, but the concerns of such resilient and adaptive urban environments may gain pace, pushing investment deeper into smart city initiatives.
, Smart Utilities (Smart water management, Smart waste management, Smart energy management), Smart Buildings (Energy management systems, Building automation systems), Smart Infrastructure (Smart street lighting, Smart parking solutions), Smart Governance (E-governance solutions, Citizen engagement platforms), Smart Healthcare (Telehealth services, Health monitoring systems), Smart Security (Surveillance systems, Access control systems), Region and Key Players - Industry Segment Overview, Market Dynamics, Competitive Strategies, Trends and Forecast 2025-2034")
Key Takeaways:
- Market Growth: The Global Smart Cities Infrastructure Market is expected to reach USD $2,750.5 million by 2034, growing at a robust CAGR of 15.8% from its current value of USD $690.4 million in 2024.
- Smart Transportation Analysis: The smart transportation segment focuses on intelligent traffic management and public transportation systems, enhancing mobility and reducing congestion. It aims to improve urban mobility through real-time data analysis and connectivity.
- Smart Utilities Analysis: Smart utilities encompass solutions for water, waste, and energy management. These technologies aim to optimize resource consumption and enhance sustainability, contributing to efficient urban operations and reduced environmental impact.
- Driver: Increasing urbanization is a significant driver for the Smart Cities Infrastructure Market, as cities seek innovative solutions to manage growing populations, enhance quality of life, and address environmental challenges through smart technologies.
- Restraint: High implementation costs and the complexity of integrating new technologies into existing urban frameworks can restrain market growth. Additionally, varying regulatory standards across regions may hinder project execution and investor confidence.
- Opportunity: The demand for sustainable urban solutions presents significant opportunities for growth, particularly in developing regions. Investing in smart technologies that promote energy efficiency and waste reduction can lead to new market avenues and revenue streams.
- Trend: The adoption of Internet of Things (IoT) technologies is a prevailing trend, enabling cities to gather and analyze data effectively, fostering smarter decision-making and improved urban services.
- Regional Analysis: North America leads the Smart Cities Infrastructure Market, driven by substantial investments and innovation. Asia-Pacific is expected to witness significant growth due to rapid urbanization and government initiatives focused on sustainable city development.
By Component:
The Smart Cities Infrastructure Market includes various components such as energy, mobility, water, governance, healthcare, housing, and security systems. Smart Grids and Energy Management aim to improve energy distribution and integrate renewable sources. Smart Transportation and Mobility help with the adoption of electric vehicles, connected vehicles, and traffic management. Smart Water and Waste Management support sustainability by monitoring resources and treating them efficiently. Smart Governance and E-Government Platforms enhance citizen services and make administration more efficient. Smart Healthcare Infrastructure uses telemedicine and IoT-enabled health systems. Smart Buildings and Homes encourage energy-efficient living through automation. Smart Security and Surveillance ensure public safety with AI-powered monitoring and predictive analytics. Together, these components make up the foundation of modern smart cities.
By Deployment Model:
Deployment models in smart city infrastructure are changing to meet various needs. On-Premises solutions give governments and businesses strong control, security, and the ability to customize their infrastructure systems. Cloud-Based models are becoming popular because they are scalable, cost-effective, and allow real-time data processing for applications like smart traffic management, governance platforms, and healthcare. Hybrid deployment models combine the best of both worlds, providing flexibility, agility, and data security by handling critical operations locally while using the cloud for large-scale analytics and scalability. As cities become more digital, hybrid deployment is becoming the preferred choice, balancing cost and security.
By Technology:
Smart city infrastructure relies on various technologies that promote efficiency, innovation, and connectivity. The Internet of Things (IoT) links billions of devices across energy grids, mobility systems, and governance. Artificial Intelligence (AI) and Machine Learning analyze large data sets to support predictive decision-making in areas like traffic control, healthcare, and surveillance. Blockchain facilitates secure and transparent transactions in governance and energy trading. 5G connectivity boosts smart mobility, remote healthcare, and real-time surveillance. Big Data and Analytics help city authorities predict demand and manage resources more effectively. Edge Computing reduces latency by processing data closer to its source. All these technologies create the digital backbone of smart cities around the world.
By Application:
Smart city infrastructure has applications across key sectors, enhancing urban efficiency and sustainability. Energy and Utilities benefit from smart grids, renewable integration, and efficient power distribution. Transportation and Mobility applications support intelligent traffic systems, electric vehicle infrastructure, and shared mobility options. Healthcare integrates digital hospitals, telemedicine, and IoT-based health monitoring. Public Safety uses surveillance, emergency response systems, and disaster management tools. Governance applications improve citizen engagement and e-services. Education enjoys smart classrooms, e-learning platforms, and connected institutions. Other areas include innovations in retail, tourism, and waste management. Together, these applications change how cities provide services and improve quality of life.
By End-User:
Smart city infrastructure is adopted by various end-users. Government and Municipalities are the main drivers, implementing policies, smart utilities, and governance solutions. Commercial and Corporate Enterprises use smart infrastructure for office complexes, IT parks, and sustainable business practices. The Residential Sector gains from smart homes, community surveillance, and energy-efficient housing options. The Industrial Sector incorporates smart grids, automation, and waste management for sustainable operations. Each end-user segment plays a unique role in adopting smart technologies, leading to improved efficiency, sustainability, and user experience in urban environments. Governments are expected to lead in adoption, while private enterprises increasingly invest and innovate.
By Region Analysis:
North America Holds the Largest Market Share in the Smart Cities Infrastructure Market: North America dominates the Smart Cities Infrastructure Market, accounting for approximately 40% of the total market share. The region's leadership is attributed to significant investments in smart technology by both the public and private sectors. Major cities like New York and San Francisco are pioneers in implementing smart transportation and utility systems, fostering improved quality of life and operational efficiency. Additionally, supportive government policies and funding for innovative urban solutions further enhance market growth. The presence of established technology firms and startups in this region accelerates advancements in smart infrastructure, ensuring North America remains at the forefront of the smart cities revolution.
Asia-Pacific is projected to be the fastest-growing region in the Smart Cities Infrastructure Market, with a CAGR of approximately 18% over the next decade. Rapid urbanization, especially in countries like China and India, drives the demand for smart city solutions to address challenges related to infrastructure and public services. The increasing population density and government initiatives aimed at sustainable urban development significantly contribute to this growth. Furthermore, cities in this region are adopting advanced technologies, such as IoT and AI, to enhance public transportation and energy management systems. Other regions, including Europe and Latin America, are also witnessing growth, with Europe focusing on sustainable energy solutions and Latin America exploring smart governance and urban mobility initiatives. The Middle East and Africa, while currently smaller in market share, are gradually adopting smart city solutions, driven by investments in infrastructure and technology.
Get More Information about this report -
Request Free Sample ReportKey Market Segment
By Component
- Smart Grids & Energy Management
- Smart Transportation & Mobility
- Smart Water & Waste Management
- Smart Governance & E-Government Platforms
- Smart Healthcare Infrastructure
- Smart Buildings & Homes
- Smart Security & Surveillance
By Deployment Model
- On-Premises
- Cloud-Based
- Hybrid
By Technology
- Internet of Things (IoT)
- Artificial Intelligence (AI) & Machine Learning
- Blockchain
- 5G Connectivity
- Big Data & Analytics
- Edge Computing
By Application
- Energy & Utilities
- Transportation & Mobility
- Healthcare
- Public Safety
- Governance
- Education
- Others
By End-User
- Government & Municipalities
- Commercial & Corporate Enterprises
- Residential Sector
- Industrial Sector
By Region
- North America
- Latin America
- East Asia And Pacific
- Sea And South Asia
- Eastern Europe
- Western Europe
- Middle East & Africa
| Report Attribute | Details |
| Market size (2025) | USD 799.46 M |
| Forecast Revenue (2034) | USD 2,750.5 M |
| CAGR (2025-2034) | 15.8% |
| Historical data | 2018-2023 |
| Base Year For Estimation | 2024 |
| Forecast Period | 2025-2034 |
| Report coverage | Revenue Forecast, Competitive Landscape, Market Dynamics, Growth Factors, Trends and Recent Developments |
| Segments covered | By Component (Smart Grids & Energy Management, Smart Transportation & Mobility, Smart Water & Waste Management, Smart Governance & E-Government Platforms, Smart Healthcare Infrastructure, Smart Buildings & Homes, Smart Security & Surveillance), By Deployment Model (On-Premises, Cloud-Based, Hybrid), By Technology (Internet of Things (IoT), Artificial Intelligence (AI) & Machine Learning, Blockchain, 5G Connectivity, Big Data & Analytics, Edge Computing), By Application (Energy & Utilities, Transportation & Mobility, Healthcare, Public Safety, Governance, Education, Others), By End-User (Government & Municipalities, Commercial & Corporate Enterprises, Residential Sector, Industrial Sector) |
| Research Methodology |
|
| Regional scope |
|
| Competitive Landscape | IBM Corporation, Cisco Systems Inc., Siemens AG, Schneider Electric SE, Honeywell International Inc., Microsoft Corporation, Oracle Corporation, Ericsson, Intel Corporation, Accenture PLC, General Electric Company, Huawei Technologies Co. Ltd., Hitachi Ltd., Samsung Electronics Co. Ltd., Mitsubishi Electric Corporation, Veolia Environnement S.A., Siemens Mobility, ABB Ltd., AECOM, Arup Group Limited |
| Customization Scope | Customization for segments, region/country-level will be provided. Moreover, additional customization can be done based on the requirements. |
| Pricing and Purchase Options | Avail customized purchase options to meet your exact research needs. We have three licenses to opt for: Single User License, Multi-User License (Up to 5 Users), Corporate Use License (Unlimited User and Printable PDF). |
, Smart Utilities (Smart water management, Smart waste management, Smart energy management), Smart Buildings (Energy management systems, Building automation systems), Smart Infrastructure (Smart street lighting, Smart parking solutions), Smart Governance (E-governance solutions, Citizen engagement platforms), Smart Healthcare (Telehealth services, Health monitoring systems), Smart Security (Surveillance systems, Access control systems), Region and Key Players - Industry Segment Overview, Market Dynamics, Competitive Strategies, Trends and Forecast 2025-2034")
, Smart Utilities (Smart water management, Smart waste management, Smart energy management), Smart Buildings (Energy management systems, Building automation systems), Smart Infrastructure (Smart street lighting, Smart parking solutions), Smart Governance (E-governance solutions, Citizen engagement platforms), Smart Healthcare (Telehealth services, Health monitoring systems), Smart Security (Surveillance systems, Access control systems), Region and Key Players - Industry Segment Overview, Market Dynamics, Competitive Strategies, Trends and Forecast 2025-2034")
, Smart Utilities (Smart water management, Smart waste management, Smart energy management), Smart Buildings (Energy management systems, Building automation systems), Smart Infrastructure (Smart street lighting, Smart parking solutions), Smart Governance (E-governance solutions, Citizen engagement platforms), Smart Healthcare (Telehealth services, Health monitoring systems), Smart Security (Surveillance systems, Access control systems), Region and Key Players - Industry Segment Overview, Market Dynamics, Competitive Strategies, Trends and Forecast 2025-2034")
Frequently Asked Questions
How big is the Smart Cities Infrastructure Market?
The Global Smart Cities Infrastructure Market is set to reach USD 2,750.5 million by 2034, growing at a CAGR of 15.8%. Explore insights on IoT, AI, 5G, and sustainable urban development driving the future of smart cities.
Who are the major players in the Smart Cities Infrastructure Market?
IBM Corporation, Cisco Systems Inc., Siemens AG, Schneider Electric SE, Honeywell International Inc., Microsoft Corporation, Oracle Corporation, Ericsson, Intel Corporation, Accenture PLC, General Electric Company, Huawei Technologies Co. Ltd., Hitachi Ltd., Samsung Electronics Co. Ltd., Mitsubishi Electric Corporation, Veolia Environnement S.A., Siemens Mobility, ABB Ltd., AECOM, Arup Group Limited
Which segments covered the Smart Cities Infrastructure Market?
By Component (Smart Grids & Energy Management, Smart Transportation & Mobility, Smart Water & Waste Management, Smart Governance & E-Government Platforms, Smart Healthcare Infrastructure, Smart Buildings & Homes, Smart Security & Surveillance), By Deployment Model (On-Premises, Cloud-Based, Hybrid), By Technology (Internet of Things (IoT), Artificial Intelligence (AI) & Machine Learning, Blockchain, 5G Connectivity, Big Data & Analytics, Edge Computing), By Application (Energy & Utilities, Transportation & Mobility, Healthcare, Public Safety, Governance, Education, Others), By End-User (Government & Municipalities, Commercial & Corporate Enterprises, Residential Sector, Industrial Sector)
How can this market research report help my business make strategic decisions?
Our market research reports provide actionable intelligence, including verified market size data, CAGR projections, competitive benchmarking, and segment-level opportunity analysis. These insights support strategic planning, investment decisions, product development, and market entry strategies for enterprises and startups alike.
How frequently is the data updated?
We continuously monitor industry developments and update our reports to reflect regulatory changes, technological advancements, and macroeconomic shifts. Updated editions ensure you receive the latest market intelligence.

Select Licence Type
Connect with our sales team
Smart Cities Infrastructure Market
Published Date : 17 Dec 2024 | Formats :Why IntelEvoResearch
100%
Customer
Satisfaction
24x7+
Availability - we are always
there when you need us
200+
Fortune 50 Companies trust
IntelEvoResearch
80%
of our reports are exclusive
and first in the industry
100%
more data
and analysis
1000+
reports published
till date
