
- Home
- Industries
 Aerospace And Defence
 Agriculture
 Automotive And Transportation
 Banking And Finance
 Business
 Chemicals And Materials
 Consumer And Retail
 Electronics And Semiconductors
 Food And Beverages
 Machinery & Equipments
 Manufacturing And Construction
 Medical Devices
 Others
 Pharmaceuticals And Healthcare
 Power And Energy
 Sports
 Technology
- Services
- News Room
- About us
- Contact Us
-
Smart Glass Market Size, Share, Trends & Forecast 2034 | 10.8% CAGR
Global Smart Glass Market Size, Share & Analysis By Technology (Electrochromic, Photochromic, Thermochromic, SPD, PDLC, Micro-Blinds & Others), By Application (Automotive, Architectural, Aerospace, Consumer Electronics, Marine, Others), By Control Mode (Active, Passive), By End-User (Transportation, Construction, Energy, Consumer Electronics, Others), Region & Key Players – Industry Overview, Dynamics, Trends & Forecast 2025–2034

Report Overview:
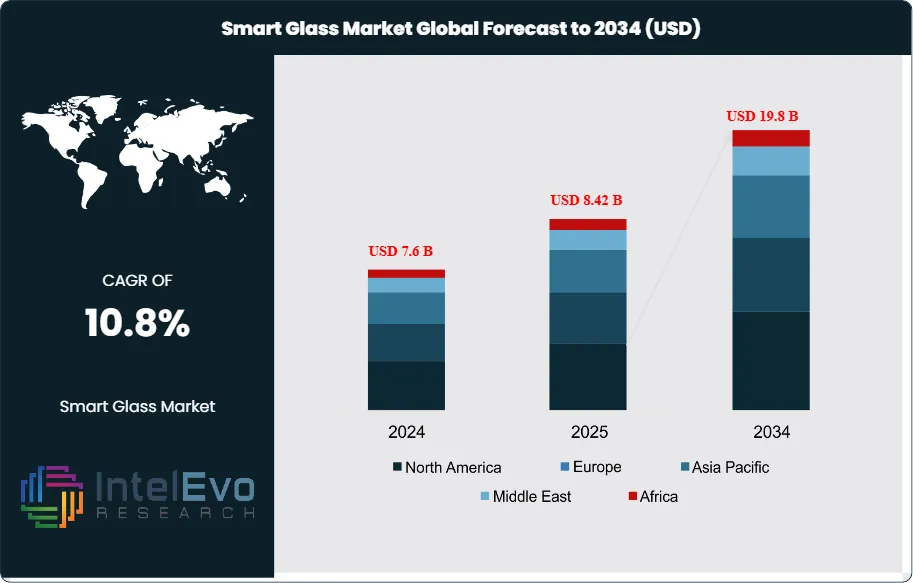
The Global Smart Glass Market size is expected to be worth around USD 19.8 billion by 2034, up from USD 7.6 billion in 2024, growing at a CAGR of 10.8% during the forecast period from 2025 to 2034. The increasing adoption of smart glass technologies in automotive, construction, and consumer electronics sectors is driving market expansion. Energy-efficient and privacy-enhancing glass solutions are gaining traction across smart buildings and vehicles. Moreover, rising sustainability standards, government incentives for green infrastructure, and advancements in electrochromic and photochromic materials are positioning smart glass as a key innovation in the next decade of energy-smart design.
Get More Information about this report -
Request Free Sample ReportSwitchable glass, sometimes referred to as smart glass, is a cutting-edge technology-based glass that modifies its light-transmission characteristics. Smart glass changes how they look and transmit light when power, light, or heat is applied. The global market is growing as a result of its increasing use in a variety of applications, such as architecture, automotive, aerospace, and marine. Technical developments in switchable glasses and architectural advancements in most buildings for the installation of smart windows are the main drivers of the market. The government's strict rules for renovating older buildings with energy-efficient and environmentally friendly technology will also encourage the use of switchable glass.
The expanding energy-conservation programs, such as eco-friendly structures and green buildings, are anticipated to drive the market expansion. Additionally, the market is being positively impacted by a favourable regulatory environment that facilitates financial and tax benefits. The rise of the smart glass industry has been aided by several events, such as an increase in investment and the introduction of industrial-scale manufacturing capacity. The need for clever solutions is fueled by recent developments in modern architecture, such as the broad use of window structures inside buildings, expanding the glazing area, and optimising interference from the external environment.
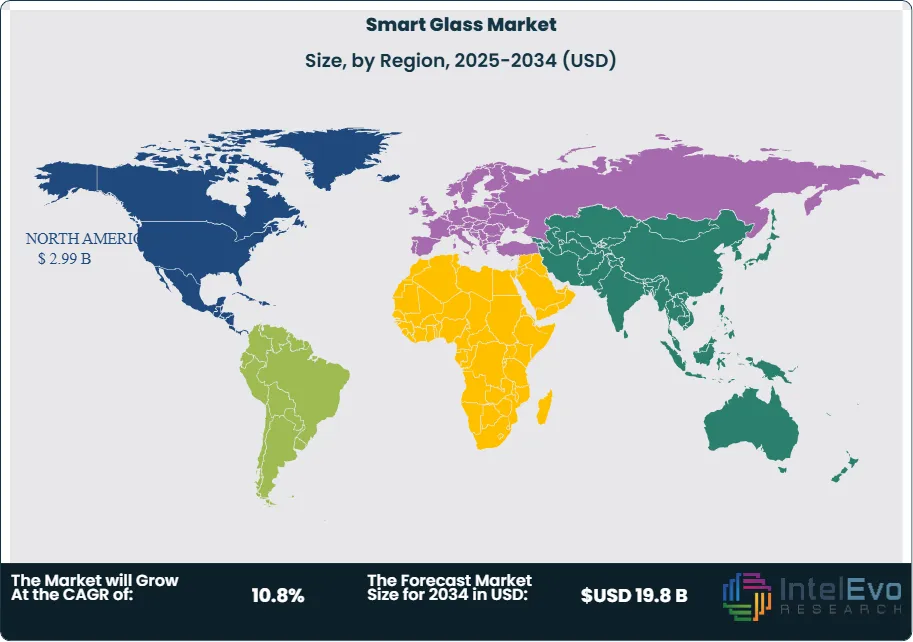
Geographically, North America is expected to dominate the market due to the increasing preference for green buildings in urban cities. One promising option for green and sustainable buildings is smart windows. They can lower a building's energy requirements for heating and cooling because they regulate the quantity of solar radiation that enters the structure. Furthermore, as the market shifts its attention toward integrating energy efficiency solutions to produce aesthetically pleasing buildings, reasonably priced, low-carbon, and high-performing buildings, the construction industry's explosive growth is creating new growth opportunities. Asia Pacific follows closely, owing to the growth opportunities in the transportation sector.
The COVID-19 pandemic has profoundly impacted the market, initially disrupting global supply chains and highlighting their vulnerabilities. However, this disruption has accelerated interest in Smart Glass solves the problem of energy-saving and safety. As companies aim to recover from pandemic-related challenges, there has been an uptick in investments towards digital transformation initiatives.
, By Application (Automotive, Architectural, Aerospace, Consumer Electronics, Marine, Others), By Control Mode (Active, Passive), By End-User (Transportation, Construction, Energy, Consumer Electronics, Others), Region & Key Players – Industry Overview, Dynamics, Trends & Forecast 2025–2034")
Key Takeaways:
- Market Growth: The Smart Glass market is projected to experience substantial growth, with an estimated market size of approximately USD 19.8 billion by 2034, up from USD 7.6 billion in 2024, reflecting a remarkable CAGR of 10.8% during the forecast period. The increasing demand for energy conservation initiatives such as green buildings and eco-friendly structures drives this growth.
- Technology Dominance: Electrochromic technology is expected to dominate the market, as the capacity of electrochromic glass to regulate the quantity of light that passes through it by turning opaque or transparent with a switch or remote control is responsible for the rise in consumer demand. Electrochromic glass windows improve visual comfort because they can lower light transmission over time, particularly when a tremendous amount of light is coming from the outside. It also makes energy conservation possible.
- Application Dominance: Transportation application is anticipated to hold the largest share of the market, as automakers are more inclined to use SPD glass, particularly in the luxury automobile market. 99% of light is blocked by SPD glass made of tint material, which gives the driver the shade and transparency they need to operate the car.
- Driver: An increase in investment and the introduction of industrial-scale manufacturing capacity has aided in the growth of the smart glass market. Furthermore, the market expansion is anticipated to be driven by the expanding energy-conservation programs, such as eco-friendly structures and green buildings.
- Restraint: Despite its potential, the market faces several restraints, including high cost of smart glass when compared to their counterparts.
- Opportunity: Significant opportunities exist in emerging markets, particularly in North America, where rapid industrialisation and increasing technological investments present growth potential. Additionally, increasing growth in the construction sector also opens new growth opportunities for the market during the forecast period.
- Trend: The increasing trend for smart glass is being fueled by recent developments in modern architecture, such as the broad use of window structures inside buildings, expanding the area of glazing, and optimizing interference from the external environment.
- Regional Analysis: North America is expected to lead the market due to the early adoption of smart glass technologies and substantial investments in logistics and supply chain management. However, the Asia-Pacific region is projected to witness the highest growth rate as businesses recognize the benefits of smart glass for optimizing supply chain operations amidst rapid industrialization.
Technology Analysis:
Electrochromic Technology is expected to dominate the market, with a market share of 52%. This is partly due to the device's characteristics, such as its low operating voltage, easy integration with large glass panels, and high UV and IV ray blocking ratio. To modify the amount of heat and light that the electrochromic glass transmits based on the surroundings, it can also be stained, tinted, and made opaque. These glasses are frequently used in retail establishments, medical facilities, educational institutions, and corporate settings.
Application Analysis:
Transportation is expected to hold the largest share of the market, accounting for a market share of 46% driven by demand for SPD glass in luxury cars which blocks 99% of light, providing shade and transparency required by the driver to operate the vehicle. The transportation industry is further classified into the domains of aviation, automobiles, and ships. The rising adoption of smart glasses by luxury automakers is responsible for the market's notable growth. To gain a competitive edge, market participants are being pressured by the growing demand to expand their product offerings in this area.
Regional Analysis:
North America Leads with 39.35% Market Share In the Smart Glass Market: North America is expected to lead the smart glass market, driven by technological advancements and regional business partnerships. Additionally, the demand is expanding as smart glasses become increasingly popular among sports and fitness enthusiasts in nations like the US and Canada. The projected CAGR for North America is around 39.35%, owing to numerous well-known industry participants, such as Amazon Inc. and Bose Corporation.
The Asia-Pacific region is anticipated to witness the highest growth rate, estimated at 10.5% CAGR, due to the region's expanding construction and automobile industries. Additionally, the market expansion in this area is positively impacted by the boom in industrialisation in China, India, and South Korea. Additionally, there is a growing need for these glasses in places like hospitals, tourist attractions, and residential and commercial structures. Businesses in the market are seeing tremendous development potential due to these reasons. The demand for luxury cars and rising disposable income have also expanded the area market. Additionally, the region's growing awareness of energy conservation drives the market's growth by encouraging the adoption of energy-efficient windows and air conditioners.
Get More Information about this report -
Request Free Sample ReportKey Market Segments
By Technology
- Electrochromic Glass
- Photochromic Glass
- Thermochromic Glass
- Suspended Particle Devices (SPD)
- Polymer Dispersed Liquid Crystal (PDLC)
- Micro-Blinds and Others
By Application
- Automotive (Windows, Sunroofs, Mirrors, Display Panels)
- Architectural & Building (Commercial, Residential, Institutional)
- Aerospace & Defense (Cabin Windows, Cockpit Displays)
- Consumer Electronics (Smart Mirrors, Wearables, Displays)
- Marine (Yacht Windows, Cabin Doors)
- Others (Healthcare, Retail Displays, etc.)
By Control Mode
- Active Smart Glass
- Passive Smart Glass
By End-User Industry
- Transportation
- Construction & Real Estate
- Energy & Utilities
- Consumer Electronics
- Others
By Region
- North America
- Latin America
- East Asia And Pacific
- Sea And South Asia
- Eastern Europe
- Western Europe
- Middle East & Africa
| Report Attribute | Details |
| Market size (2025) | USD 8.42 B |
| Forecast Revenue (2034) | USD 19.8 B |
| CAGR (2025-2034) | 10.8% |
| Historical data | 2018-2023 |
| Base Year For Estimation | 2024 |
| Forecast Period | 2025-2034 |
| Report coverage | Revenue Forecast, Competitive Landscape, Market Dynamics, Growth Factors, Trends and Recent Developments |
| Segments covered | By Technology (Electrochromic Glass, Photochromic Glass, Thermochromic Glass, Suspended Particle Devices (SPD), Polymer Dispersed Liquid Crystal (PDLC), Micro-Blinds and Others), By Application (Automotive (Windows, Sunroofs, Mirrors, Display Panels), Architectural & Building (Commercial, Residential, Institutional), Aerospace & Defense (Cabin Windows, Cockpit Displays), Consumer Electronics (Smart Mirrors, Wearables, Displays), Marine (Yacht Windows, Cabin Doors), Others (Healthcare, Retail Displays, etc.)), By Control Mode (Active Smart Glass, Passive Smart Glass), By End-User Industry (Transportation, Construction & Real Estate, Energy & Utilities, Consumer Electronics, Others) |
| Research Methodology |
|
| Regional scope |
|
| Competitive Landscape | ChromoGenics, Gauzy Ltd., Guardian Industries Holdings, LLC, Merck KGaA (Merck Group), PPG Industries Inc., Research Frontiers Inc., Smartglass International, View Inc., Smart Glass Technologies LLC, AGC Inc., Corning Incorporated, Gentex Corporation, Halio Inc., Nippon Sheet Glass Co. Ltd., RavenWindow, Saint Goblin S.A., VELUX Group, Polytronix Inc. |
| Customization Scope | Customization for segments, region/country-level will be provided. Moreover, additional customization can be done based on the requirements. |
| Pricing and Purchase Options | Avail customized purchase options to meet your exact research needs. We have three licenses to opt for: Single User License, Multi-User License (Up to 5 Users), Corporate Use License (Unlimited User and Printable PDF). |
, By Application (Automotive, Architectural, Aerospace, Consumer Electronics, Marine, Others), By Control Mode (Active, Passive), By End-User (Transportation, Construction, Energy, Consumer Electronics, Others), Region & Key Players – Industry Overview, Dynamics, Trends & Forecast 2025–2034")
, By Application (Automotive, Architectural, Aerospace, Consumer Electronics, Marine, Others), By Control Mode (Active, Passive), By End-User (Transportation, Construction, Energy, Consumer Electronics, Others), Region & Key Players – Industry Overview, Dynamics, Trends & Forecast 2025–2034")
, By Application (Automotive, Architectural, Aerospace, Consumer Electronics, Marine, Others), By Control Mode (Active, Passive), By End-User (Transportation, Construction, Energy, Consumer Electronics, Others), Region & Key Players – Industry Overview, Dynamics, Trends & Forecast 2025–2034")
Frequently Asked Questions
How big is the Smart Glass Market?
Discover insights on the Global Smart Glass Market, projected to reach USD 19.8 billion by 2034 at a 10.8% CAGR. Explore key trends, technologies & applications.
Who are the major players in the Smart Glass Market?
ChromoGenics, Gauzy Ltd., Guardian Industries Holdings, LLC, Merck KGaA (Merck Group), PPG Industries Inc., Research Frontiers Inc., Smartglass International, View Inc., Smart Glass Technologies LLC, AGC Inc., Corning Incorporated, Gentex Corporation, Halio Inc., Nippon Sheet Glass Co. Ltd., RavenWindow, Saint Goblin S.A., VELUX Group, Polytronix Inc.
Which segments covered the Smart Glass Market?
By Technology (Electrochromic Glass, Photochromic Glass, Thermochromic Glass, Suspended Particle Devices (SPD), Polymer Dispersed Liquid Crystal (PDLC), Micro-Blinds and Others), By Application (Automotive (Windows, Sunroofs, Mirrors, Display Panels), Architectural & Building (Commercial, Residential, Institutional), Aerospace & Defense (Cabin Windows, Cockpit Displays), Consumer Electronics (Smart Mirrors, Wearables, Displays), Marine (Yacht Windows, Cabin Doors), Others (Healthcare, Retail Displays, etc.)), By Control Mode (Active Smart Glass, Passive Smart Glass), By End-User Industry (Transportation, Construction & Real Estate, Energy & Utilities, Consumer Electronics, Others)
How can this market research report help my business make strategic decisions?
Our market research reports provide actionable intelligence, including verified market size data, CAGR projections, competitive benchmarking, and segment-level opportunity analysis. These insights support strategic planning, investment decisions, product development, and market entry strategies for enterprises and startups alike.
How frequently is the data updated?
We continuously monitor industry developments and update our reports to reflect regulatory changes, technological advancements, and macroeconomic shifts. Updated editions ensure you receive the latest market intelligence.

Select Licence Type
Connect with our sales team
Why IntelEvoResearch
100%
Customer
Satisfaction
24x7+
Availability - we are always
there when you need us
200+
Fortune 50 Companies trust
IntelEvoResearch
80%
of our reports are exclusive
and first in the industry
100%
more data
and analysis
1000+
reports published
till date