
- Home
- Industries
 Aerospace And Defence
 Agriculture
 Automotive And Transportation
 Banking And Finance
 Business
 Chemicals And Materials
 Consumer And Retail
 Electronics And Semiconductors
 Food And Beverages
 Machinery & Equipments
 Manufacturing And Construction
 Medical Devices
 Others
 Pharmaceuticals And Healthcare
 Power And Energy
 Sports
 Technology
- Services
- News Room
- About us
- Contact Us
-
Smart Label Market Size, Share & Growth Forecast 2034 | 13.2% CAGR
Global Smart Label Market Size, Share, Analysis Report By Technology (Electronic Article Surveillance (EAS), Sensing Labels, Radio-Frequency Identification (RFID), Electronic Shelf Label (ESL), Near Field Communication (NFC)), Component (Transceivers, Memories, Batteries, Microprocessors, Others), End-user (Logistics, Food & Beverage, Manufacture, Retail, Healthcare), Region and Key Players - Industry Segment Overview, Market Dynamics, Competitive Strategies, Trends and Forecast 2025-2034

Report Overview:
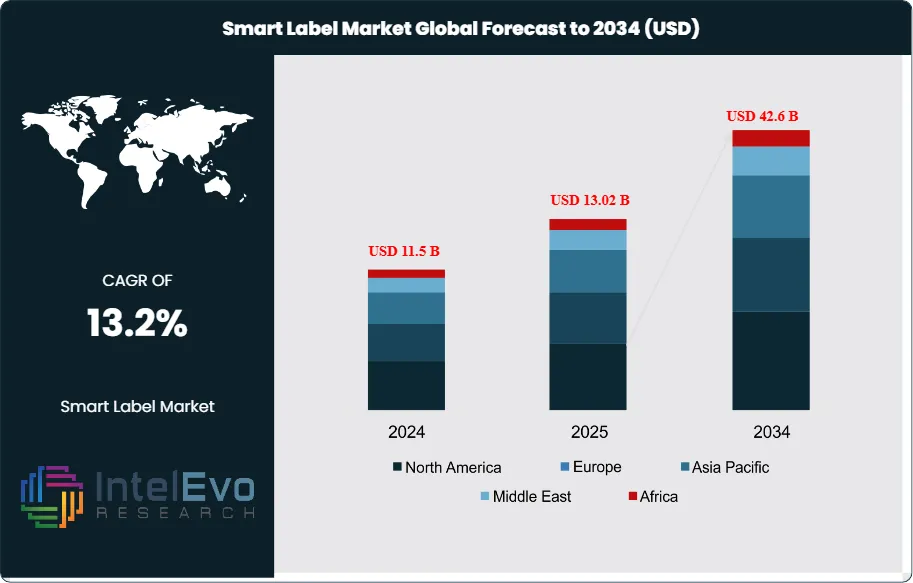
The Global Smart Label Market size is projected to reach USD 42.6 billion by 2034, up from USD 11.5 billion in 2024, growing at a CAGR of 13.2% during the forecast period from 2025 to 2034. The market growth is being driven by the rapid adoption of IoT-enabled labeling solutions, increasing demand for real-time tracking, and the rising need for transparency in retail and logistics operations. With industries shifting toward intelligent packaging and digital supply chains, smart labels are emerging as a critical innovation transforming global commerce.
Get More Information about this report -
Request Free Sample ReportA smart label is an enhanced version of a traditional product label that incorporates technology such as RFID chips, QR codes, NFC tags, or printed sensors to offer more than just static information. Unlike standard labels, smart labels can store, track, and transmit data, making them highly useful for monitoring products throughout the supply chain, verifying authenticity, and improving inventory management. These labels are often used in industries like retail, healthcare, logistics, and food packaging to provide real-time updates, automate processes, and even interact with consumers through smartphone scanning. By enabling quick access to detailed product information and facilitating better tracking, smart labels are helping businesses improve efficiency, reduce errors, and enhance customer engagement.
Smart labels are becoming increasingly popular as they offer practical solutions to everyday business challenges. As more companies look for ways to streamline their operations and give customers better service, smart labels are proving to be a smart investment. And as the technology becomes more affordable, it’s expected that even more industries will start using them. Unlike regular labels, these are designed to do more—they can track items, store data, and even communicate with other devices. This makes them incredibly useful in industries like retail, logistics, and healthcare. For example, in a store, a smart label might help staff quickly check stock levels or prevent theft. In hospitals, it might be used to monitor medications and make sure they’re stored at safe temperatures. One of the big reasons for their growth is the rising demand for more accurate and faster systems that reduce errors and improve efficiency.
The Asia-Pacific region is quickly becoming a major hub for smart label adoption, thanks to its booming industrial and retail sectors. As countries like China, India, and Japan continue to embrace automation and digital transformation, the demand for smart labels has taken off. These labels are being used more widely to improve inventory management, reduce counterfeiting, and streamline logistics—especially in fast-growing sectors like e-commerce, healthcare, and food distribution. China currently leads the region in smart label usage, driven by its strong manufacturing base and emphasis on technological innovation. Meanwhile, India is emerging as a fast-growing market due to the rapid expansion of organized retail and increasing interest in smart supply chain solutions. Retailers in particular are investing in technologies like RFID and electronic shelf labels to improve pricing accuracy, stock monitoring, and the overall customer experience.
The COVID-19 pandemic brought both disruption and opportunity to the smart label market. In the early stages, lockdowns and supply chain interruptions made it difficult for manufacturers to keep production on track. Delays in raw materials and reduced workforce availability slowed down the rollout of smart labeling solutions, especially in industries not deemed essential. This shift in mindset accelerated the adoption of smart labels across various sectors. What was once considered a “nice-to-have” technology quickly became a strategic tool for keeping operations running smoothly in unpredictable conditions. Today, with businesses placing greater importance on automation, transparency, and safety, smart labels are expected to see continued growth well beyond the pandemic period.
, Sensing Labels, Radio-Frequency Identification (RFID), Electronic Shelf Label (ESL), Near Field Communication (NFC)), Component (Transceivers, Memories, Batteries, Microprocessors, Others), End-user (Logistics, Food & Beverage, Manufacture, Retail, Healthcare), Region and Key Players - Industry Segment Overview, Market Dynamics, Competitive Strategies, Trends and Forecast 2025-2034")
Key Takeaways:
- Market Growth: The smart label market is expected to reach USD 39.3 billion by 2034, growing at a robust CAGR of 13.8%, indicating strong market expansion.
- Technology Segment Dominance: The technology segment is dominated by RFID tags segment, accounting for over 28% of the market share. RFID tags allow real-time, wireless tracking without direct line of sight, making them essential for efficient inventory and supply chain management. Their adaptability across sectors like retail, healthcare, and logistics supports widespread use.
- Component Segment Insights: Batteries are anticipated to hold the largest market share. The battery segment dominates the market due to its vital role in powering portable devices, EVs, and energy storage systems. Improved performance, longer lifespan, and rising use in electronics and IoT devices drive its strong demand.
- Driver: Smart labels with RFID and IoT tech are driving market growth by enabling real-time inventory tracking. They help businesses reduce stock issues, streamline supply chains, and improve demand forecasting—boosting efficiency and customer satisfaction.
- Restraint: High initial costs and complex setup make smart label adoption difficult, especially for smaller businesses. The need for infrastructure, tech integration, and training adds to the challenge, limiting widespread use.
- Opportunity: AI-powered smart labels enable real-time tracking, predictive analytics, and automation, helping businesses optimize inventory, reduce errors, and streamline supply chains for better efficiency and cost savings.
- Trend: The smart label market is evolving quickly due to rising demand for real-time tracking, especially in retail, logistics, and healthcare. Integration of RFID and IoT is enabling better inventory management and supply chain visibility. There's a growing focus on sustainability, with eco-friendly label materials gaining popularity. In healthcare, smart labels are helping track medications and ensure safety. Additionally, smart labels are being used to boost consumer engagement through interactive features like NFC and QR codes.
- Regional Analysis: The Asia-Pacific smart label market is growing rapidly due to rising demand in retail, e-commerce, and logistics. Countries like China and India are leading the charge, driven by technological adoption and supply chain modernization. RFID and electronic shelf labels are especially popular, helping businesses improve inventory tracking and reduce counterfeiting. With ongoing digital transformation, the region is expected to remain a key player in the global smart label landscape.
Technology Analysis:
The technology segment is divided into electronic article surveillance (EAS), sensing labels, radio-frequency identification (RFID), electronic shelf label (ESL), and near field communication (NFC). The radio-frequency identification (RFID) segment dominated the market, with a market share of around 28% accounting for 3.0 billion 2024. RFID tags play a vital role in modern inventory and supply chain management by enabling real-time data collection and wireless communication—without the need for direct line of sight. This allows businesses to automatically track products throughout their journey, improving accuracy and visibility. Their flexibility and scalability make RFID systems valuable across multiple industries, including retail, healthcare, and logistics, where efficient tracking and quick data access are critical. As companies seek smarter, more connected operations, RFID technology continues to see growing adoption due to its reliability and efficiency.
Component Analysis:
The component segment is divided into transceivers, memories, batteries, microprocessors, and others. The batteries segment dominated the market, with a market share of around 25% accounting for 2.7 billion 2024. The battery segment leads the market due to its key role in powering everything from smartphones and laptops to electric vehicles and renewable energy systems. Its dominance is largely attributed to high energy density, improved efficiency, and the ability to support portable and sustainable technologies. Ongoing innovations have boosted battery performance and lifespan while reducing costs, making them even more appealing. As consumer electronics, medical devices, and IoT gadgets continue to grow, so does the demand for reliable battery solutions, reinforcing their strong market position.
End-user Analysis:
The end-user segment is divided into logistics, food & beverage, manufacture, retail, healthcare, and aerospace. The retail segment dominated the market, with a market share of around 21% accounting for 2.2 billion 2024. The retail segment leads the smart label market thanks to its need for better inventory control, smoother supply chains, and improved customer experience. Smart labels help retailers monitor stock in real time, cut down on losses, and speed up restocking. They also boost customer engagement by providing product details and promotions through QR codes or NFC, matching the demand for more transparent and convenient shopping.
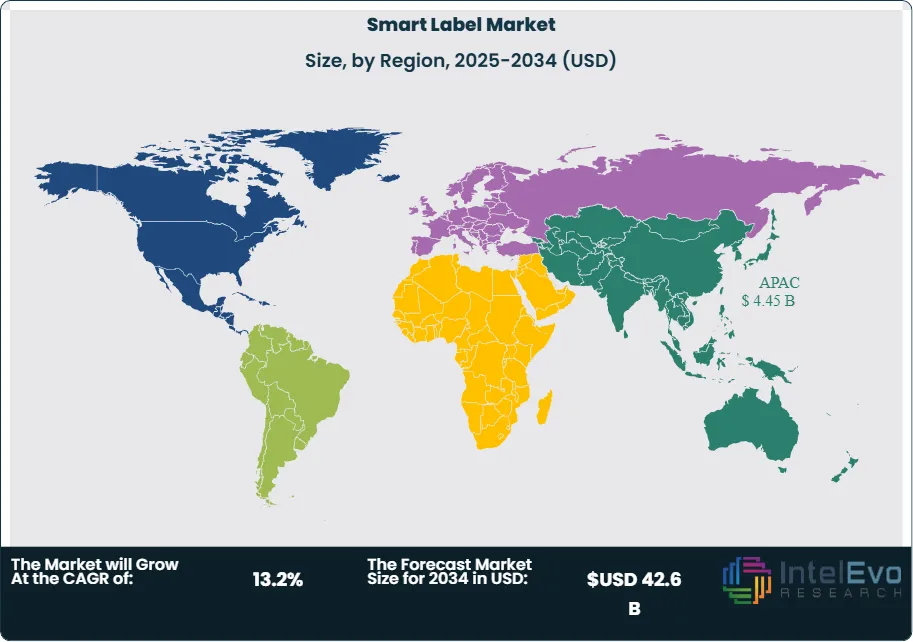
Region Analysis:
Asia Pacific leads with 38.7% Market Share in the Smart Label Market: The Asia-Pacific smart label market is experiencing significant growth, driven by rapid industrial development, expanding e-commerce, and increasing demand for efficient supply chain solutions. Countries like China and India are at the forefront, with China leading in large-scale adoption due to its strong manufacturing base and advanced logistics infrastructure. India, meanwhile, is emerging as one of the fastest-growing markets, fueled by the rise in organized retail, technological adoption, and growing awareness of product authenticity. Smart labels—particularly RFID and electronic shelf labels—are being widely used to enhance inventory management, improve traceability, prevent counterfeiting, and enable dynamic pricing in retail environments. Industries such as healthcare, food and beverage, and logistics are integrating these technologies to streamline operations and ensure better customer experiences. As more businesses across the region embrace digital transformation, the demand for smart labeling solutions is expected to grow steadily, positioning Asia-Pacific as a major global hub for smart label innovation and deployment.
Get More Information about this report -
Request Free Sample ReportKey Market Segment
By Component
- Transceivers
- Memories
- Batteries
- Microprocessors
- Others
By Technology
- RFID Labels
- NFC Labels
- QR Code Labels
- Printable Electronics Labels
- Electronic Article Surveillance (EAS)
- Sensing Labels
- Electronic Shelf Label (ESL)
- Others
By Application
- Retail & E-Commerce
- Food & Beverage
- Healthcare & Pharmaceuticals
- Logistics & Supply Chain
- Industrial & Manufacturing
- Others
By End User
- Retailers
- Manufacturers
- Logistics Service Providers
- Healthcare & Pharmaceutical Companies
- Consumer Electronics Companies
- Aerospace
- Others
By Region
- North America
- Latin America
- East Asia And Pacific
- Sea And South Asia
- Eastern Europe
- Western Europe
- Middle East & Africa
| Report Attribute | Details |
| Market size (2025) | USD 13.02 B |
| Forecast Revenue (2034) | USD 42.6 B |
| CAGR (2025-2034) | 13.2% |
| Historical data | 2018-2023 |
| Base Year For Estimation | 2024 |
| Forecast Period | 2025-2034 |
| Report coverage | Revenue Forecast, Competitive Landscape, Market Dynamics, Growth Factors, Trends and Recent Developments |
| Segments covered | By Component (Transceivers, Memories, Batteries, Microprocessors, Others), By Technology (RFID Labels, NFC Labels, QR Code Labels, Printable Electronics Labels, Electronic Article Surveillance (EAS), Sensing Labels, Electronic Shelf Label (ESL), Others), By Application (Retail & E-Commerce, Food & Beverage, Healthcare & Pharmaceuticals, Logistics & Supply Chain, Industrial & Manufacturing, Others), By End User (Retailers, Manufacturers, Logistics Service Providers, Healthcare & Pharmaceutical Companies, Consumer Electronics Companies, Aerospace, Others) |
| Research Methodology |
|
| Regional scope |
|
| Competitive Landscape |
|
| Customization Scope | Customization for segments, region/country-level will be provided. Moreover, additional customization can be done based on the requirements. |
| Pricing and Purchase Options | Avail customized purchase options to meet your exact research needs. We have three licenses to opt for: Single User License, Multi-User License (Up to 5 Users), Corporate Use License (Unlimited User and Printable PDF). |
, Sensing Labels, Radio-Frequency Identification (RFID), Electronic Shelf Label (ESL), Near Field Communication (NFC)), Component (Transceivers, Memories, Batteries, Microprocessors, Others), End-user (Logistics, Food & Beverage, Manufacture, Retail, Healthcare), Region and Key Players - Industry Segment Overview, Market Dynamics, Competitive Strategies, Trends and Forecast 2025-2034")
, Sensing Labels, Radio-Frequency Identification (RFID), Electronic Shelf Label (ESL), Near Field Communication (NFC)), Component (Transceivers, Memories, Batteries, Microprocessors, Others), End-user (Logistics, Food & Beverage, Manufacture, Retail, Healthcare), Region and Key Players - Industry Segment Overview, Market Dynamics, Competitive Strategies, Trends and Forecast 2025-2034")
, Sensing Labels, Radio-Frequency Identification (RFID), Electronic Shelf Label (ESL), Near Field Communication (NFC)), Component (Transceivers, Memories, Batteries, Microprocessors, Others), End-user (Logistics, Food & Beverage, Manufacture, Retail, Healthcare), Region and Key Players - Industry Segment Overview, Market Dynamics, Competitive Strategies, Trends and Forecast 2025-2034")

Select Licence Type
Connect with our sales team
Why IntelEvoResearch
100%
Customer
Satisfaction
24x7+
Availability - we are always
there when you need us
200+
Fortune 50 Companies trust
IntelEvoResearch
80%
of our reports are exclusive
and first in the industry
100%
more data
and analysis
1000+
reports published
till date
