Global Social Audit Services Market Size, Share & Industry Analysis by Audit Type (Labor Standards, Health & Safety, Ethical Sourcing, Environmental & ESG Audits), by Service Model (Internal Audits, Third-Party Audits, Digital & Continuous Monitoring), by End-Use Industry (Manufacturing, Retail & Apparel, FMCG, Energy & Utilities, Technology, Healthcare), by Organization Size (SMEs, Large Enterprises), Regional Insights, Market Dynamics, Regulatory Landscape, Competitive Benchmarking, Key Players, Strategic Developments, and Forecast 2025–2034
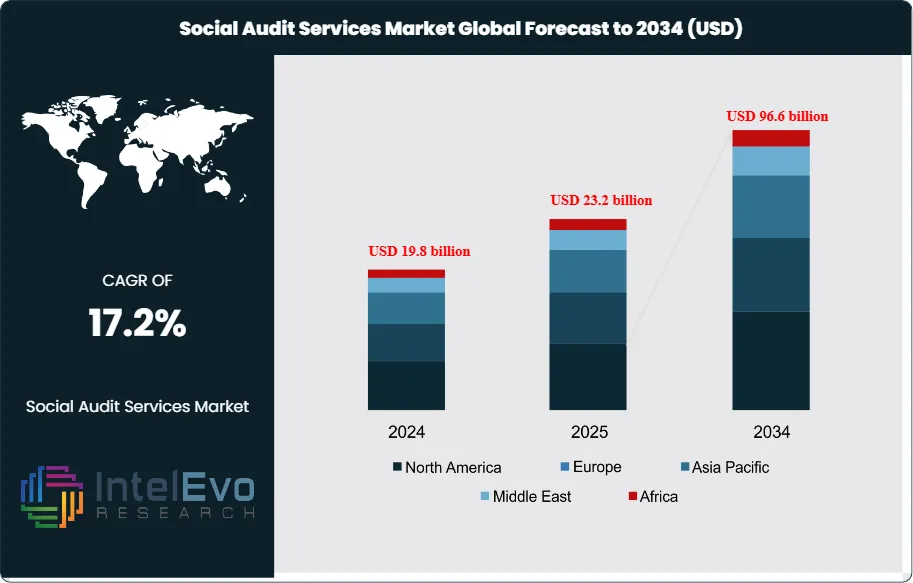
The Social Audit Services Market is estimated at USD 19.8 billion in 2024 and is on track to reach roughly USD 96.6 billion by 2034, implying a robust compound annual growth rate (CAGR) of 17.2% over 2025–2034. This rapid expansion is driven by rising ESG compliance requirements, stricter labor and supply-chain regulations, and growing pressure from investors and consumers for transparency and ethical business practices. Corporations across manufacturing, retail, and services are increasingly relying on third-party social audits to mitigate reputational risk, ensure regulatory alignment, and strengthen sustainability credentials. The integration of digital auditing platforms and real-time monitoring tools is further accelerating adoption, positioning social audit services as a core pillar of global corporate governance strategies.
The market gains momentum as organizations intensify efforts to measure and disclose their social impact, regulatory compliance, and alignment with broader community and environmental expectations. Independent verification strengthens institutional accountability and supports stakeholders seeking credible visibility into corporate conduct. Rising emphasis on labor standards, environmental practices, human rights protection, and community development reinforces the strategic importance of social audits in global corporate governance frameworks.
Growing regulatory intervention accelerates market expansion. Governments expand welfare budgets and reinforce social-impact mandates, prompting enterprises to demonstrate responsible practices through structured audit processes. In the United States, the federal welfare expenditure of USD 1.101 trillion in 2023 reflects a sustained prioritization of social development, indirectly guiding businesses to integrate stronger oversight into their operational models. Initiatives such as the Biden–Harris Administration’s USD 7.8 million grant program to improve access to health and essential services further heighten expectations around transparency and measurable community contributions. These measures influence companies to adopt social auditing as a consistent compliance and risk-management tool.
Technology adoption enhances market sophistication. Audit providers increasingly deploy digital workflow platforms, AI-enabled data validation engines, and automated compliance mapping tools to improve accuracy and reduce assessment time. These capabilities increase audit throughput by an estimated 25–30% and lower reporting errors, helping organizations manage rising disclosure requirements. Digital integration also supports continuous monitoring models, which replace periodic manual reviews and create sustained demand for specialized audit services.
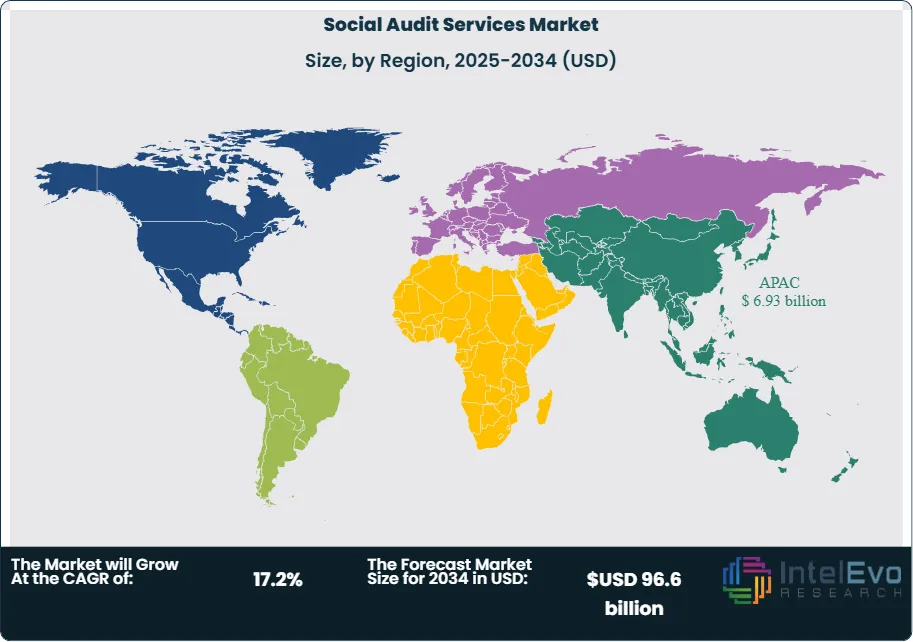
Regional investment patterns shape competitive dynamics. North America accounts for an estimated 38% of global revenue due to established regulatory systems and strong corporate reporting cultures. Europe follows with approximately 30% share, driven by stringent ESG disclosure directives. Asia-Pacific emerges as the fastest-growing region, expanding at a projected CAGR of over 19% as governments strengthen social-welfare programs and multinational enterprises localize sourcing and labor-compliance mechanisms. Large-scale public investments, such as Governor Hochul’s USD 17.2 million commitment to strengthen social-service support and New York City’s USD 2 billion affordable-housing program, create broader expectations for corporate participation in societal priorities, reinforcing long-term demand for social audit services.
Key Takeaways
Market Growth: The Global Social Audit Services Market is projected to increase from USD 19.8 billion in 2024 to USD 96.6 billion by 2034, reflecting a CAGR of 17.2 percent driven by expanding regulatory scrutiny, ESG reporting, and stakeholder expectations for verified social impact. Service providers that align audit offerings with compliance, risk, and ESG agendas are positioned to capture the largest share of incremental spending.
Audit Type: CSR-focused social audits held approximately 57.5 percent of market revenue in 2023, indicating that most spend currently centers on verifying ethical sourcing, labor standards, and environmental practices. Demand for CSR audits is expected to maintain double-digit growth as listed companies expand disclosure under ESG and supply-chain transparency rules.
End User: Healthcare and pharmaceuticals accounted for about 44.2 percent of global social audit revenues in 2023, reflecting strict clinical, ethical, and patient-safety obligations. This segment is projected to grow at around 18 percent CAGR as regulators intensify scrutiny of patient access, clinical trials, pricing practices, and employee well-being.
Driver: Government welfare spending and targeted social programs act as a structural demand driver, with national welfare budgets such as the USD 1.101 trillion allocation in the United States signaling long-term emphasis on social outcomes and accountability. Organizations increasingly commission independent social audits to validate alignment with these policy priorities and reduce compliance risk.
Restraint: High audit costs and limited in-house expertise among small and mid-sized enterprises constrain adoption, with many organizations reporting that full-scope social audits can consume 3 to 5 percent of annual compliance budgets. Fragmented standards across regions also raise implementation complexity and extend audit timelines.
Opportunity: Expansion in mental health programs and telehealth services creates a fast-growing audit niche, particularly in remote and underserved areas. By 2033, audits focused on mental health support systems and digital care channels are expected to represent more than 15 percent of healthcare-related social audit spend.
Trend: Providers increasingly embed analytics, automated data checks, and digital evidence trails into social audit workflows, which can cut audit cycle times by 20 to 30 percent and improve traceability. Leading firms integrate survey data, HR systems, and supply-chain platforms to produce continuous, rather than periodic, social performance assessments.
Regional Analysis: Asia Pacific held roughly 35 percent of global revenue in 2024, led by China and India where rapid industrialization and tighter labor and ESG regulations fuel adoption. North America and Europe together represent just over 50 percent share, but Asia Pacific is expected to post the fastest growth, with CAGRs estimated above 18 percent through 2034.
Type Analysis
Corporate Social Responsibility (CSR) audits remain the core of the social audit services portfolio in 2025. They accounted for around 57.5 percent of audit-type revenues in 2023 and continue to capture the majority of new mandates as boards tighten oversight of human rights, sourcing, and environmental practices. For organizations that report against ESG frameworks or operate in consumer-facing sectors, CSR audits are now a primary tool to validate claims, manage reputational risk, and respond to investor questions on supply-chain integrity.
Social and Quality Management audits form the second key pillar. They link social compliance, ethical behavior, and quality assurance across production and service delivery. These audits help organizations verify that suppliers and internal units align with both regulatory norms and customer specifications, particularly in food, healthcare, and consumer goods. Occupational Health and Fire Safety audits continue to expand as regulators increase inspections and penalties. They focus on incident prevention, emergency preparedness, and adherence to workplace safety codes, which can directly affect insurance costs and employee retention.
Ethical Trading, Social Impact Assessment, and Climatic Change Assessment audits now gain more budget share. Ethical Trading reviews fair wages, working hours, and responsible purchasing practices, which are central to brands that depend on contractor networks. Social Impact and climate-related assessments evaluate how projects affect communities and ecosystems and how operations align with decarbonization targets. The residual “Others” category includes emerging fields such as digital conduct, online harassment, and cyber-related social risk, which are becoming more relevant as operations and workforces move further into digital channels.
Application Analysis
Application-wise, social audit services in 2025 concentrate on three broad use cases. Compliance and regulatory assurance audits account for the largest share, especially in regulated sectors such as healthcare, food, and financial services. These assignments validate adherence to labor laws, safety codes, and environmental regulations and often feed directly into external disclosures or license renewals. For organizations with high compliance exposure, this is typically the first area where social audit budgets grow.
Supply-chain and vendor audits form the second major application cluster. Global brands increasingly request independent assessments of factories, farms, logistics providers, and service partners to manage social risk beyond their direct operations. This segment has grown at an estimated mid- to high-teens CAGR since 2020 as companies expand preferred-supplier programs that require periodic social audit clearance. A third application set focuses on workplace culture and employee well-being, including mental health programs, diversity and inclusion, and grievance mechanisms. In this area, demand is rising for audits that combine policy review with survey data and on-site verification to test how well corporate commitments translate into daily practice.
End-Use Analysis
End-use patterns in 2025 still show Healthcare and Pharmaceuticals as the single largest client group for social audit services. This segment represented roughly 44.2 percent of market revenues in 2023 and continues to scale spending as regulators intensify oversight of patient safety, clinical trials, data privacy, and employee welfare. In this context, social audits help reduce compliance failures, support accreditation, and reassure patients and payers about ethical standards.
Food and Beverage forms the next large cluster of demand. Companies in this sector use social audits to track labor practices in agriculture and processing, verify supplier certifications, and support claims around responsible sourcing. The Oil and Gas industry relies on social audits to manage community relations, environmental-impact expectations, and contractor practices in remote or sensitive locations. In Apparels and Footwear, social audits remain essential for monitoring multi-tier manufacturing networks and avoiding labor-rights controversies that can damage brand equity.
Telecom, Media, and Entertainment, along with a broad mix of “Other” industries, contribute a growing but more fragmented share. Telecom players focus on infrastructure siting, subcontractor conduct, and customer data handling. Media and Entertainment clients request audits related to content production, workplace conduct, and data protection. The “Others” group spans technology, logistics, retail, and professional services, demonstrating that social audit services have moved beyond a niche function and now sit within mainstream risk and ESG budgets across organizational value chains.
Regional Analysis
Regionally, Asia Pacific retains a leading position in the global market. It held around 35 percent share and an estimated value of USD 5.9 billion in the early 2020s and continues to grow faster than the global average as China, India, and Southeast Asian markets strengthen labor and environmental regulation. For companies with supply bases concentrated in this region, social audits have become a standard requirement for export readiness and access to international brands.
North America and Europe together account for slightly more than half of global spending, supported by mature ESG frameworks, mandatory reporting requirements, and strong pressure from investors and civil society. In these regions, social audits are now embedded into enterprise-wide risk management and supplier governance, with recurring contracts rather than one-off assessments. Latin America and the Middle East & Africa represent smaller shares today but register rising activity due to resource projects, infrastructure expansion, and growing expectations around human rights and community impact.
Across all regions, the outlook for 2025 and beyond points to sustained double-digit growth in social audit spending as reporting rules tighten and stakeholders demand verifiable evidence of corporate conduct. For organizations worldwide, this signals a structural shift: social audits are no longer optional reputation tools but core components of compliance, supply-chain management, and ESG strategy.
By Audit Type, Corporate Social Responsibility, Social & Quality Management, Occupational Health & Fire Safety, Ethical Trading, Social Impact Assessment, Climatic Change Assessment, Others, By End Users, Healthcare & Pharmaceuticals, Food & Beverage, Oil & Gas, Apparels & Footwear Industry, Telecom, Media & Entertainment, Others
Research Methodology
Primary Research- 100 Interviews of Stakeholders
Secondary Research
Desk Research
Regional scope
North America (United States, Canada, Mexico)
Latin America (Brazil, Argentina, Columbia)
East Asia And Pacific (China, Japan, South Korea, Australia, Cambodia, Fiji, Indonesia)
Sea And South Asia (India, Singapore, Thailand, Taiwan, Malaysia)
Eastern Europe (Poland, Russia, Czech Republic, Romania)
Western Europe (Germany, U.K., France, Spain, Itlay)
Middle East & Africa (GCC Countries, Egypt, Nigeria, South Africa, Israel)
Competitive Landscape
DQS Cfs, TUV Rheinland, Intertek, HQTS Group Ltd., QIMA, SCS Global Services, SGS Group, CSR Company International, TUV Nord, Bureau
Customization Scope
Customization for segments, region/country-level will be provided. Moreover, additional customization can be done based on the requirements.
Pricing and Purchase Options
Avail customized purchase options to meet your exact research needs. We have three licenses to opt for: Single User License, Multi-User License (Up to 5 Users), Corporate Use License (Unlimited User and Printable PDF).
TABLE OF CONTENTS
1. EXECUTIVE SUMMARY
1.1. MARKET SNAPSHOT
1.2. KEY FINDINGS & INSIGHTS
1.3. ANALYST RECOMMENDATIONS
1.4. FUTURE OUTLOOK
2. RESEARCH METHODOLOGY
2.1. MARKET DEFINITION & SCOPE
2.2. RESEARCH OBJECTIVES: PRIMARY & SECONDARY DATA SOURCES
2.3. DATA COLLECTION SOURCES
2.3.1. COVERAGE OF 100+ PRIMARY RESEARCH/CONSULTATION CALLS WITH INDUSTRY STAKEHOLDERS
FIGURE 17 NORTH AMERICA SOCIAL AUDIT SERVICES CURRENT AND FUTURE TYPE ANALYSIS, 2025–2034, (USD MILLION)
FIGURE 18 NORTH AMERICA SOCIAL AUDIT SERVICES CURRENT AND FUTURE END USER ANALYSIS, 2025–2034, (USD MILLION)
FIGURE 19 MARKET SHARE BY COUNTRY
FIGURE 20 LATIN AMERICA SOCIAL AUDIT SERVICES CURRENT AND FUTURE TYPE ANALYSIS, 2025–2034, (USD MILLION)
FIGURE 21 LATIN AMERICA SOCIAL AUDIT SERVICES CURRENT AND FUTURE END USER ANALYSIS, 2025–2034, (USD MILLION)
FIGURE 22 MARKET SHARE BY COUNTRY
FIGURE 23 EASTERN EUROPE SOCIAL AUDIT SERVICES CURRENT AND FUTURE TYPE ANALYSIS, 2025–2034, (USD MILLION)
FIGURE 24 EASTERN EUROPE SOCIAL AUDIT SERVICES CURRENT AND FUTURE END USER ANALYSIS, 2025–2034, (USD MILLION)
FIGURE 25 MARKET SHARE BY COUNTRY
FIGURE 26 WESTERN EUROPE SOCIAL AUDIT SERVICES CURRENT AND FUTURE TYPE ANALYSIS, 2025–2034, (USD MILLION)
FIGURE 27 WESTERN EUROPE SOCIAL AUDIT SERVICES CURRENT AND FUTURE END USER ANALYSIS, 2025–2034, (USD MILLION)
FIGURE 28 MARKET SHARE BY COUNTRY
FIGURE 29 EAST ASIA AND PACIFIC SOCIAL AUDIT SERVICES CURRENT AND FUTURE TYPE ANALYSIS, 2025–2034, (USD MILLION)
FIGURE 30 EAST ASIA AND PACIFIC SOCIAL AUDIT SERVICES CURRENT AND FUTURE END USER ANALYSIS, 2025–2034, (USD MILLION)
FIGURE 31 MARKET SHARE BY COUNTRY
FIGURE 32 SEA AND SOUTH ASIA SOCIAL AUDIT SERVICES CURRENT AND FUTURE TYPE ANALYSIS, 2025–2034, (USD MILLION)
FIGURE 33 SEA AND SOUTH ASIA SOCIAL AUDIT SERVICES CURRENT AND FUTURE END USER ANALYSIS, 2025–2034, (USD MILLION)
FIGURE 34 MARKET SHARE BY COUNTRY
FIGURE 35 MIDDLE EAST AND AFRICA SOCIAL AUDIT SERVICES CURRENT AND FUTURE TYPE ANALYSIS, 2025–2034, (USD MILLION)
FIGURE 36 MIDDLE EAST AND AFRICA SOCIAL AUDIT SERVICES CURRENT AND FUTURE END USER ANALYSIS, 2025–2034, (USD MILLION)
FIGURE 37 NORTH AMERICA SOCIAL AUDIT SERVICES CURRENT AND FUTURE MARKET VOLUME SHARE REGIONAL ANALYSIS, 2025–2034, (USD MILLION)
FIGURE 38 U.S. SOCIAL AUDIT SERVICES CURRENT AND FUTURE TYPE ANALYSIS, 2025–2034, (USD MILLION)
FIGURE 39 U.S. SOCIAL AUDIT SERVICES CURRENT AND FUTURE END USER ANALYSIS, 2025–2034, (USD MILLION)
FIGURE 40 CANADA SOCIAL AUDIT SERVICES CURRENT AND FUTURE TYPE ANALYSIS, 2025–2034, (USD MILLION)
FIGURE 41 CANADA SOCIAL AUDIT SERVICES CURRENT AND FUTURE END USER ANALYSIS, 2025–2034, (USD MILLION)
FIGURE 42 LATIN AMERICA SOCIAL AUDIT SERVICES CURRENT AND FUTURE MARKET VOLUME SHARE REGIONAL ANALYSIS, 2025–2034, (USD MILLION)
FIGURE 43 MEXICO SOCIAL AUDIT SERVICES CURRENT AND FUTURE TYPE ANALYSIS, 2025–2034, (USD MILLION)
FIGURE 44 MEXICO SOCIAL AUDIT SERVICES CURRENT AND FUTURE END USER ANALYSIS, 2025–2034, (USD MILLION)
FIGURE 45 BRAZIL SOCIAL AUDIT SERVICES CURRENT AND FUTURE TYPE ANALYSIS, 2025–2034, (USD MILLION)
FIGURE 46 BRAZIL SOCIAL AUDIT SERVICES CURRENT AND FUTURE END USER ANALYSIS, 2025–2034, (USD MILLION)
FIGURE 47 ARGENTINA SOCIAL AUDIT SERVICES CURRENT AND FUTURE TYPE ANALYSIS, 2025–2034, (USD MILLION)
FIGURE 48 ARGENTINA SOCIAL AUDIT SERVICES CURRENT AND FUTURE END USER ANALYSIS, 2025–2034, (USD MILLION)
FIGURE 49 COLUMBIA SOCIAL AUDIT SERVICES CURRENT AND FUTURE TYPE ANALYSIS, 2025–2034, (USD MILLION)
FIGURE 50 COLUMBIA SOCIAL AUDIT SERVICES CURRENT AND FUTURE END USER ANALYSIS, 2025–2034, (USD MILLION)
FIGURE 51 REST OF LATIN AMERICA SOCIAL AUDIT SERVICES CURRENT AND FUTURE TYPE ANALYSIS, 2025–2034, (USD MILLION)
FIGURE 52 REST OF LATIN AMERICA SOCIAL AUDIT SERVICES CURRENT AND FUTURE END USER ANALYSIS, 2025–2034, (USD MILLION)
FIGURE 53 EASTERN EUROPE SOCIAL AUDIT SERVICES CURRENT AND FUTURE MARKET VOLUME SHARE REGIONAL ANALYSIS, 2025–2034, (USD MILLION)
FIGURE 54 POLAND SOCIAL AUDIT SERVICES CURRENT AND FUTURE TYPE ANALYSIS, 2025–2034, (USD MILLION)
FIGURE 55 POLAND SOCIAL AUDIT SERVICES CURRENT AND FUTURE END USER ANALYSIS, 2025–2034, (USD MILLION)
FIGURE 56 RUSSIA SOCIAL AUDIT SERVICES CURRENT AND FUTURE TYPE ANALYSIS, 2025–2034, (USD MILLION)
FIGURE 57 RUSSIA SOCIAL AUDIT SERVICES CURRENT AND FUTURE END USER ANALYSIS, 2025–2034, (USD MILLION)
FIGURE 58 CZECH REPUBLIC SOCIAL AUDIT SERVICES CURRENT AND FUTURE TYPE ANALYSIS, 2025–2034, (USD MILLION)
FIGURE 59 CZECH REPUBLIC SOCIAL AUDIT SERVICES CURRENT AND FUTURE END USER ANALYSIS, 2025–2034, (USD MILLION)
FIGURE 60 ROMANIA SOCIAL AUDIT SERVICES CURRENT AND FUTURE TYPE ANALYSIS, 2025–2034, (USD MILLION)
FIGURE 61 ROMANIA SOCIAL AUDIT SERVICES CURRENT AND FUTURE END USER ANALYSIS, 2025–2034, (USD MILLION)
FIGURE 62 REST OF EASTERN EUROPE SOCIAL AUDIT SERVICES CURRENT AND FUTURE TYPE ANALYSIS, 2025–2034, (USD MILLION)
FIGURE 63 REST OF EASTERN EUROPE SOCIAL AUDIT SERVICES CURRENT AND FUTURE END USER ANALYSIS, 2025–2034, (USD MILLION)
FIGURE 64 WESTERN EUROPE SOCIAL AUDIT SERVICES CURRENT AND FUTURE MARKET VOLUME SHARE REGIONAL ANALYSIS, 2025–2034, (USD MILLION)
FIGURE 65 GERMANY SOCIAL AUDIT SERVICES CURRENT AND FUTURE TYPE ANALYSIS, 2025–2034, (USD MILLION)
FIGURE 66 GERMANY SOCIAL AUDIT SERVICES CURRENT AND FUTURE END USER ANALYSIS, 2025–2034, (USD MILLION)
FIGURE 67 FRANCE SOCIAL AUDIT SERVICES CURRENT AND FUTURE TYPE ANALYSIS, 2025–2034, (USD MILLION)
FIGURE 68 FRANCE SOCIAL AUDIT SERVICES CURRENT AND FUTURE END USER ANALYSIS, 2025–2034, (USD MILLION)
FIGURE 69 UK SOCIAL AUDIT SERVICES CURRENT AND FUTURE TYPE ANALYSIS, 2025–2034, (USD MILLION)
FIGURE 70 UK SOCIAL AUDIT SERVICES CURRENT AND FUTURE END USER ANALYSIS, 2025–2034, (USD MILLION)
FIGURE 71 SPAIN SOCIAL AUDIT SERVICES CURRENT AND FUTURE TYPE ANALYSIS, 2025–2034, (USD MILLION)
FIGURE 72 SPAIN SOCIAL AUDIT SERVICES CURRENT AND FUTURE END USER ANALYSIS, 2025–2034, (USD MILLION)
FIGURE 73 ITALY SOCIAL AUDIT SERVICES CURRENT AND FUTURE TYPE ANALYSIS, 2025–2034, (USD MILLION)
FIGURE 74 ITALY SOCIAL AUDIT SERVICES CURRENT AND FUTURE END USER ANALYSIS, 2025–2034, (USD MILLION)
FIGURE 75 REST OF WESTERN EUROPE SOCIAL AUDIT SERVICES CURRENT AND FUTURE TYPE ANALYSIS, 2025–2034, (USD MILLION)
FIGURE 76 REST OF WESTERN EUROPE SOCIAL AUDIT SERVICES CURRENT AND FUTURE END USER ANALYSIS, 2025–2034, (USD MILLION)
FIGURE 77 EAST ASIA AND PACIFIC SOCIAL AUDIT SERVICES CURRENT AND FUTURE MARKET VOLUME SHARE REGIONAL ANALYSIS, 2025–2034, (USD MILLION)
FIGURE 78 CHINA SOCIAL AUDIT SERVICES CURRENT AND FUTURE TYPE ANALYSIS, 2025–2034, (USD MILLION)
FIGURE 79 CHINA SOCIAL AUDIT SERVICES CURRENT AND FUTURE END USER ANALYSIS, 2025–2034, (USD MILLION)
FIGURE 80 JAPAN SOCIAL AUDIT SERVICES CURRENT AND FUTURE TYPE ANALYSIS, 2025–2034, (USD MILLION)
FIGURE 81 JAPAN SOCIAL AUDIT SERVICES CURRENT AND FUTURE END USER ANALYSIS, 2025–2034, (USD MILLION)
FIGURE 82 AUSTRALIA SOCIAL AUDIT SERVICES CURRENT AND FUTURE TYPE ANALYSIS, 2025–2034, (USD MILLION)
FIGURE 83 AUSTRALIA SOCIAL AUDIT SERVICES CURRENT AND FUTURE END USER ANALYSIS, 2025–2034, (USD MILLION)
FIGURE 84 CAMBODIA SOCIAL AUDIT SERVICES CURRENT AND FUTURE TYPE ANALYSIS, 2025–2034, (USD MILLION)
FIGURE 85 CAMBODIA SOCIAL AUDIT SERVICES CURRENT AND FUTURE END USER ANALYSIS, 2025–2034, (USD MILLION)
FIGURE 86 FIJI SOCIAL AUDIT SERVICES CURRENT AND FUTURE TYPE ANALYSIS, 2025–2034, (USD MILLION)
FIGURE 87 FIJI SOCIAL AUDIT SERVICES CURRENT AND FUTURE END USER ANALYSIS, 2025–2034, (USD MILLION)
FIGURE 88 INDONESIA SOCIAL AUDIT SERVICES CURRENT AND FUTURE TYPE ANALYSIS, 2025–2034, (USD MILLION)
FIGURE 89 INDONESIA SOCIAL AUDIT SERVICES CURRENT AND FUTURE END USER ANALYSIS, 2025–2034, (USD MILLION)
FIGURE 90 SOUTH KOREA SOCIAL AUDIT SERVICES CURRENT AND FUTURE TYPE ANALYSIS, 2025–2034, (USD MILLION)
FIGURE 91 SOUTH KOREA SOCIAL AUDIT SERVICES CURRENT AND FUTURE END USER ANALYSIS, 2025–2034, (USD MILLION)
FIGURE 92 REST OF EAST ASIA AND PACIFIC SOCIAL AUDIT SERVICES CURRENT AND FUTURE TYPE ANALYSIS, 2025–2034, (USD MILLION)
FIGURE 93 REST OF EAST ASIA AND PACIFIC SOCIAL AUDIT SERVICES CURRENT AND FUTURE END USER ANALYSIS, 2025–2034, (USD MILLION)
FIGURE 94 SEA AND SOUTH ASIA SOCIAL AUDIT SERVICES CURRENT AND FUTURE MARKET VOLUME SHARE REGIONAL ANALYSIS, 2025–2034, (USD MILLION)
FIGURE 95 BANGLADESH SOCIAL AUDIT SERVICES CURRENT AND FUTURE TYPE ANALYSIS, 2025–2034, (USD MILLION)
FIGURE 96 BANGLADESH SOCIAL AUDIT SERVICES CURRENT AND FUTURE END USER ANALYSIS, 2025–2034, (USD MILLION)
FIGURE 97 NEW ZEALAND SOCIAL AUDIT SERVICES CURRENT AND FUTURE TYPE ANALYSIS, 2025–2034, (USD MILLION)
FIGURE 98 NEW ZEALAND SOCIAL AUDIT SERVICES CURRENT AND FUTURE END USER ANALYSIS, 2025–2034, (USD MILLION)
FIGURE 99 INDIA SOCIAL AUDIT SERVICES CURRENT AND FUTURE TYPE ANALYSIS, 2025–2034, (USD MILLION)
FIGURE 100 INDIA SOCIAL AUDIT SERVICES CURRENT AND FUTURE END USER ANALYSIS, 2025–2034, (USD MILLION)
FIGURE 101 SINGAPORE SOCIAL AUDIT SERVICES CURRENT AND FUTURE TYPE ANALYSIS, 2025–2034, (USD MILLION)
FIGURE 102 SINGAPORE SOCIAL AUDIT SERVICES CURRENT AND FUTURE END USER ANALYSIS, 2025–2034, (USD MILLION)
FIGURE 103 THAILAND SOCIAL AUDIT SERVICES CURRENT AND FUTURE TYPE ANALYSIS, 2025–2034, (USD MILLION)
FIGURE 104 THAILAND SOCIAL AUDIT SERVICES CURRENT AND FUTURE END USER ANALYSIS, 2025–2034, (USD MILLION)
FIGURE 105 TAIWAN SOCIAL AUDIT SERVICES CURRENT AND FUTURE TYPE ANALYSIS, 2025–2034, (USD MILLION)
FIGURE 106 TAIWAN SOCIAL AUDIT SERVICES CURRENT AND FUTURE END USER ANALYSIS, 2025–2034, (USD MILLION)
FIGURE 107 MALAYSIA SOCIAL AUDIT SERVICES CURRENT AND FUTURE TYPE ANALYSIS, 2025–2034, (USD MILLION)
FIGURE 108 MALAYSIA SOCIAL AUDIT SERVICES CURRENT AND FUTURE END USER ANALYSIS, 2025–2034, (USD MILLION)
FIGURE 109 REST OF SEA AND SOUTH ASIA SOCIAL AUDIT SERVICES CURRENT AND FUTURE TYPE ANALYSIS, 2025–2034, (USD MILLION)
FIGURE 110 REST OF SEA AND SOUTH ASIA SOCIAL AUDIT SERVICES CURRENT AND FUTURE END USER ANALYSIS, 2025–2034, (USD MILLION)
FIGURE 111 MIDDLE EAST AND AFRICA SOCIAL AUDIT SERVICES CURRENT AND FUTURE MARKET VOLUME SHARE REGIONAL ANALYSIS, 2025–2034, (USD MILLION)
FIGURE 112 GCC COUNTRIES SOCIAL AUDIT SERVICES CURRENT AND FUTURE TYPE ANALYSIS, 2025–2034, (USD MILLION)
FIGURE 113 GCC COUNTRIES SOCIAL AUDIT SERVICES CURRENT AND FUTURE END USER ANALYSIS, 2025–2034, (USD MILLION)
FIGURE 114 SAUDI ARABIA SOCIAL AUDIT SERVICES CURRENT AND FUTURE TYPE ANALYSIS, 2025–2034, (USD MILLION)
FIGURE 115 SAUDI ARABIA SOCIAL AUDIT SERVICES CURRENT AND FUTURE END USER ANALYSIS, 2025–2034, (USD MILLION)
FIGURE 116 UAE SOCIAL AUDIT SERVICES CURRENT AND FUTURE TYPE ANALYSIS, 2025–2034, (USD MILLION)
FIGURE 117 UAE SOCIAL AUDIT SERVICES CURRENT AND FUTURE END USER ANALYSIS, 2025–2034, (USD MILLION)
FIGURE 118 BAHRAIN SOCIAL AUDIT SERVICES CURRENT AND FUTURE TYPE ANALYSIS, 2025–2034, (USD MILLION)
FIGURE 119 BAHRAIN SOCIAL AUDIT SERVICES CURRENT AND FUTURE END USER ANALYSIS, 2025–2034, (USD MILLION)
FIGURE 120 KUWAIT SOCIAL AUDIT SERVICES CURRENT AND FUTURE TYPE ANALYSIS, 2025–2034, (USD MILLION)
FIGURE 121 KUWAIT SOCIAL AUDIT SERVICES CURRENT AND FUTURE END USER ANALYSIS, 2025–2034, (USD MILLION)
FIGURE 122 OMAN SOCIAL AUDIT SERVICES CURRENT AND FUTURE TYPE ANALYSIS, 2025–2034, (USD MILLION)
FIGURE 123 OMAN SOCIAL AUDIT SERVICES CURRENT AND FUTURE END USER ANALYSIS, 2025–2034, (USD MILLION)
FIGURE 124 QATAR SOCIAL AUDIT SERVICES CURRENT AND FUTURE TYPE ANALYSIS, 2025–2034, (USD MILLION)
FIGURE 125 QATAR SOCIAL AUDIT SERVICES CURRENT AND FUTURE END USER ANALYSIS, 2025–2034, (USD MILLION)
FIGURE 126 EGYPT SOCIAL AUDIT SERVICES CURRENT AND FUTURE TYPE ANALYSIS, 2025–2034, (USD MILLION)
FIGURE 127 EGYPT SOCIAL AUDIT SERVICES CURRENT AND FUTURE END USER ANALYSIS, 2025–2034, (USD MILLION)
FIGURE 128 NIGERIA SOCIAL AUDIT SERVICES CURRENT AND FUTURE TYPE ANALYSIS, 2025–2034, (USD MILLION)
FIGURE 129 NIGERIA SOCIAL AUDIT SERVICES CURRENT AND FUTURE END USER ANALYSIS, 2025–2034, (USD MILLION)
FIGURE 130 SOUTH AFRICA SOCIAL AUDIT SERVICES CURRENT AND FUTURE TYPE ANALYSIS, 2025–2034, (USD MILLION)
FIGURE 131 SOUTH AFRICA SOCIAL AUDIT SERVICES CURRENT AND FUTURE END USER ANALYSIS, 2025–2034, (USD MILLION)
FIGURE 132 ISRAEL SOCIAL AUDIT SERVICES CURRENT AND FUTURE TYPE ANALYSIS, 2025–2034, (USD MILLION)
FIGURE 133 ISRAEL SOCIAL AUDIT SERVICES CURRENT AND FUTURE END USER ANALYSIS, 2025–2034, (USD MILLION)
FIGURE 134 REST OF MEA SOCIAL AUDIT SERVICES CURRENT AND FUTURE TYPE ANALYSIS, 2025–2034, (USD MILLION)
FIGURE 135 REST OF MEA SOCIAL AUDIT SERVICES CURRENT AND FUTURE END USER ANALYSIS, 2025–2034, (USD MILLION)
FIGURE 136 U. S. MARKET SHARE ANALYSIS BY TYPE (2024)
FIGURE 137 U. S. MARKET SHARE ANALYSIS BY END USER (2024)
FIGURE 138 CANADA MARKET SHARE ANALYSIS BY TYPE (2024)
FIGURE 139 CANADA MARKET SHARE ANALYSIS BY END USER (2024)
FIGURE 140 MEXICO MARKET SHARE ANALYSIS BY TYPE (2024)
FIGURE 141 MEXICO MARKET SHARE ANALYSIS BY END USER (2024)
FIGURE 142 CHINA MARKET SHARE ANALYSIS BY TYPE (2024)
FIGURE 143 CHINA MARKET SHARE ANALYSIS BY END USER (2024)
FIGURE 144 JAPAN MARKET SHARE ANALYSIS BY TYPE (2024)
FIGURE 145 JAPAN MARKET SHARE ANALYSIS BY END USER (2024)
FIGURE 146 INDIA MARKET SHARE ANALYSIS BY TYPE (2024)
FIGURE 147 INDIA MARKET SHARE ANALYSIS BY END USER (2024)
FIGURE 148 SOUTH KOREA MARKET SHARE ANALYSIS BY TYPE (2024)
FIGURE 149 SOUTH KOREA MARKET SHARE ANALYSIS BY END USER (2024)
FIGURE 150 SAUDI ARABIA MARKET SHARE ANALYSIS BY TYPE (2024)
FIGURE 151 SAUDI ARABIA MARKET SHARE ANALYSIS BY END USER (2024)
FIGURE 152 UAE MARKET SHARE ANALYSIS BY TYPE (2024)
FIGURE 153 UAE MARKET SHARE ANALYSIS BY END USER (2024)
FIGURE 154 EGYPT MARKET SHARE ANALYSIS BY TYPE (2024)
FIGURE 155 EGYPT MARKET SHARE ANALYSIS BY END USER (2024)
FIGURE 156 NIGERIA MARKET SHARE ANALYSIS BY TYPE (2024)
FIGURE 157 NIGERIA MARKET SHARE ANALYSIS BY END USER (2024)
FIGURE 158 SOUTH AFRICA MARKET SHARE ANALYSIS BY TYPE (2024)
FIGURE 159 SOUTH AFRICA MARKET SHARE ANALYSIS BY END USER (2024)
FIGURE 160 GERMANY MARKET SHARE ANALYSIS BY TYPE (2024)
FIGURE 161 GERMANY MARKET SHARE ANALYSIS BY END USER (2024)
FIGURE 162 FRANCE MARKET SHARE ANALYSIS BY TYPE (2024)
FIGURE 163 FRANCE MARKET SHARE ANALYSIS BY END USER (2024)
FIGURE 164 UK MARKET SHARE ANALYSIS BY TYPE (2024)
FIGURE 165 UK MARKET SHARE ANALYSIS BY END USER (2024)
FIGURE 166 SPAIN MARKET SHARE ANALYSIS BY TYPE (2024)
FIGURE 167 SPAIN MARKET SHARE ANALYSIS BY END USER (2024)
FIGURE 168 ITALY MARKET SHARE ANALYSIS BY TYPE (2024)
FIGURE 169 ITALY MARKET SHARE ANALYSIS BY END USER (2024)
FIGURE 170 BRAZIL MARKET SHARE ANALYSIS BY TYPE (2024)
FIGURE 171 BRAZIL MARKET SHARE ANALYSIS BY END USER (2024)
FIGURE 172 ARGENTINA MARKET SHARE ANALYSIS BY TYPE (2024)
FIGURE 173 ARGENTINA MARKET SHARE ANALYSIS BY END USER (2024)
FIGURE 174 COLUMBIA MARKET SHARE ANALYSIS BY TYPE (2024)
FIGURE 175 COLUMBIA MARKET SHARE ANALYSIS BY END USER (2024)
FIGURE 176 GLOBAL SOCIAL AUDIT SERVICES CURRENT AND FUTURE MARKET KEY COUNTRY LEVEL ANALYSIS, 2024–2034, (USD MILLION)
FIGURE 177 FINANCIAL OVERVIEW:
Key Player Analysis
SGS Group: SGS Group operates as a global leader in the social audit services market. Its portfolio spans social compliance audits, worker welfare assessments, environmental checks, and supply-chain due diligence across more than 100 countries. The company benefits from strong penetration in manufacturing, retail, and consumer goods, where clients require consistent verification of labor and ethical standards. SGS continues to advance its position by integrating digital audit platforms and automated evidence-capture tools that reduce audit cycle times by up to 25 percent. In 2025, the company strengthens its competitive edge through targeted acquisitions in Asia and Europe to expand auditor capacity and sector coverage. Its broad client base and long-standing relationships with multinational brands provide a reliable benchmark for global compliance and reporting consistency.
HQTS Group Ltd.: HQTS Group Ltd. positions itself as a key challenger with strong regional influence across Asia Pacific. The company specializes in social compliance audits, supplier verification, and factory assessments for industries such as apparel, toys, chemicals, and electronics. HQTS scales its operations through investments in training centers and partnerships with regional regulators to align audit protocols to new ESG and labor-law requirements. In 2025, the company deepens its use of AI-enabled inspection tools and digital reporting systems that support high-volume supplier audits for global sourcing teams. HQTS differentiates itself through rapid turnaround times and strong familiarity with China’s manufacturing ecosystem. This provides a clear advantage for enterprises that depend on complex Asia-based supply chains requiring frequent audit cycles.
CSR Company International: CSR Company International operates as a niche player with a specialized focus on corporate responsibility strategy, ISO 26000 compliance support, and social-impact assessment. Its strength lies in advisory-led audit engagements that help organizations integrate sustainability and ethical governance into long-term planning. In 2025, the company expands its service line by developing digital measurement frameworks that quantify community impact and track the performance of well-being and inclusion programs. It also partners with universities and NGOs to strengthen research-driven audit methodologies. The firm’s deep expertise in CSR governance makes it a preferred choice for clients seeking structured guidance rather than high-volume compliance audits. For organizations that need tailored assessments and policy development, CSR Company International offers targeted capabilities that complement broader audit portfolios.
Market Key players
DQS Cfs
TUV Rheinland
Intertek
HQTS Group Ltd.
QIMA
SCS Global Services
SGS Group
CSR Company International
TUV Nord
Bureau
Driver
Rising Scrutiny on Workforce Well-Being and Social Outcomes
By 2025, organizations in both public and private sectors will face increased scrutiny about employee well-being, workplace safety, and community impact. Mental health has become a vital area of focus. Employers are expanding counseling, wellness, and psychosocial support programs to meet regulatory guidelines and workforce expectations. Governments and regulators are also tightening oversight of psychological safety standards, especially in healthcare, education, and high-risk fields. This situation is making independent social audits more necessary to check compliance, evaluate program effectiveness, and document responsible employment practices.
Aging Population and Expanding Social Support Programs
Demographic changes are boosting this demand. The rapid growth of the elderly population is raising expectations regarding quality of care, long-term support services, and community health programs. Care providers increasingly use social audits to show compliance with care protocols, obtain public funding, and keep their accreditation. Meanwhile, governments are increasing budgets for social welfare and community development by 5–8% annually in several regions. These investments call for regular reporting, outcome validation, and third-party oversight, making social audit services a crucial mechanism for governance and accountability.
Restraint
Budget Constraints Limiting Audit Scope and Frequency
Financial pressure remains a major barrier to broader social audit use in 2025. Many organizations are working with steady or shrinking compliance and governance budgets as regulatory demands continue to grow. Comprehensive social audits can take up 3–5% of annual compliance spending. This prompts smaller organizations and non-profits to trim audit scope, postpone assessments, or focus only on required reviews. This budget sensitivity limits market reach, particularly among small and medium-sized enterprises and community organizations.
Shortage of Qualified Social Audit Professionals
Capacity issues also hold back market growth. The number of trained and certified social audit professionals is not keeping up with increasing demand, with vacancy rates over 20% in some areas. This talent shortage extends audit timelines, raises service costs, and hampers providers' ability to scale quickly. For clients, delays in completing audits create compliance risks and reporting gaps, highlighting a disconnect between regulatory goals and operational capacity.
Opportunity
Telehealth Expansion Driving New Audit Requirements
The fast growth of telehealth and digital service delivery is creating major opportunities for social audit providers. Health systems, NGOs, and community agencies are offering more counseling, monitoring, and support services online, especially in remote and underserved areas. As telehealth adoption grows by 12–15% annually in several markets, organizations need specialized audits to evaluate service quality, data privacy, accessibility, and user experience. This shift is generating ongoing demand for digital-first social audit frameworks.
Outcome-Based Funding and Impact Investment Models
Another growth area comes from outcome-based funding systems, including social impact bonds and results-linked public funding. These models draw private and institutional investment into preventive care, education, and community programs but require thorough third-party audits to confirm performance metrics. As governments and investors increasingly link funding to measurable social outcomes, the need for continuous monitoring, impact verification, and long-term audits is likely to rise, creating lasting, contract-based opportunities for audit providers.
Trend
Digitalization and Automation of Social Audit Processes
Digital transformation is changing how social audits are conducted in 2025. Audit teams are using online platforms, mobile data-collection tools, and automated compliance checks to work more efficiently. These technologies can cut manual workloads and shorten audit cycles by 20–30% while improving documentation quality and traceability. Digital audit trails also enhance regulatory reporting and allow for real-time risk detection, increasing value for clients and regulators.
Participatory Audits and DEI-Focused Assessments
At the same time, social audits are becoming more inclusive and values-driven. Community feedback, worker surveys, and digital reporting channels are broadening the evidence base beyond standard documentation reviews. Diversity, equity, and inclusion (DEI) standards are increasingly incorporated into audit frameworks, requiring assessments of how policies impact actual workplace experiences. Together, these trends are pushing social auditing toward more transparent, data-driven, and inclusive models that align with changing ESG and governance expectations.
Recent Developments
Dec 2024 - QIMA / amfori BEPI: amfori BEPI expanded its monitoring partner network to include QIMA, adding significant social and ethical auditing capacity for global supply chains. This move strengthens QIMA’s role in social compliance audits and gives sourcing operations wider access to third-party verification in high-risk categories.
Dec 2024 - TÜV Rheinland: TÜV Rheinland announced a collaboration with Crif D&B in Vietnam to deliver integrated ESG and CBAM-focused solutions for exporters and manufacturers, targeting companies exposed to EU climate and supply-chain rules. The partnership positions TÜV Rheinland as a key social and ESG audit partner for Asia-based suppliers that need to align with tightening European due diligence requirements.
Jan 2025 - SGS: SGS completed the acquisition of Aster Global Environmental Solutions in the United States, adding specialist verification services for greenhouse gas emissions, forestry projects, and corporate responsibility programs. The deal expands SGS’s ESG and social audit portfolio in North America and provides access to a broader mix of climate and social-impact assurance within a single provider.
Jan 2025 - Bureau Veritas / SGS / Intertek: Bureau Veritas entered advanced negotiations for a proposed €31 billion merger with SGS, after ending earlier talks with Intertek, aiming to create a combined group with close to 8 percent share of the global testing, inspection, and certification market and targeted annual cost savings above €400 million. If the transaction proceeds, it will reshape the competitive landscape in ESG and social auditing, concentrating scale and expertise in fewer global platforms that can service multi-country audit programs.
Apr 2025 - Intertek: Intertek launched an integrated service suite to help companies comply with the EU Deforestation Regulation, combining supply-chain due diligence, traceability checks, and field audits for key commodities. With the regulation carrying potential penalties of up to 4 percent of EU revenue, this solution strengthens Intertek’s position as a preferred social and environmental audit partner for brands that must prove deforestation-free and socially compliant sourcing.
Oct 2025 - EcoVadis / SGS / QIMA: EcoVadis expanded its partner network by appointing SGS and QIMA as key audit partners and, in parallel, SGS became an accredited EcoVadis auditing partner, adding a network of more than 800 auditors to support ESG and social compliance assessments worldwide. This alliance links ratings, on-site social audits, and remediation tracking, creating an integrated offering that can scale ESG and social auditing across global supplier bases.