
- Home
- Industries
 Aerospace And Defence
 Agriculture
 Automotive And Transportation
 Banking And Finance
 Business
 Chemicals And Materials
 Consumer And Retail
 Electronics And Semiconductors
 Food And Beverages
 Machinery & Equipments
 Manufacturing And Construction
 Medical Devices
 Others
 Pharmaceuticals And Healthcare
 Power And Energy
 Sports
 Technology
- Services
- News Room
- About us
- Contact Us
-
Solar Panel Coatings Market Size, Growth & Trends 2034 | 22.1% CAGR
Global Solar Panel Coatings Market Market Size, Share, Analysis Report By Type (Hydrophobic, Anti-soiling, Anti-reflective, Self-cleaning, Anti-abrasion, Others), Application (CSP, Solar Roof Tiles, Photovoltaic Cells, Solar Thermal Panels), Material, End-user (Commercial, Agriculture, Residential, Energy, Automotive), Region and Key Players - Industry Segment Overview, Market Dynamics, Competitive Strategies, Trends and Forecast 2025-2034

Report Overview
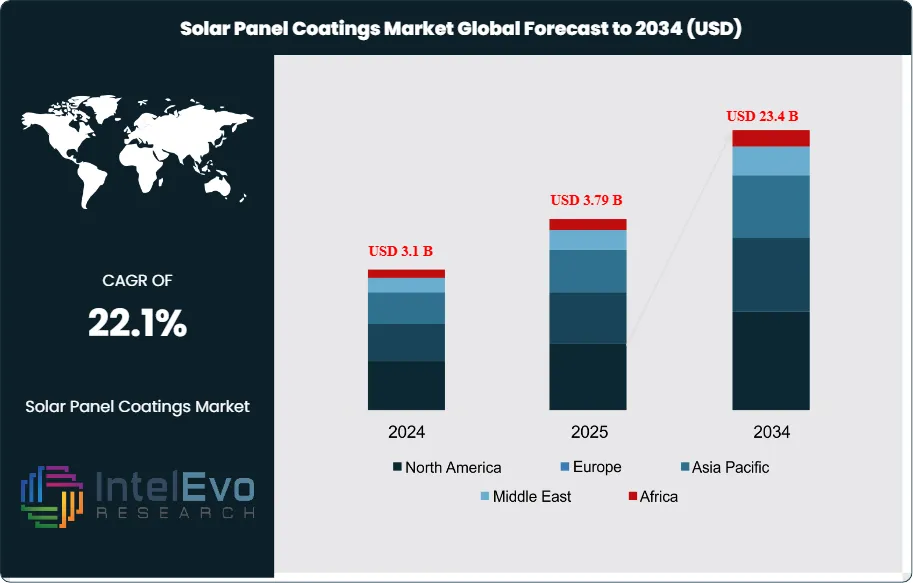
The Solar Panel Coatings Market size is projected to reach USD 23.4 billion by 2034, up from USD 3.1 billion in 2024, growing at a CAGR of 22.1% during the forecast period (2025–2034). The demand for solar panel coatings is surging due to increasing investments in solar energy infrastructure, the rising focus on efficiency enhancement, and global initiatives toward clean energy adoption. As innovations in nanotechnology and hydrophobic coatings accelerate, the market is set to witness exponential growth across residential, commercial, and utility-scale applications.
Get More Information about this report -
Request Free Sample ReportSolar panel coating is a specialized layer applied to the surface of solar panels to improve their efficiency, durability, and overall performance. These coatings serve various functions, such as reducing the reflection of sunlight, allowing more light to be absorbed for energy conversion. Anti-reflective coatings are commonly used for this purpose. Additionally, hydrophobic or self-cleaning coatings help repel water and dust, ensuring that the panel surface remains clean and operational with minimal maintenance. In dusty or polluted environments, anti-soiling coatings are particularly beneficial as they prevent dirt accumulation that could hinder energy generation. Some coatings also offer protection against ultraviolet (UV) radiation and scratches, extending the lifespan of the panels. Overall, solar panel coatings play a crucial role in enhancing the productivity and resilience of solar energy systems, especially in challenging environmental conditions.
Solar panel coatings are gaining importance as solar energy adoption increases globally. These coatings serve a crucial function: they protect the panels from environmental damage while enhancing their efficiency by improving light absorption and reducing reflection. As the demand for renewable energy rises, manufacturers are focusing more on advanced coatings that can withstand harsh weather conditions, repel dust and dirt, and even self-clean. The growth of this market is being shaped by a few key factors. First, governments around the world are promoting clean energy through subsidies and regulatory support, pushing both consumers and industries to shift to solar power. This shift fuels the need for better-performing, long-lasting panels—something coatings help achieve. Second, advancements in material science, especially in nano-technology, are leading to the development of innovative coatings that improve energy conversion efficiency and reduce maintenance costs.
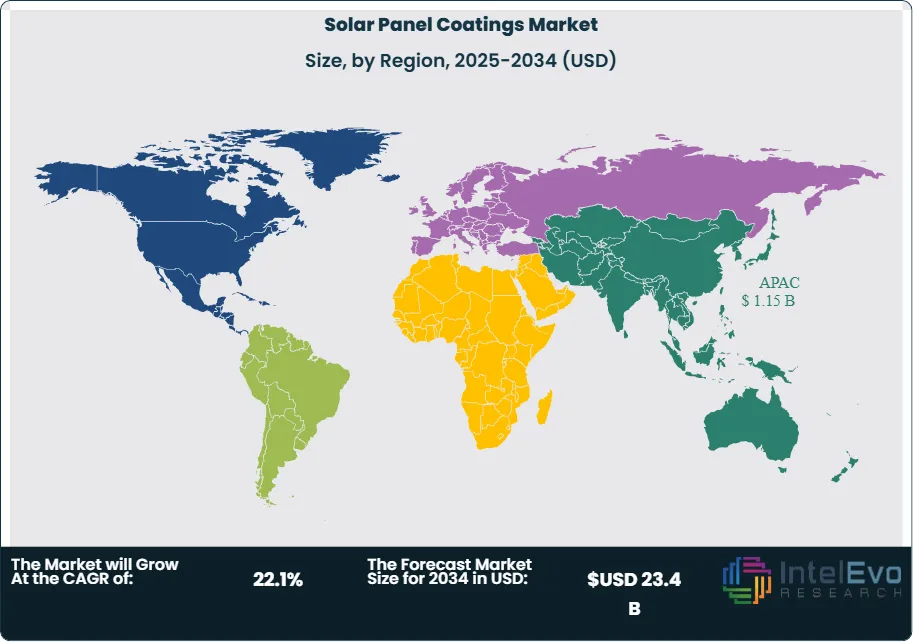
The Asia-Pacific region plays a pivotal role in the growth of the solar panel coatings market due to its rapid expansion of solar energy infrastructure. Countries like China, India, Japan, and South Korea are investing heavily in renewable energy to meet rising electricity demand and reduce carbon emissions. These investments drive the need for more efficient and durable solar panels, boosting demand for advanced coating solutions.
The COVID-19 pandemic had a temporary but notable impact on the solar panel coatings market. Disruptions in global supply chains, labor shortages, and lockdown restrictions slowed the production and installation of solar panels, which in turn affected the demand for coatings. Many infrastructure and renewable energy projects faced delays or were put on hold due to economic uncertainty and shifting government priorities. However, the long-term outlook remains positive. As countries began focusing on sustainable recovery plans, investment in renewable energy—including solar power—resumed with greater momentum.
, Application (CSP, Solar Roof Tiles, Photovoltaic Cells, Solar Thermal Panels), Material, End-user (Commercial, Agriculture, Residential, Energy, Automotive), Region and Key Players - Industry Segment Overview, Market Dynamics, Competitive Strategies, Trends and Forecast 2025-2034")
Key Takeaways
- Market Growth: The solar panel coatings market is expected to reach USD 23.4 billion by 2034, growing at a robust CAGR of 22.1%, indicating strong market expansion.
- Type Segment Dominance: The type segment is dominated by anti-reflective, accounting for over 24% of the market share. Anti-reflective coatings are crucial for solar panels as they reduce light reflection and increase light absorption, boosting energy efficiency. This leads to higher energy output, particularly in areas with less direct sunlight, enhancing solar panel performance and making solar energy more viable.
- Application Segment Insights: The significant market share of Photovoltaic Cells (PV) in solar panel technology highlights their key role in improving the efficiency of Anti-reflective coatings (AR coatings). These coatings minimize light reflection and enhance light absorption, increasing the overall energy generation from sunlight and boosting the performance of solar panels.
- Driver: A key driver for the solar panel coatings market is the rising adoption of solar energy due to increasing demand for clean, renewable power. Coatings improve panel efficiency and durability by reducing reflection, repelling dust, and protecting against harsh weather, making solar energy more viable and cost-effective across various regions.
- Restraint: One major restraint in the solar panel coatings market is the high cost of advanced coating technologies. These specialized coatings, while enhancing performance, often require complex manufacturing processes and materials, which can increase overall production costs—posing challenges for widespread adoption, especially in price-sensitive markets.
- Opportunity: The solar panel coatings market offers strong growth potential due to rising solar energy adoption. Innovations like self-cleaning and anti-reflective coatings improve efficiency and reduce maintenance, creating new opportunities for manufacturers and investors.
- Trend: The adoption of self-cleaning coatings is a key trend in the solar panel coatings market. These coatings minimize the need for frequent maintenance by preventing dust and debris buildup on solar panels, thereby boosting their efficiency and ensuring consistent performance. This trend is especially valuable in regions with high dust accumulation, as it helps maintain optimal energy production without the need for regular cleaning.
- Regional Analysis: Asia-Pacific leads the solar panel coatings market due to rapid solar energy expansion, especially in China and India. Government support, large-scale installations, and harsh environmental conditions drive demand for advanced coatings like anti-reflective and self-cleaning types. Local innovation and strong manufacturing capabilities further fuel market growth in the region.
Type Analysis:
The type segment is divided into hydrophobic, anti-soiling, anti-reflective, self-cleaning, anti-abrasion, and others. The anti-reflective segment dominated the market, with a market share of around 24% accounting for 0.6 billion 2024. Anti-reflective coatings are highly valued in the solar panel industry due to their ability to reduce light reflection and maximize light absorption. By minimizing the amount of sunlight that is reflected off the surface of the solar panel, more sunlight is captured, improving the overall energy efficiency of the panel. This results in higher energy output and better performance, particularly in areas with less direct sunlight or variable weather conditions. As a result, anti-reflective coatings play a crucial role in enhancing the performance and economic viability of solar energy systems, making them a key technology in the growth of the renewable energy sector.
Application Analysis:
The application segment is divided into concentrated solar power (CSP), solar roof tiles, photovoltaic cells (PV), solar thermal panels, and others. The photovoltaic cells (PV) segment dominated the market, with a market share of around 28% accounting for 0.7 billion 2024. The widespread use of photovoltaic (PV) cells in solar panels for generating electricity from sunlight is significantly boosted by the application of advanced coatings. These coatings, such as anti-reflective (AR) coatings, play a vital role in improving the overall efficiency of solar panels. Without such coatings, a portion of the sunlight that hits the panel is reflected away, reducing the amount of light available for conversion into electricity. Advanced coatings, particularly AR coatings, reduce this reflection and allow more light to be absorbed by the PV cells. This leads to an increase in the amount of solar energy captured, enhancing the efficiency of the panel. As a result, the efficiency improvements provided by these coatings make solar energy generation more effective, contributing to the growing use of solar technology in various applications, from residential solar panels to large-scale solar power plants.
Material Analysis:
The material segment is divided into titanium dioxide (TiO2) coatings, ceramic coatings, silica-based coatings, and fluoropolymer coatings. The silica-based coatings segment dominated the market, with a market share of around 33% accounting for 0.9 billion 2024. Silica-based coatings are highly valued for their anti-reflective properties, which significantly boost the performance of solar panels. By reducing the amount of sunlight that is reflected off the surface of the panel, lighter is absorbed into the photovoltaic cells. This increases the amount of energy that can be converted from sunlight into electricity, thereby enhancing the overall efficiency of the solar panel. As a result, solar panels with anti-reflective coatings are more effective at harnessing solar energy, making them a preferred choice in the renewable energy sector.
End-user Analysis:
The end-user segment is divided into commercial, agriculture, residential, energy, automotive, and others. The commercial segment dominated the market, with a market share of around 21% accounting for 0.5 billion 2024. The substantial market share highlights the growing use of solar technologies in commercial buildings, where improving energy efficiency and meeting sustainability goals are top priorities. Solar panel coatings play a crucial role in these settings by boosting panel performance and longevity. They help commercial facilities lower electricity costs and reduce environmental impact, making them an attractive solution for businesses aiming to operate more sustainably.
Region Analysis:
Asia-Pacific Leads With 37% Market Share in the Solar Panel Coatings Market, The Asia-Pacific region plays a pivotal role in the growth of the solar panel coatings market due to its rapid expansion of solar energy infrastructure. China, as the world’s largest solar panel manufacturer and installer, significantly contributes to the demand for high-performance coatings that enhance energy output and reduce maintenance costs. In India, government initiatives such as the National Solar Mission support large-scale solar deployments, encouraging the adoption of coatings that can withstand dust, heat, and humidity—common environmental challenges in the region. Additionally, the region benefits from a strong manufacturing base and ongoing advancements in nanotechnology and material sciences. Local companies and research institutions are developing innovative coating materials, such as anti-reflective and self-cleaning coatings, to improve solar panel efficiency in diverse climatic conditions. In summary, Asia-Pacific’s combination of large-scale solar expansion, favorable government policies, and technological innovation makes it a key driver in the global solar panel coatings market.
Get More Information about this report -
Request Free Sample ReportKey Market Segment
By Type
- Hydrophobic Coatings
- Anti-Reflective Coatings
- Anti-Soiling Coatings
- Self-Cleaning Coatings
- Anti-abrasion
- Conductive Coatings
- Others (UV Protection, Scratch Resistant, etc.)
By Material Type
- Titanium Dioxide (TiO2)
- Silicon Dioxide (SiO2)
- Fluoropolymers
- Polysiloxanes
- Nanomaterials
- Others
By Application
- Monocrystalline Solar Panels
- Polycrystalline Solar Panels
- Thin Film Solar Panels
- Perovskite Solar Cells
- Concentrated Solar Power (CSP)
- Others
By End User
- Residential
- Commercial
- Industrial
- Utility-Scale Power Plants
- Agriculture
- Automotive
- Others
By Region
- North America
- Latin America
- East Asia And Pacific
- Sea And South Asia
- Eastern Europe
- Western Europe
- Middle East & Africa
| Report Attribute | Details |
| Market size (2025) | USD 3.79 B |
| Forecast Revenue (2034) | USD 23.4 B |
| CAGR (2025-2034) | 22.1% |
| Historical data | 2018-2023 |
| Base Year For Estimation | 2024 |
| Forecast Period | 2025-2034 |
| Report coverage | Revenue Forecast, Competitive Landscape, Market Dynamics, Growth Factors, Trends and Recent Developments |
| Segments covered | By Type (Hydrophobic Coatings, Anti-Reflective Coatings, Anti-Soiling Coatings, Self-Cleaning Coatings, Anti-abrasion, Conductive Coatings, Others (UV Protection, Scratch Resistant, etc.)), By Material Type (Titanium Dioxide (TiO2), Silicon Dioxide (SiO2), Fluoropolymers, Polysiloxanes, Nanomaterials, Others), By Application (Monocrystalline Solar Panels, Polycrystalline Solar Panels, Thin Film Solar Panels, Perovskite Solar Cells, Concentrated Solar Power (CSP), Others), By End User (Residential, Commercial, Industrial, Utility-Scale Power Plants, Agriculture, Automotive, Others) |
| Research Methodology |
|
| Regional scope |
|
| Competitive Landscape | Advanced Nanotech Lab, Diamon-Fusion International Inc., Element 119, Koninklijke DSM N.V., Optitune Oy, Sinovoltaics Group, Unelko Corporation, Arkema Group, DSM, FENZI S.p.A., NanoTech Types Pty. Ltd., PPG Industries Inc., Solar Sharc, 3M, ZSD, BASF SE, Kansai Paint Co. Ltd, Nanopool GmbH, Akzo Nobel N.V. |
| Customization Scope | Customization for segments, region/country-level will be provided. Moreover, additional customization can be done based on the requirements. |
| Pricing and Purchase Options | Avail customized purchase options to meet your exact research needs. We have three licenses to opt for: Single User License, Multi-User License (Up to 5 Users), Corporate Use License (Unlimited User and Printable PDF). |
, Application (CSP, Solar Roof Tiles, Photovoltaic Cells, Solar Thermal Panels), Material, End-user (Commercial, Agriculture, Residential, Energy, Automotive), Region and Key Players - Industry Segment Overview, Market Dynamics, Competitive Strategies, Trends and Forecast 2025-2034")
, Application (CSP, Solar Roof Tiles, Photovoltaic Cells, Solar Thermal Panels), Material, End-user (Commercial, Agriculture, Residential, Energy, Automotive), Region and Key Players - Industry Segment Overview, Market Dynamics, Competitive Strategies, Trends and Forecast 2025-2034")
, Application (CSP, Solar Roof Tiles, Photovoltaic Cells, Solar Thermal Panels), Material, End-user (Commercial, Agriculture, Residential, Energy, Automotive), Region and Key Players - Industry Segment Overview, Market Dynamics, Competitive Strategies, Trends and Forecast 2025-2034")

Select Licence Type
Connect with our sales team
Why IntelEvoResearch
100%
Customer
Satisfaction
24x7+
Availability - we are always
there when you need us
200+
Fortune 50 Companies trust
IntelEvoResearch
80%
of our reports are exclusive
and first in the industry
100%
more data
and analysis
1000+
reports published
till date
