Global Solar-to-Hydrogen Power Conversion Market Size, Share, Analysis Report By Technology Type(Photovoltaic (PV) Systems, Electrolyzers, Solar Thermal Systems, Hybrid Systems), End-User(Industrial, Transportation, Power Generation, Residential and Commercial Applications),Production Method(Photocatalytic Water Splitting, Photoelectrochemical Water Splitting, Thermochemical Water Splitting), Region and Key Players - Industry Segment Overview, Market Dynamics, Competitive Strategies, Trends and Forecast 2025-2034
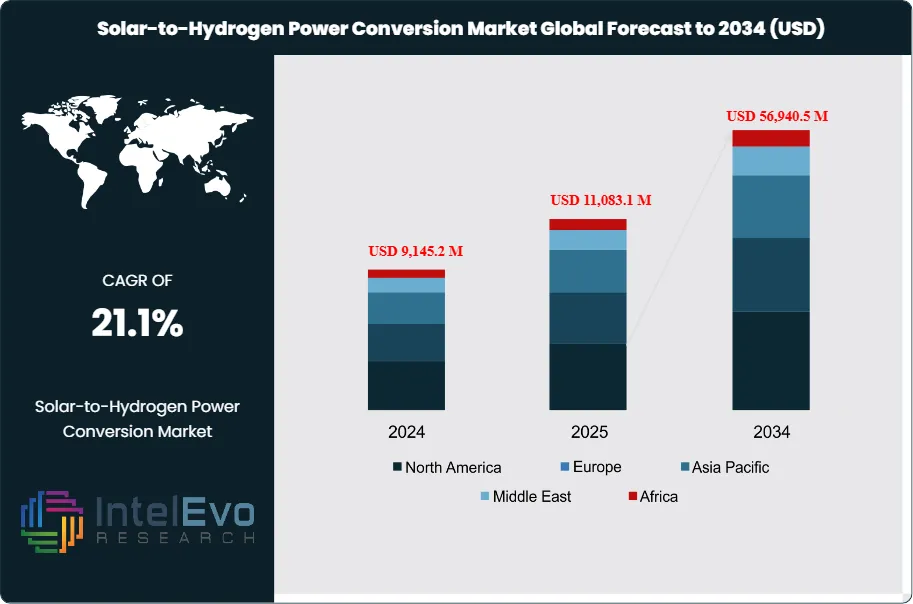
The Global Solar-to-Hydrogen Power Conversion Market size is expected to be worth around USD 56,940.5 million by 2034, up from approximately USD 9,145.2 million in 2024, growing at a CAGR of 21.19% during the forecast period from 2025 to 2034. This rapid growth is fueled by increasing global investments in green hydrogen, government-backed decarbonization targets, and the urgent demand for sustainable energy storage solutions. As solar-to-hydrogen technologies mature, they are set to transform the renewable energy landscape, reduce carbon footprints, and create lucrative opportunities for energy innovators worldwide.
The Global Solar-to-Hydrogen Power Conversion Market refers to the innovative technologies that convert solar energy into hydrogen fuel, presenting a viable alternative to fossil fuels. The market dynamics are influenced by the increasing demand for clean energy solutions and the need for sustainable fuel sources. The current market is characterized by a growing interest from both governments and private sectors in hydrogen as a clean energy carrier, driven by various initiatives to reduce carbon emissions. Technological advancements in photovoltaic cells and electrolyzers are enhancing efficiency and reducing costs associated with solar-to-hydrogen conversion processes.
The growth dynamics of the solar-to-hydrogen market are promising, propelled by several key drivers. Firstly, the rising global focus on decarbonization and renewable energy adoption is accelerating investments in hydrogen technologies. Governments worldwide are implementing policies and regulations that incentivize the use of green hydrogen, further stimulating market growth. Additionally, the decreasing costs of solar energy generation and advancements in electrolyzer technologies enhance the economic feasibility of solar-to-hydrogen systems. Furthermore, the increasing awareness of energy security and the need for diversified energy sources are expected to contribute significantly to market expansion.
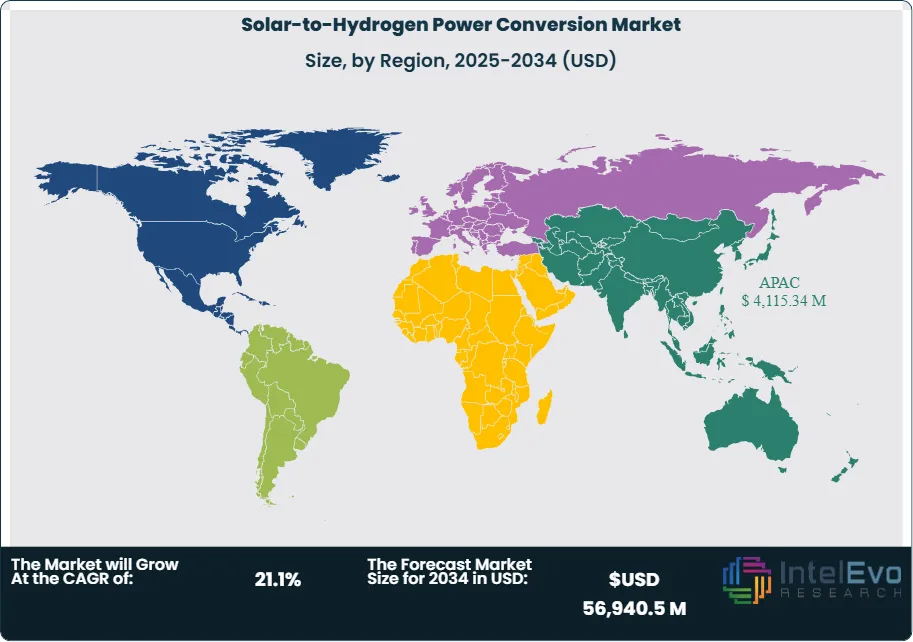
Regionally, Asia-Pacific is anticipated to dominate the solar-to-hydrogen market due to its vast solar energy potential and government support for hydrogen projects. Countries like China, Japan, and India are investing heavily in hydrogen infrastructure to meet their energy demands and combat pollution. North America and Europe are also emerging as significant markets, driven by ambitious climate targets and advancements in hydrogen technologies. In Europe, countries like Germany and the Netherlands are leading in hydrogen initiatives, focusing on integrating hydrogen into their energy systems. The competitive landscape is marked by collaborations among key players aiming to develop efficient solar-to-hydrogen solutions and establish a robust supply chain.
The COVID-19 pandemic has had mixed effects on the solar-to-hydrogen market. Initially, it disrupted supply chains and delayed projects, impacting growth. However, as economies recover, there is a renewed focus on sustainable energy solutions. The pandemic highlighted the vulnerabilities of fossil fuel dependence and accelerated the transition to renewable energy sources, including hydrogen. Governments are likely to prioritize investments in clean technologies as part of their recovery plans, thus positively influencing the market in the long term.
Key Takeaways:
Market Growth: The solar-to-hydrogen power conversion market is projected to reach USD 56,940.5 million by 2034, growing at a robust CAGR of 21.19%, indicating significant market expansion driven by technological advancements and increasing demand for clean energy.
Technology Type Analysis: Electrolyzers are expected to lead the technology segment, primarily due to advancements in Proton Exchange Membrane (PEM) and alkaline technologies. Their efficiency and decreasing costs are making them increasingly attractive for large-scale hydrogen production.
End-User Application Preference: The industrial sector will likely hold the largest share in the solar-to-hydrogen market. Applications in chemicals and refining are driving demand, as industries seek sustainable energy sources to meet regulatory requirements and reduce carbon footprints.
Driver: The primary driver of market growth is the increasing global focus on decarbonization and the transition to renewable energy sources. Government initiatives promoting hydrogen as a clean energy carrier are further accelerating investments in this sector.
Restraint: High initial costs associated with solar-to-hydrogen technology deployment pose a significant restraint. Additionally, the lack of established infrastructure for hydrogen distribution and storage can hinder widespread adoption in the short term.
Opportunity: The increasing investments in hydrogen infrastructure, particularly in developing regions, present significant growth opportunities. Collaborations between governments and private sectors to advance hydrogen technologies can create new markets and applications.
Trend: A notable trend is the growing interest in hybrid systems combining solar power with other renewable sources, enhancing the overall efficiency and reliability of hydrogen production.
Regional Analysis: Asia-Pacific is expected to dominate the market, driven by significant investments in solar energy and hydrogen infrastructure, particularly in countries like China and Japan, which are leading hydrogen initiatives.
Technology Type:
The technology segment is crucial in determining the efficiency and cost-effectiveness of solar-to-hydrogen power conversion systems. It includes Photovoltaic (PV) Systems, Electrolyzers, Solar Thermal Systems, and Hybrid Systems. Electrolyzers, especially Proton Exchange Membrane (PEM) and alkaline types, are expected to dominate due to their efficiency and declining costs. PV systems are essential for harnessing solar energy, while solar thermal systems convert solar heat into hydrogen. Hybrid systems, combining multiple technologies, enhance overall efficiency and reliability. This diversity in technologies allows for tailored solutions across various applications, making the market dynamic and adaptable to different energy needs.
End-User Application:
The end-user application segment is diverse, encompassing Industrial, Transportation, Power Generation, and Residential and Commercial Applications. The industrial sector is anticipated to hold the largest share, driven by demand for hydrogen in chemicals and refining processes. Transportation applications, particularly hydrogen fuel cells, are gaining traction as the automotive industry shifts toward cleaner energy. Power generation uses hydrogen as a fuel source, contributing to grid stability and energy storage. Additionally, residential and commercial applications focus on energy self-sufficiency and reduced carbon footprints. This broad range of applications showcases hydrogen's versatility as a clean energy solution across multiple sectors.
Production Method:
The production method segment includes Photocatalytic Water Splitting, Photoelectrochemical Water Splitting, and Thermochemical Water Splitting. Photocatalytic water splitting uses sunlight to drive chemical reactions, producing hydrogen from water. Photoelectrochemical methods combine solar energy and electrochemistry to split water molecules efficiently. Thermochemical water splitting employs high-temperature processes to generate hydrogen, offering a different approach to hydrogen production. Each method has its advantages, and ongoing research aims to enhance efficiency and reduce costs, making hydrogen production more sustainable. The choice of production method can significantly influence the overall economics and scalability of solar-to-hydrogen conversion technologies.
Region Analysis:
Asia-Pacific Dominates with 45% Market Share in the Solar-to-Hydrogen Power Conversion Market: Asia-Pacific holds the largest market share in the solar-to-hydrogen power conversion market, accounting for approximately 45%. Key factors contributing to this dominance include substantial investments from governments, technological advancements, and a favorable policy framework promoting renewable energy. Countries like China and Japan are leading the charge, with ambitious hydrogen production targets and extensive research initiatives. The region's growing focus on energy security, coupled with the need to reduce carbon emissions, is further driving demand. Additionally, the presence of numerous manufacturers and innovative startups enhances the competitive landscape, making Asia-Pacific a pivotal hub for solar-to-hydrogen technologies.
North America is the fastest-growing region in the solar-to-hydrogen power conversion market, with a projected CAGR of 23% over the next decade. This growth is fueled by increasing government support for clean energy initiatives, including substantial funding for hydrogen infrastructure and research. The U.S. has launched various programs aimed at scaling up hydrogen production and utilization, particularly in transportation and industry. In Europe, stringent regulations and commitments to carbon neutrality are propelling investment in hydrogen technologies, while Latin America explores its vast renewable resources for hydrogen generation. Meanwhile, the Middle East and Africa are recognizing hydrogen's potential to diversify energy sources, attracting foreign investments and collaborative projects. Together, these regions contribute to a dynamic global landscape for solar-to-hydrogen power conversion technologies.
By Technology (Photoelectrochemical (PEC) Cells, Photocatalysis, Solar Thermochemical Hydrogen (STCH), Hybrid Systems), By Component (Solar PV Modules, Electrolyzers (PEM, Alkaline, Solid Oxide), Catalysts & Reactors, Balance of Plant (BoP)), By Application (Power Generation & Storage, Industrial Applications (Steel, Cement, Chemicals), Transportation (Fuel Cell Vehicles, Aviation, Shipping), Residential & Commercial Uses), By End User (Utilities, Industrial Manufacturers, Transportation & Mobility Providers, Government & Municipal Projects), By Technology (Photoelectrochemical (PEC) Cells, Photocatalysis, Solar Thermochemical Hydrogen (STCH), Hybrid Systems)
Research Methodology
Primary Research- 100 Interviews of Stakeholders
Secondary Research
Desk Research
Regional scope
North America (United States, Canada, Mexico)
Latin America (Brazil, Argentina, Columbia)
East Asia And Pacific (China, Japan, South Korea, Australia, Cambodia, Fiji, Indonesia)
Sea And South Asia (India, Singapore, Thailand, Taiwan, Malaysia)
Eastern Europe (Poland, Russia, Czech Republic, Romania)
Western Europe (Germany, U.K., France, Spain, Itlay)
Middle East & Africa (GCC Countries, Egypt, Nigeria, South Africa, Israel)
Competitive Landscape
Nel ASA, ITM Power, Siemens AG, Air Products and Chemicals Inc., Linde plc, Plug Power Inc., Hydrogenics Corporation (a Cummins Inc. company), Sonnen GmbH, Ballard Power Systems Inc., Green Hydrogen Systems A/S, McPhy Energy S.A., H2V Industry, Enel Green Power S.p.A., Thyssenkrupp AG, Toshiba Energy Systems & Solutions Corporation, Toyota Tsusho Corporation, Shell Hydrogen, Haldor Topsoe A/S, Revolution Energy, Ceres Media Ltd.
Customization Scope
Customization for segments, region/country-level will be provided. Moreover, additional customization can be done based on the requirements.
Pricing and Purchase Options
Avail customized purchase options to meet your exact research needs. We have three licenses to opt for: Single User License, Multi-User License (Up to 5 Users), Corporate Use License (Unlimited User and Printable PDF).
TABLE OF CONTENTS
1. EXECUTIVE SUMMARY
1.1. MARKET SNAPSHOT
1.2. KEY FINDINGS & INSIGHTS
1.3. ANALYST RECOMMENDATIONS
1.4. FUTURE OUTLOOK
2. RESEARCH METHODOLOGY
2.1. MARKET DEFINITION & SCOPE
2.2. RESEARCH OBJECTIVES: PRIMARY & SECONDARY DATA SOURCES
2.3. DATA COLLECTION SOURCES
2.3.1. COVERAGE OF 100+ PRIMARY RESEARCH/CONSULTATION CALLS WITH INDUSTRY STAKEHOLDERS
FIGURE 17 NORTH AMERICA SOLAR-TO-HYDROGEN POWER CONVERSION CURRENT AND FUTURE TYPE ANALYSIS, 2025–2034, (USD MILLION)
FIGURE 18 NORTH AMERICA SOLAR-TO-HYDROGEN POWER CONVERSION CURRENT AND FUTURE END USER ANALYSIS, 2025–2034, (USD MILLION)
FIGURE 19 MARKET SHARE BY COUNTRY
FIGURE 20 LATIN AMERICA SOLAR-TO-HYDROGEN POWER CONVERSION CURRENT AND FUTURE TYPE ANALYSIS, 2025–2034, (USD MILLION)
FIGURE 21 LATIN AMERICA SOLAR-TO-HYDROGEN POWER CONVERSION CURRENT AND FUTURE END USER ANALYSIS, 2025–2034, (USD MILLION)
FIGURE 22 MARKET SHARE BY COUNTRY
FIGURE 23 EASTERN EUROPE SOLAR-TO-HYDROGEN POWER CONVERSION CURRENT AND FUTURE TYPE ANALYSIS, 2025–2034, (USD MILLION)
FIGURE 24 EASTERN EUROPE SOLAR-TO-HYDROGEN POWER CONVERSION CURRENT AND FUTURE END USER ANALYSIS, 2025–2034, (USD MILLION)
FIGURE 25 MARKET SHARE BY COUNTRY
FIGURE 26 WESTERN EUROPE SOLAR-TO-HYDROGEN POWER CONVERSION CURRENT AND FUTURE TYPE ANALYSIS, 2025–2034, (USD MILLION)
FIGURE 27 WESTERN EUROPE SOLAR-TO-HYDROGEN POWER CONVERSION CURRENT AND FUTURE END USER ANALYSIS, 2025–2034, (USD MILLION)
FIGURE 28 MARKET SHARE BY COUNTRY
FIGURE 29 EAST ASIA AND PACIFIC SOLAR-TO-HYDROGEN POWER CONVERSION CURRENT AND FUTURE TYPE ANALYSIS, 2025–2034, (USD MILLION)
FIGURE 30 EAST ASIA AND PACIFIC SOLAR-TO-HYDROGEN POWER CONVERSION CURRENT AND FUTURE END USER ANALYSIS, 2025–2034, (USD MILLION)
FIGURE 31 MARKET SHARE BY COUNTRY
FIGURE 32 SEA AND SOUTH ASIA SOLAR-TO-HYDROGEN POWER CONVERSION CURRENT AND FUTURE TYPE ANALYSIS, 2025–2034, (USD MILLION)
FIGURE 33 SEA AND SOUTH ASIA SOLAR-TO-HYDROGEN POWER CONVERSION CURRENT AND FUTURE END USER ANALYSIS, 2025–2034, (USD MILLION)
FIGURE 34 MARKET SHARE BY COUNTRY
FIGURE 35 MIDDLE EAST AND AFRICA SOLAR-TO-HYDROGEN POWER CONVERSION CURRENT AND FUTURE TYPE ANALYSIS, 2025–2034, (USD MILLION)
FIGURE 36 MIDDLE EAST AND AFRICA SOLAR-TO-HYDROGEN POWER CONVERSION CURRENT AND FUTURE END USER ANALYSIS, 2025–2034, (USD MILLION)
FIGURE 37 NORTH AMERICA SOLAR-TO-HYDROGEN POWER CONVERSION CURRENT AND FUTURE MARKET VOLUME SHARE REGIONAL ANALYSIS, 2025–2034, (USD MILLION)
FIGURE 38 U.S. SOLAR-TO-HYDROGEN POWER CONVERSION CURRENT AND FUTURE TYPE ANALYSIS, 2025–2034, (USD MILLION)
FIGURE 39 U.S. SOLAR-TO-HYDROGEN POWER CONVERSION CURRENT AND FUTURE END USER ANALYSIS, 2025–2034, (USD MILLION)
FIGURE 40 CANADA SOLAR-TO-HYDROGEN POWER CONVERSION CURRENT AND FUTURE TYPE ANALYSIS, 2025–2034, (USD MILLION)
FIGURE 41 CANADA SOLAR-TO-HYDROGEN POWER CONVERSION CURRENT AND FUTURE END USER ANALYSIS, 2025–2034, (USD MILLION)
FIGURE 42 LATIN AMERICA SOLAR-TO-HYDROGEN POWER CONVERSION CURRENT AND FUTURE MARKET VOLUME SHARE REGIONAL ANALYSIS, 2025–2034, (USD MILLION)
FIGURE 43 MEXICO SOLAR-TO-HYDROGEN POWER CONVERSION CURRENT AND FUTURE TYPE ANALYSIS, 2025–2034, (USD MILLION)
FIGURE 44 MEXICO SOLAR-TO-HYDROGEN POWER CONVERSION CURRENT AND FUTURE END USER ANALYSIS, 2025–2034, (USD MILLION)
FIGURE 45 BRAZIL SOLAR-TO-HYDROGEN POWER CONVERSION CURRENT AND FUTURE TYPE ANALYSIS, 2025–2034, (USD MILLION)
FIGURE 46 BRAZIL SOLAR-TO-HYDROGEN POWER CONVERSION CURRENT AND FUTURE END USER ANALYSIS, 2025–2034, (USD MILLION)
FIGURE 47 ARGENTINA SOLAR-TO-HYDROGEN POWER CONVERSION CURRENT AND FUTURE TYPE ANALYSIS, 2025–2034, (USD MILLION)
FIGURE 48 ARGENTINA SOLAR-TO-HYDROGEN POWER CONVERSION CURRENT AND FUTURE END USER ANALYSIS, 2025–2034, (USD MILLION)
FIGURE 49 COLUMBIA SOLAR-TO-HYDROGEN POWER CONVERSION CURRENT AND FUTURE TYPE ANALYSIS, 2025–2034, (USD MILLION)
FIGURE 50 COLUMBIA SOLAR-TO-HYDROGEN POWER CONVERSION CURRENT AND FUTURE END USER ANALYSIS, 2025–2034, (USD MILLION)
FIGURE 51 REST OF LATIN AMERICA SOLAR-TO-HYDROGEN POWER CONVERSION CURRENT AND FUTURE TYPE ANALYSIS, 2025–2034, (USD MILLION)
FIGURE 52 REST OF LATIN AMERICA SOLAR-TO-HYDROGEN POWER CONVERSION CURRENT AND FUTURE END USER ANALYSIS, 2025–2034, (USD MILLION)
FIGURE 53 EASTERN EUROPE SOLAR-TO-HYDROGEN POWER CONVERSION CURRENT AND FUTURE MARKET VOLUME SHARE REGIONAL ANALYSIS, 2025–2034, (USD MILLION)
FIGURE 54 POLAND SOLAR-TO-HYDROGEN POWER CONVERSION CURRENT AND FUTURE TYPE ANALYSIS, 2025–2034, (USD MILLION)
FIGURE 55 POLAND SOLAR-TO-HYDROGEN POWER CONVERSION CURRENT AND FUTURE END USER ANALYSIS, 2025–2034, (USD MILLION)
FIGURE 56 RUSSIA SOLAR-TO-HYDROGEN POWER CONVERSION CURRENT AND FUTURE TYPE ANALYSIS, 2025–2034, (USD MILLION)
FIGURE 57 RUSSIA SOLAR-TO-HYDROGEN POWER CONVERSION CURRENT AND FUTURE END USER ANALYSIS, 2025–2034, (USD MILLION)
FIGURE 58 CZECH REPUBLIC SOLAR-TO-HYDROGEN POWER CONVERSION CURRENT AND FUTURE TYPE ANALYSIS, 2025–2034, (USD MILLION)
FIGURE 59 CZECH REPUBLIC SOLAR-TO-HYDROGEN POWER CONVERSION CURRENT AND FUTURE END USER ANALYSIS, 2025–2034, (USD MILLION)
FIGURE 60 ROMANIA SOLAR-TO-HYDROGEN POWER CONVERSION CURRENT AND FUTURE TYPE ANALYSIS, 2025–2034, (USD MILLION)
FIGURE 61 ROMANIA SOLAR-TO-HYDROGEN POWER CONVERSION CURRENT AND FUTURE END USER ANALYSIS, 2025–2034, (USD MILLION)
FIGURE 62 REST OF EASTERN EUROPE SOLAR-TO-HYDROGEN POWER CONVERSION CURRENT AND FUTURE TYPE ANALYSIS, 2025–2034, (USD MILLION)
FIGURE 63 REST OF EASTERN EUROPE SOLAR-TO-HYDROGEN POWER CONVERSION CURRENT AND FUTURE END USER ANALYSIS, 2025–2034, (USD MILLION)
FIGURE 64 WESTERN EUROPE SOLAR-TO-HYDROGEN POWER CONVERSION CURRENT AND FUTURE MARKET VOLUME SHARE REGIONAL ANALYSIS, 2025–2034, (USD MILLION)
FIGURE 65 GERMANY SOLAR-TO-HYDROGEN POWER CONVERSION CURRENT AND FUTURE TYPE ANALYSIS, 2025–2034, (USD MILLION)
FIGURE 66 GERMANY SOLAR-TO-HYDROGEN POWER CONVERSION CURRENT AND FUTURE END USER ANALYSIS, 2025–2034, (USD MILLION)
FIGURE 67 FRANCE SOLAR-TO-HYDROGEN POWER CONVERSION CURRENT AND FUTURE TYPE ANALYSIS, 2025–2034, (USD MILLION)
FIGURE 68 FRANCE SOLAR-TO-HYDROGEN POWER CONVERSION CURRENT AND FUTURE END USER ANALYSIS, 2025–2034, (USD MILLION)
FIGURE 69 UK SOLAR-TO-HYDROGEN POWER CONVERSION CURRENT AND FUTURE TYPE ANALYSIS, 2025–2034, (USD MILLION)
FIGURE 70 UK SOLAR-TO-HYDROGEN POWER CONVERSION CURRENT AND FUTURE END USER ANALYSIS, 2025–2034, (USD MILLION)
FIGURE 71 SPAIN SOLAR-TO-HYDROGEN POWER CONVERSION CURRENT AND FUTURE TYPE ANALYSIS, 2025–2034, (USD MILLION)
FIGURE 72 SPAIN SOLAR-TO-HYDROGEN POWER CONVERSION CURRENT AND FUTURE END USER ANALYSIS, 2025–2034, (USD MILLION)
FIGURE 73 ITALY SOLAR-TO-HYDROGEN POWER CONVERSION CURRENT AND FUTURE TYPE ANALYSIS, 2025–2034, (USD MILLION)
FIGURE 74 ITALY SOLAR-TO-HYDROGEN POWER CONVERSION CURRENT AND FUTURE END USER ANALYSIS, 2025–2034, (USD MILLION)
FIGURE 75 REST OF WESTERN EUROPE SOLAR-TO-HYDROGEN POWER CONVERSION CURRENT AND FUTURE TYPE ANALYSIS, 2025–2034, (USD MILLION)
FIGURE 76 REST OF WESTERN EUROPE SOLAR-TO-HYDROGEN POWER CONVERSION CURRENT AND FUTURE END USER ANALYSIS, 2025–2034, (USD MILLION)
FIGURE 77 EAST ASIA AND PACIFIC SOLAR-TO-HYDROGEN POWER CONVERSION CURRENT AND FUTURE MARKET VOLUME SHARE REGIONAL ANALYSIS, 2025–2034, (USD MILLION)
FIGURE 78 CHINA SOLAR-TO-HYDROGEN POWER CONVERSION CURRENT AND FUTURE TYPE ANALYSIS, 2025–2034, (USD MILLION)
FIGURE 79 CHINA SOLAR-TO-HYDROGEN POWER CONVERSION CURRENT AND FUTURE END USER ANALYSIS, 2025–2034, (USD MILLION)
FIGURE 80 JAPAN SOLAR-TO-HYDROGEN POWER CONVERSION CURRENT AND FUTURE TYPE ANALYSIS, 2025–2034, (USD MILLION)
FIGURE 81 JAPAN SOLAR-TO-HYDROGEN POWER CONVERSION CURRENT AND FUTURE END USER ANALYSIS, 2025–2034, (USD MILLION)
FIGURE 82 AUSTRALIA SOLAR-TO-HYDROGEN POWER CONVERSION CURRENT AND FUTURE TYPE ANALYSIS, 2025–2034, (USD MILLION)
FIGURE 83 AUSTRALIA SOLAR-TO-HYDROGEN POWER CONVERSION CURRENT AND FUTURE END USER ANALYSIS, 2025–2034, (USD MILLION)
FIGURE 84 CAMBODIA SOLAR-TO-HYDROGEN POWER CONVERSION CURRENT AND FUTURE TYPE ANALYSIS, 2025–2034, (USD MILLION)
FIGURE 85 CAMBODIA SOLAR-TO-HYDROGEN POWER CONVERSION CURRENT AND FUTURE END USER ANALYSIS, 2025–2034, (USD MILLION)
FIGURE 86 FIJI SOLAR-TO-HYDROGEN POWER CONVERSION CURRENT AND FUTURE TYPE ANALYSIS, 2025–2034, (USD MILLION)
FIGURE 87 FIJI SOLAR-TO-HYDROGEN POWER CONVERSION CURRENT AND FUTURE END USER ANALYSIS, 2025–2034, (USD MILLION)
FIGURE 88 INDONESIA SOLAR-TO-HYDROGEN POWER CONVERSION CURRENT AND FUTURE TYPE ANALYSIS, 2025–2034, (USD MILLION)
FIGURE 89 INDONESIA SOLAR-TO-HYDROGEN POWER CONVERSION CURRENT AND FUTURE END USER ANALYSIS, 2025–2034, (USD MILLION)
FIGURE 90 SOUTH KOREA SOLAR-TO-HYDROGEN POWER CONVERSION CURRENT AND FUTURE TYPE ANALYSIS, 2025–2034, (USD MILLION)
FIGURE 91 SOUTH KOREA SOLAR-TO-HYDROGEN POWER CONVERSION CURRENT AND FUTURE END USER ANALYSIS, 2025–2034, (USD MILLION)
FIGURE 92 REST OF EAST ASIA AND PACIFIC SOLAR-TO-HYDROGEN POWER CONVERSION CURRENT AND FUTURE TYPE ANALYSIS, 2025–2034, (USD MILLION)
FIGURE 93 REST OF EAST ASIA AND PACIFIC SOLAR-TO-HYDROGEN POWER CONVERSION CURRENT AND FUTURE END USER ANALYSIS, 2025–2034, (USD MILLION)
FIGURE 94 SEA AND SOUTH ASIA SOLAR-TO-HYDROGEN POWER CONVERSION CURRENT AND FUTURE MARKET VOLUME SHARE REGIONAL ANALYSIS, 2025–2034, (USD MILLION)
FIGURE 95 BANGLADESH SOLAR-TO-HYDROGEN POWER CONVERSION CURRENT AND FUTURE TYPE ANALYSIS, 2025–2034, (USD MILLION)
FIGURE 96 BANGLADESH SOLAR-TO-HYDROGEN POWER CONVERSION CURRENT AND FUTURE END USER ANALYSIS, 2025–2034, (USD MILLION)
FIGURE 97 NEW ZEALAND SOLAR-TO-HYDROGEN POWER CONVERSION CURRENT AND FUTURE TYPE ANALYSIS, 2025–2034, (USD MILLION)
FIGURE 98 NEW ZEALAND SOLAR-TO-HYDROGEN POWER CONVERSION CURRENT AND FUTURE END USER ANALYSIS, 2025–2034, (USD MILLION)
FIGURE 99 INDIA SOLAR-TO-HYDROGEN POWER CONVERSION CURRENT AND FUTURE TYPE ANALYSIS, 2025–2034, (USD MILLION)
FIGURE 100 INDIA SOLAR-TO-HYDROGEN POWER CONVERSION CURRENT AND FUTURE END USER ANALYSIS, 2025–2034, (USD MILLION)
FIGURE 101 SINGAPORE SOLAR-TO-HYDROGEN POWER CONVERSION CURRENT AND FUTURE TYPE ANALYSIS, 2025–2034, (USD MILLION)
FIGURE 102 SINGAPORE SOLAR-TO-HYDROGEN POWER CONVERSION CURRENT AND FUTURE END USER ANALYSIS, 2025–2034, (USD MILLION)
FIGURE 103 THAILAND SOLAR-TO-HYDROGEN POWER CONVERSION CURRENT AND FUTURE TYPE ANALYSIS, 2025–2034, (USD MILLION)
FIGURE 104 THAILAND SOLAR-TO-HYDROGEN POWER CONVERSION CURRENT AND FUTURE END USER ANALYSIS, 2025–2034, (USD MILLION)
FIGURE 105 TAIWAN SOLAR-TO-HYDROGEN POWER CONVERSION CURRENT AND FUTURE TYPE ANALYSIS, 2025–2034, (USD MILLION)
FIGURE 106 TAIWAN SOLAR-TO-HYDROGEN POWER CONVERSION CURRENT AND FUTURE END USER ANALYSIS, 2025–2034, (USD MILLION)
FIGURE 107 MALAYSIA SOLAR-TO-HYDROGEN POWER CONVERSION CURRENT AND FUTURE TYPE ANALYSIS, 2025–2034, (USD MILLION)
FIGURE 108 MALAYSIA SOLAR-TO-HYDROGEN POWER CONVERSION CURRENT AND FUTURE END USER ANALYSIS, 2025–2034, (USD MILLION)
FIGURE 109 REST OF SEA AND SOUTH ASIA SOLAR-TO-HYDROGEN POWER CONVERSION CURRENT AND FUTURE TYPE ANALYSIS, 2025–2034, (USD MILLION)
FIGURE 110 REST OF SEA AND SOUTH ASIA SOLAR-TO-HYDROGEN POWER CONVERSION CURRENT AND FUTURE END USER ANALYSIS, 2025–2034, (USD MILLION)
FIGURE 111 MIDDLE EAST AND AFRICA SOLAR-TO-HYDROGEN POWER CONVERSION CURRENT AND FUTURE MARKET VOLUME SHARE REGIONAL ANALYSIS, 2025–2034, (USD MILLION)
FIGURE 112 GCC COUNTRIES SOLAR-TO-HYDROGEN POWER CONVERSION CURRENT AND FUTURE TYPE ANALYSIS, 2025–2034, (USD MILLION)
FIGURE 113 GCC COUNTRIES SOLAR-TO-HYDROGEN POWER CONVERSION CURRENT AND FUTURE END USER ANALYSIS, 2025–2034, (USD MILLION)
FIGURE 114 SAUDI ARABIA SOLAR-TO-HYDROGEN POWER CONVERSION CURRENT AND FUTURE TYPE ANALYSIS, 2025–2034, (USD MILLION)
FIGURE 115 SAUDI ARABIA SOLAR-TO-HYDROGEN POWER CONVERSION CURRENT AND FUTURE END USER ANALYSIS, 2025–2034, (USD MILLION)
FIGURE 116 UAE SOLAR-TO-HYDROGEN POWER CONVERSION CURRENT AND FUTURE TYPE ANALYSIS, 2025–2034, (USD MILLION)
FIGURE 117 UAE SOLAR-TO-HYDROGEN POWER CONVERSION CURRENT AND FUTURE END USER ANALYSIS, 2025–2034, (USD MILLION)
FIGURE 118 BAHRAIN SOLAR-TO-HYDROGEN POWER CONVERSION CURRENT AND FUTURE TYPE ANALYSIS, 2025–2034, (USD MILLION)
FIGURE 119 BAHRAIN SOLAR-TO-HYDROGEN POWER CONVERSION CURRENT AND FUTURE END USER ANALYSIS, 2025–2034, (USD MILLION)
FIGURE 120 KUWAIT SOLAR-TO-HYDROGEN POWER CONVERSION CURRENT AND FUTURE TYPE ANALYSIS, 2025–2034, (USD MILLION)
FIGURE 121 KUWAIT SOLAR-TO-HYDROGEN POWER CONVERSION CURRENT AND FUTURE END USER ANALYSIS, 2025–2034, (USD MILLION)
FIGURE 122 OMAN SOLAR-TO-HYDROGEN POWER CONVERSION CURRENT AND FUTURE TYPE ANALYSIS, 2025–2034, (USD MILLION)
FIGURE 123 OMAN SOLAR-TO-HYDROGEN POWER CONVERSION CURRENT AND FUTURE END USER ANALYSIS, 2025–2034, (USD MILLION)
FIGURE 124 QATAR SOLAR-TO-HYDROGEN POWER CONVERSION CURRENT AND FUTURE TYPE ANALYSIS, 2025–2034, (USD MILLION)
FIGURE 125 QATAR SOLAR-TO-HYDROGEN POWER CONVERSION CURRENT AND FUTURE END USER ANALYSIS, 2025–2034, (USD MILLION)
FIGURE 126 EGYPT SOLAR-TO-HYDROGEN POWER CONVERSION CURRENT AND FUTURE TYPE ANALYSIS, 2025–2034, (USD MILLION)
FIGURE 127 EGYPT SOLAR-TO-HYDROGEN POWER CONVERSION CURRENT AND FUTURE END USER ANALYSIS, 2025–2034, (USD MILLION)
FIGURE 128 NIGERIA SOLAR-TO-HYDROGEN POWER CONVERSION CURRENT AND FUTURE TYPE ANALYSIS, 2025–2034, (USD MILLION)
FIGURE 129 NIGERIA SOLAR-TO-HYDROGEN POWER CONVERSION CURRENT AND FUTURE END USER ANALYSIS, 2025–2034, (USD MILLION)
FIGURE 130 SOUTH AFRICA SOLAR-TO-HYDROGEN POWER CONVERSION CURRENT AND FUTURE TYPE ANALYSIS, 2025–2034, (USD MILLION)
FIGURE 131 SOUTH AFRICA SOLAR-TO-HYDROGEN POWER CONVERSION CURRENT AND FUTURE END USER ANALYSIS, 2025–2034, (USD MILLION)
FIGURE 132 ISRAEL SOLAR-TO-HYDROGEN POWER CONVERSION CURRENT AND FUTURE TYPE ANALYSIS, 2025–2034, (USD MILLION)
FIGURE 133 ISRAEL SOLAR-TO-HYDROGEN POWER CONVERSION CURRENT AND FUTURE END USER ANALYSIS, 2025–2034, (USD MILLION)
FIGURE 134 REST OF MEA SOLAR-TO-HYDROGEN POWER CONVERSION CURRENT AND FUTURE TYPE ANALYSIS, 2025–2034, (USD MILLION)
FIGURE 135 REST OF MEA SOLAR-TO-HYDROGEN POWER CONVERSION CURRENT AND FUTURE END USER ANALYSIS, 2025–2034, (USD MILLION)
FIGURE 136 U. S. MARKET SHARE ANALYSIS BY TYPE (2024)
FIGURE 137 U. S. MARKET SHARE ANALYSIS BY END USER (2024)
FIGURE 138 CANADA MARKET SHARE ANALYSIS BY TYPE (2024)
FIGURE 139 CANADA MARKET SHARE ANALYSIS BY END USER (2024)
FIGURE 140 MEXICO MARKET SHARE ANALYSIS BY TYPE (2024)
FIGURE 141 MEXICO MARKET SHARE ANALYSIS BY END USER (2024)
FIGURE 142 CHINA MARKET SHARE ANALYSIS BY TYPE (2024)
FIGURE 143 CHINA MARKET SHARE ANALYSIS BY END USER (2024)
FIGURE 144 JAPAN MARKET SHARE ANALYSIS BY TYPE (2024)
FIGURE 145 JAPAN MARKET SHARE ANALYSIS BY END USER (2024)
FIGURE 146 INDIA MARKET SHARE ANALYSIS BY TYPE (2024)
FIGURE 147 INDIA MARKET SHARE ANALYSIS BY END USER (2024)
FIGURE 148 SOUTH KOREA MARKET SHARE ANALYSIS BY TYPE (2024)
FIGURE 149 SOUTH KOREA MARKET SHARE ANALYSIS BY END USER (2024)
FIGURE 150 SAUDI ARABIA MARKET SHARE ANALYSIS BY TYPE (2024)
FIGURE 151 SAUDI ARABIA MARKET SHARE ANALYSIS BY END USER (2024)
FIGURE 152 UAE MARKET SHARE ANALYSIS BY TYPE (2024)
FIGURE 153 UAE MARKET SHARE ANALYSIS BY END USER (2024)
FIGURE 154 EGYPT MARKET SHARE ANALYSIS BY TYPE (2024)
FIGURE 155 EGYPT MARKET SHARE ANALYSIS BY END USER (2024)
FIGURE 156 NIGERIA MARKET SHARE ANALYSIS BY TYPE (2024)
FIGURE 157 NIGERIA MARKET SHARE ANALYSIS BY END USER (2024)
FIGURE 158 SOUTH AFRICA MARKET SHARE ANALYSIS BY TYPE (2024)
FIGURE 159 SOUTH AFRICA MARKET SHARE ANALYSIS BY END USER (2024)
FIGURE 160 GERMANY MARKET SHARE ANALYSIS BY TYPE (2024)
FIGURE 161 GERMANY MARKET SHARE ANALYSIS BY END USER (2024)
FIGURE 162 FRANCE MARKET SHARE ANALYSIS BY TYPE (2024)
FIGURE 163 FRANCE MARKET SHARE ANALYSIS BY END USER (2024)
FIGURE 164 UK MARKET SHARE ANALYSIS BY TYPE (2024)
FIGURE 165 UK MARKET SHARE ANALYSIS BY END USER (2024)
FIGURE 166 SPAIN MARKET SHARE ANALYSIS BY TYPE (2024)
FIGURE 167 SPAIN MARKET SHARE ANALYSIS BY END USER (2024)
FIGURE 168 ITALY MARKET SHARE ANALYSIS BY TYPE (2024)
FIGURE 169 ITALY MARKET SHARE ANALYSIS BY END USER (2024)
FIGURE 170 BRAZIL MARKET SHARE ANALYSIS BY TYPE (2024)
FIGURE 171 BRAZIL MARKET SHARE ANALYSIS BY END USER (2024)
FIGURE 172 ARGENTINA MARKET SHARE ANALYSIS BY TYPE (2024)
FIGURE 173 ARGENTINA MARKET SHARE ANALYSIS BY END USER (2024)
FIGURE 174 COLUMBIA MARKET SHARE ANALYSIS BY TYPE (2024)
FIGURE 175 COLUMBIA MARKET SHARE ANALYSIS BY END USER (2024)
FIGURE 176 GLOBAL SOLAR-TO-HYDROGEN POWER CONVERSION CURRENT AND FUTURE MARKET KEY COUNTRY LEVEL ANALYSIS, 2024–2034, (USD MILLION)
FIGURE 177 FINANCIAL OVERVIEW:
Key Players Analysis:
Nel ASA: Nel ASA, based in Norway, is a leader in hydrogen production technologies, specializing in electrolyzers and hydrogen fueling stations. Established in 1927, the company has over 90 years of experience in the hydrogen sector, focusing on developing innovative solutions to drive the global transition to renewable energy. Its strategic partnerships and extensive project portfolio underscore its commitment to expanding hydrogen infrastructure worldwide.
ITM Power: ITM Power, headquartered in the UK, is renowned for its advanced hydrogen energy solutions, particularly PEM electrolyzers. The company focuses on manufacturing equipment for hydrogen generation through water electrolysis, catering to various sectors including transportation and industrial applications. With a strong commitment to sustainability, ITM Power collaborates with leading organizations to accelerate the adoption of hydrogen technologies across Europe and beyond.
Siemens AG: Siemens AG, a global powerhouse based in Germany, integrates cutting-edge technology and engineering solutions across multiple sectors, including energy. The company is heavily involved in the hydrogen market, offering a range of solutions such as electrolyzers and infrastructure for hydrogen production. Siemens emphasizes sustainability, aiming to incorporate green hydrogen into its energy portfolio while forming strategic alliances to enhance its market presence.
Air Products and Chemicals, Inc.: Air Products, headquartered in the U.S., is a global leader in industrial gases and hydrogen production. The company provides a wide array of solutions, including hydrogen production, distribution, and fueling technologies, primarily for industrial applications. Air Products is committed to advancing clean hydrogen initiatives, leveraging its extensive supply chain to support the transition to sustainable energy solutions across various industries.
Linde plc: Linde plc, based in the UK, is a leading industrial gases and engineering company that provides innovative hydrogen solutions. The company specializes in hydrogen production technologies, including electrolyzers and hydrogen fueling infrastructure, serving various industries such as automotive and chemicals. Linde focuses on strategic acquisitions and partnerships to enhance its hydrogen offerings and support the global shift toward cleaner energy sources.
Plug Power Inc.: Plug Power Inc., based in the U.S., specializes in alternative energy technology, primarily hydrogen fuel cell systems. The company develops and manufactures fuel cells for electric vehicles and backup power solutions. Plug Power aims to grow its market presence by expanding its fuel cell offerings and building a robust hydrogen supply network, catering to the increasing demand for clean energy solutions.
Hydrogenics Corporation (Cummins Inc.): Hydrogenics, a subsidiary of Cummins, operates out of Canada and focuses on hydrogen production and fuel cell technologies. The company develops PEM electrolyzers and fuel cell systems for a wide range of applications, including transportation and stationary power. Hydrogenics leverages Cummins’ extensive resources to enhance its hydrogen capabilities and expand its reach in the clean energy sector.
Green Hydrogen Systems A/S: Green Hydrogen Systems A/S, located in Denmark, specializes in the production of green hydrogen solutions through electrolysis. The company offers modular electrolysis systems designed for efficiency and scalability, targeting commercial and industrial markets. With a commitment to sustainability and innovation, Green Hydrogen Systems aims to contribute significantly to the global hydrogen economy.
McPhy Energy S.A.: McPhy Energy, headquartered in France, develops hydrogen production and storage solutions tailored for renewable energy applications. The company offers a range of products, including electrolyzers and hydrogen storage systems, focusing on industries seeking sustainable energy alternatives. McPhy Energy aims to expand its market share by enhancing its production capabilities and establishing a strong international presence in the hydrogen sector.
Ballard Power Systems Inc.: Ballard Power Systems, based in Canada, is a leader in fuel cell technology and hydrogen solutions for transportation and stationary power applications. The company develops fuel cell systems designed for buses, trucks, and marine uses. Ballard Power focuses on strategic partnerships to accelerate the commercialization of its fuel cell technology, positioning itself as a key player in the transition to clean energy.
Market Key Players
Nel ASA
ITM Power
Siemens AG
Air Products and Chemicals, Inc.
Linde plc
Plug Power Inc.
Hydrogenics Corporation (a Cummins Inc. company)
Sonnen GmbH
Ballard Power Systems Inc.
Green Hydrogen Systems A/S
McPhy Energy S.A.
H2V Industry
Enel Green Power S.p.A.
Thyssenkrupp AG
Toshiba Energy Systems & Solutions Corporation
Toyota Tsusho Corporation
Shell Hydrogen
Haldor Topsoe A/S
Revolution Energy
Ceres Media Ltd.
Driver:
Growing Demand for Renewable Energy
The increasing global emphasis on renewable energy sources is a significant driver of the solar-to-hydrogen power conversion market. Governments and organizations are setting ambitious carbon reduction targets to combat climate change, leading to heightened interest in sustainable energy solutions. Hydrogen is considered a clean fuel, with the potential to decarbonize sectors that are challenging to electrify, such as heavy industry and transportation. As more countries invest in hydrogen production technologies, the market is expected to witness substantial growth, driven by innovations in solar energy harnessing and conversion efficiency.
Technological Advancements
Rapid advancements in solar and hydrogen production technologies are propelling market growth. Innovations in electrolyzers, such as Proton Exchange Membrane (PEM) and alkaline systems, are enhancing efficiency and reducing operational costs, making solar-to-hydrogen conversion more economically viable. Furthermore, improvements in photovoltaic technologies, such as bifacial solar panels and concentrated solar power systems, are increasing the amount of solar energy that can be converted into hydrogen. As research continues to yield more efficient technologies, the cost-effectiveness and scalability of solar-to-hydrogen systems will likely attract further investment and adoption.
Government Support and Incentives
Government initiatives and financial incentives play a crucial role in advancing the solar-to-hydrogen market. Many countries are implementing policies to encourage renewable energy adoption, including grants, tax credits, and subsidies for hydrogen projects. For instance, initiatives like the Hydrogen Strategy in Europe and various clean energy programs in the U.S. aim to stimulate investment in hydrogen infrastructure. This support not only enhances the feasibility of solar-to-hydrogen projects but also encourages public-private partnerships, fostering innovation and driving down costs, ultimately making hydrogen a more accessible energy source.
Restrain:
High Initial Investment Costs
One of the primary restraints on the solar-to-hydrogen market is the high initial capital required for technology deployment. The cost of solar panels, electrolyzers, and hydrogen production systems can be significant, posing a barrier for many potential investors and end-users. Although operational costs may decrease over time, the upfront investment often discourages businesses and governments from pursuing solar-to-hydrogen projects. Additionally, the long payback period can lead to hesitance in adoption, particularly in regions where financial resources are limited or competing energy technologies are more established.
Infrastructure Challenges
The lack of adequate infrastructure for hydrogen production, storage, and distribution presents a considerable challenge to market growth. Unlike established fuels, hydrogen requires specialized facilities and transportation methods, such as pipelines and storage tanks, to ensure safety and efficiency. The absence of a robust hydrogen infrastructure can hinder the commercialization of solar-to-hydrogen technologies, making it difficult for companies to scale operations. Additionally, integration with existing energy systems is complex, requiring significant coordination and investment from multiple stakeholders, further slowing the market's progress.
Opportunities:
Emerging Markets
The expansion of solar-to-hydrogen technology in emerging markets presents significant growth opportunities. Countries in regions such as Southeast Asia, Africa, and Latin America have abundant solar resources but often lack reliable energy infrastructure. Implementing solar-to-hydrogen solutions can address energy access challenges while promoting sustainable development. As these regions seek to diversify their energy sources and reduce reliance on fossil fuels, there is a growing market for innovative hydrogen technologies. International partnerships and investment can further enhance the deployment of solar-to-hydrogen projects in these underserved markets.
Integration with Other Renewable Technologies
Another opportunity lies in the integration of solar-to-hydrogen systems with other renewable energy technologies. Hybrid systems that combine solar power with wind, biomass, or hydropower can enhance the reliability and efficiency of hydrogen production. This synergy allows for the generation of hydrogen even when solar energy is insufficient, ensuring a more consistent energy supply. Additionally, integrating hydrogen production with energy storage solutions can improve grid stability and provide backup power. As the focus on multi-faceted renewable energy systems grows, the solar-to-hydrogen market stands to benefit from collaborative innovations and cross-sector partnerships.
Trends:
Shift Towards Decentralized Hydrogen Production
A significant trend in the solar-to-hydrogen power conversion market is the shift toward decentralized hydrogen production. This approach allows for the generation of hydrogen at or near the point of use, reducing transportation costs and enhancing energy security. By integrating small-scale solar-to-hydrogen systems into local energy grids, communities can utilize abundant solar resources to meet their hydrogen needs without relying on centralized facilities. This trend is driven by advancements in technology, such as compact electrolyzers and modular solar systems, enabling more flexible and accessible hydrogen production. As energy demands evolve, decentralized systems are becoming increasingly attractive for sustainable development.
Recent Development:
In September 2024: Woodside Energy has initiated the commissioning phase of its H2OK project, a major green hydrogen facility located in Oklahoma, USA. This facility aims to produce hydrogen using renewable energy sources and has the potential to create over 1.5 million metric tons of hydrogen annually. The project reflects Woodside's commitment to establishing a sustainable energy future by investing in low-carbon solutions.
In September 2024: In Australia, an international consortium has announced plans for a significant renewable energy hub in Western Australia, aiming to generate 50 GW of power through solar and wind. This project is expected to include the production of green hydrogen, showcasing the collaboration between multiple global stakeholders to advance hydrogen technology and production.

 Aerospace And Defence
 Agriculture
 Automotive And Transportation
 Banking And Finance
 Business
 Chemicals And Materials
 Consumer And Retail
 Electronics And Semiconductors
 Food And Beverages
 Machinery & Equipments
 Manufacturing And Construction
 Medical Devices
 Others
 Pharmaceuticals And Healthcare
 Power And Energy
 Sports
 Technology

 Systems, Electrolyzers, Solar Thermal Systems, Hybrid Systems), End-User(Industrial, Transportation, Power Generation, Residential and Commercial Applications),Production Method(Photocatalytic Water Splitting, Photoelectrochemical Water Splitting, Thermochemical Water Splitting), Region and Key Players - Industry Segment Overview, Market Dynamics, Competitive Strategies, Trends and Forecast 2025-2034")
 Systems, Electrolyzers, Solar Thermal Systems, Hybrid Systems), End-User(Industrial, Transportation, Power Generation, Residential and Commercial Applications),Production Method(Photocatalytic Water Splitting, Photoelectrochemical Water Splitting, Thermochemical Water Splitting), Region and Key Players - Industry Segment Overview, Market Dynamics, Competitive Strategies, Trends and Forecast 2025-2034")
 Systems, Electrolyzers, Solar Thermal Systems, Hybrid Systems), End-User(Industrial, Transportation, Power Generation, Residential and Commercial Applications),Production Method(Photocatalytic Water Splitting, Photoelectrochemical Water Splitting, Thermochemical Water Splitting), Region and Key Players - Industry Segment Overview, Market Dynamics, Competitive Strategies, Trends and Forecast 2025-2034")
 Systems, Electrolyzers, Solar Thermal Systems, Hybrid Systems), End-User(Industrial, Transportation, Power Generation, Residential and Commercial Applications),Production Method(Photocatalytic Water Splitting, Photoelectrochemical Water Splitting, Thermochemical Water Splitting), Region and Key Players - Industry Segment Overview, Market Dynamics, Competitive Strategies, Trends and Forecast 2025-2034")

